- Analytics
- News and Tools
- Market News
- NZD/JPY Price Analysis: Bullish momentum flattens on the daily chart, buyers still in control
NZD/JPY Price Analysis: Bullish momentum flattens on the daily chart, buyers still in control
- The NZD/JPY settled at 91.12 mild losses in the Friday session.
- The daily RSI reveals a steady bullish momentum.
- Hourly chart indicators show a rising bullish sentiment despite some variability.
The NZD/JPY pair, with a slight decline, is currently trading at 91.12 in Friday's session.On the daily chart, the bullish momentum remains steady while the buyers are more present on the hourly timeframes.
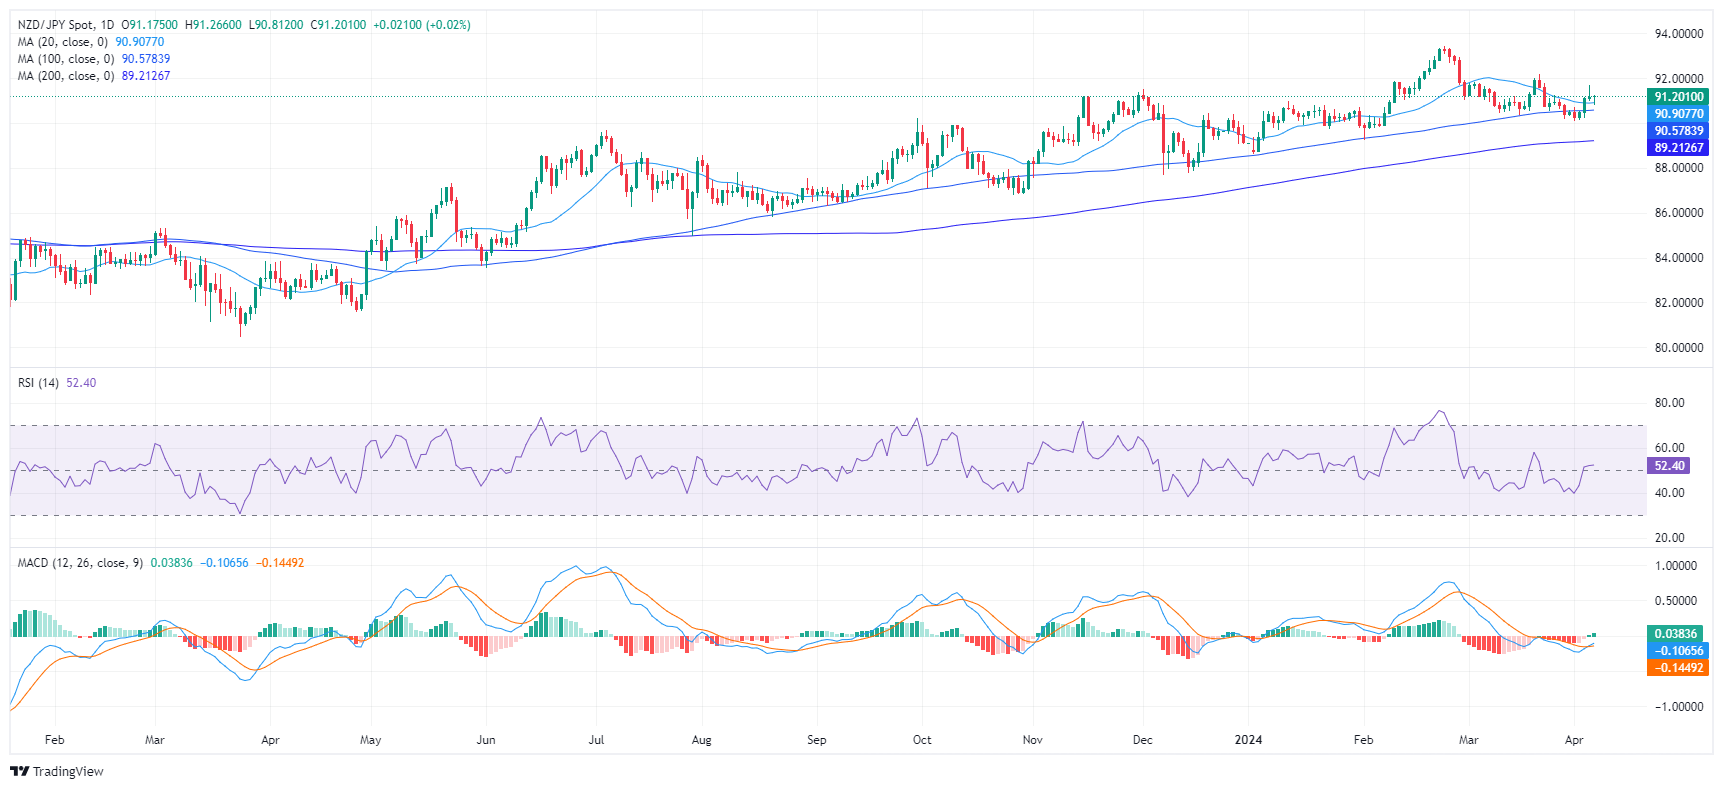
The daily chart reveals that the Relative Strength Index (RSI) for the pair is displaying a broadly favorable trend, with a recent rise from the negative zone into positive territory. Meanwhile, the Moving Average Convergence Divergence (MACD) is producing green bars, indicating positive ascending momentum.
NZD/JPY daily chart
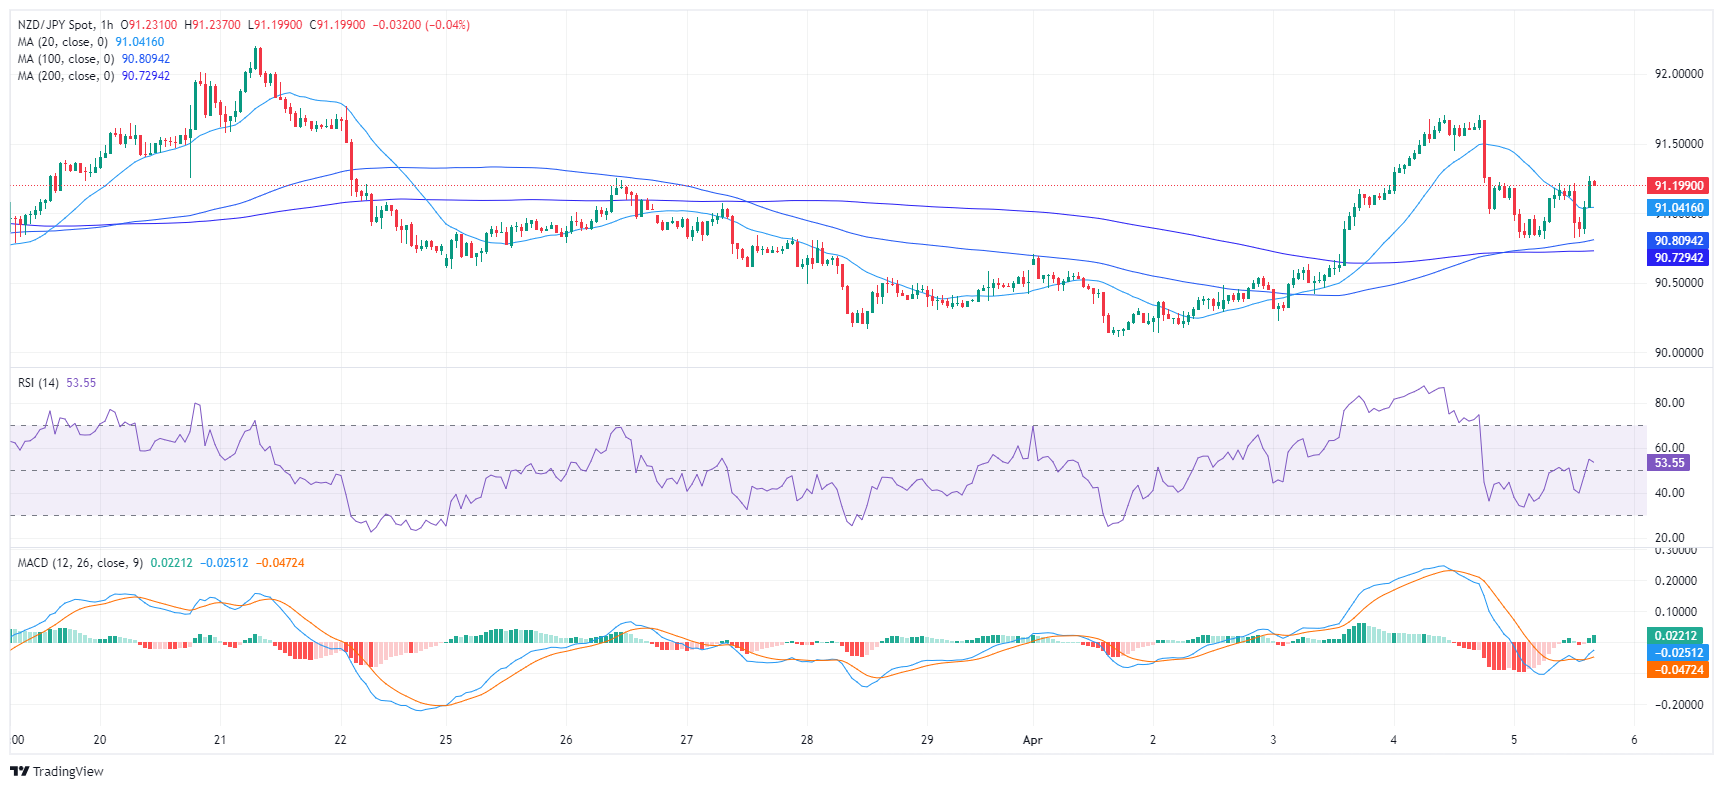
Turning attention to the hourly chart a similar pattern is observed in the RSI values. Despite some variability, in recent hours, the RSI remains in the positive sector, rendering the momentum chiefly bullish. The MACD supports this bullish inclination as it illustrates ascending green bars, implying intensified upward momentum on an hourly timeline.
NZD/JPY hourly chart
As for the overall trend, NZD/JPY sits above its 20,100 and 200-day Simple Moving Average (SMA), indicating a bullish stance in the long run.
In summary, as the daily and hourly RSI indicators, in conjunction with the MACD's green bars, the momentum favors the buyers. However, some flatness was seen in the daily indicators but as long as the pair remains above its main SMAs, the outlook will be positive.


© 2000-2026. All rights reserved.
This site is managed by Teletrade D.J. LLC 2351 LLC 2022 (Euro House, Richmond Hill Road, Kingstown, VC0100, St. Vincent and the Grenadines).
The information on this website is for informational purposes only and does not constitute any investment advice.
The company does not serve or provide services to customers who are residents of the US, Canada, Iran, The Democratic People's Republic of Korea, Yemen and FATF blacklisted countries.
Making transactions on financial markets with marginal financial instruments opens up wide possibilities and allows investors who are willing to take risks to earn high profits, carrying a potentially high risk of losses at the same time. Therefore you should responsibly approach the issue of choosing the appropriate investment strategy, taking the available resources into account, before starting trading.
Use of the information: full or partial use of materials from this website must always be referenced to TeleTrade as the source of information. Use of the materials on the Internet must be accompanied by a hyperlink to teletrade.org. Automatic import of materials and information from this website is prohibited.
Please contact our PR department if you have any questions or need assistance at pr@teletrade.global.
transfers