- Analytics
- News and Tools
- Market News
- Silver Price Analysis: XAG/USD peaks to new three-year high above $27.00
Silver Price Analysis: XAG/USD peaks to new three-year high above $27.00
- Silver's surge to multi-year highs reflects strong precious metals momentum, undeterred by US job market.
- Technical outlook hints at more gains, with resistances at $27.50, $28.00.
- RSI dip may prompt support tests at $27.00, $26.12 for future direction clues.
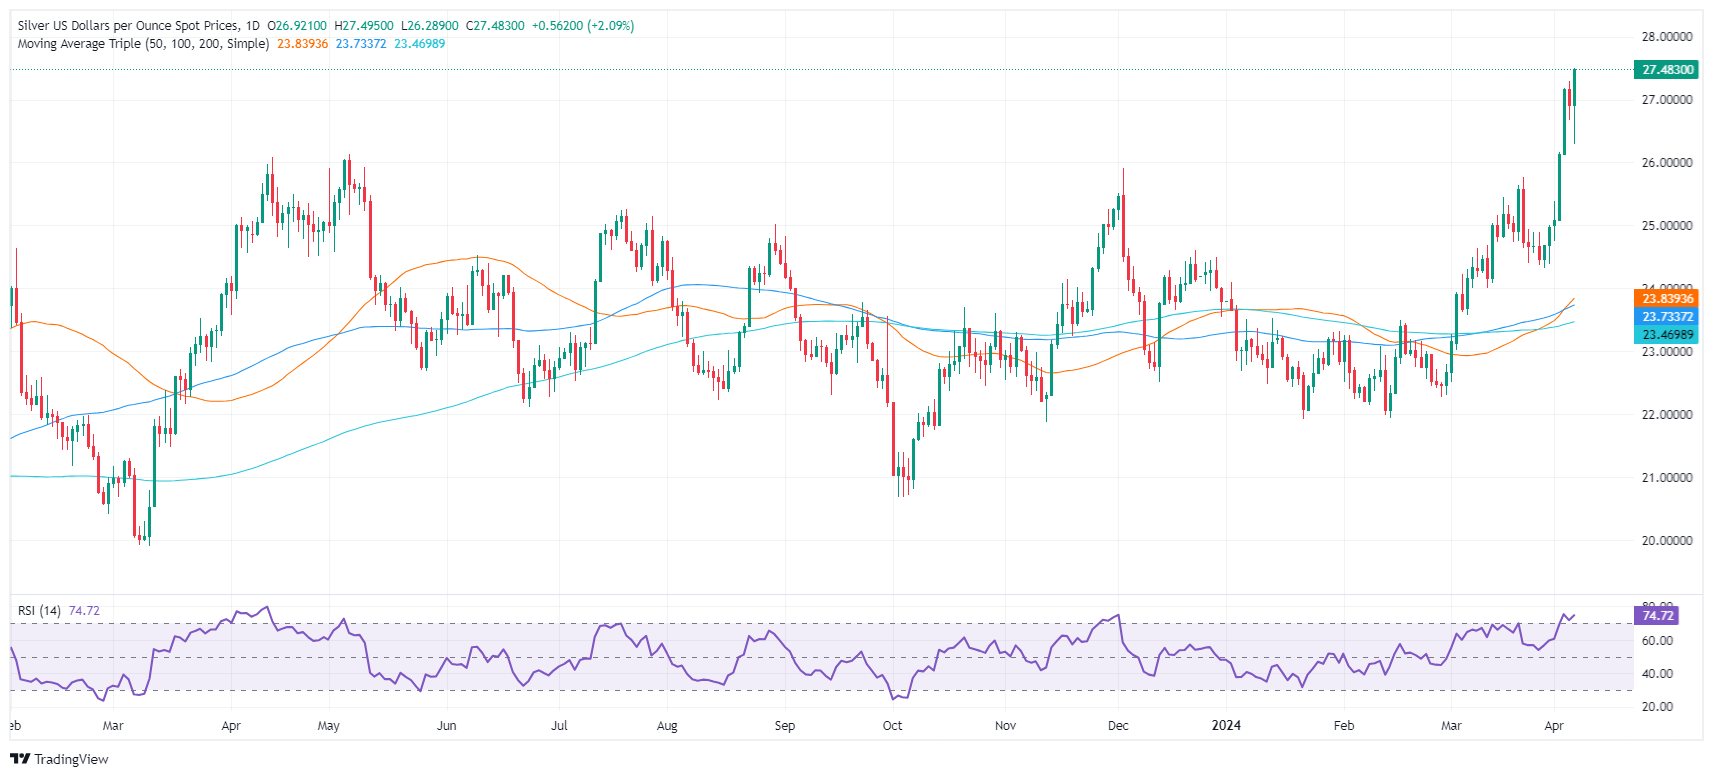
Silver soared sharply and finished the week with gains of close to 10%, hitting three-year highs after reaching levels last seen in June 2021. At the time of writing, XAG/USD trades at $27.45 a troy ounce, gaining more than 2%.
The precious metals segment ignored an upbeat US jobs report that might delay the Federal Reserve from slashing rates in the June meeting. According to the CME FedWatch Tool, market participants decreased their bets on a quarter-percentage-point rate cut in June, though July remains in play. Silver followed Gold’s path, though the latter is trading at all-time highs.
XAG/USD Price Analysis: Technical outlook
The grey metal daily chart shows Silver dipped as low as $26.29 after the US NFP release but, in the aftermath, rallied to multi-year highs. The Relative Strength Index (RSI) despite being at overbought conditions, aims up, an indication that buyers are gathering momentum. That said, XAG/USD next resistance would be $27.50, followed by the $28.00 psychological mark. Key resistance lies at June 10, 2021, high at $28.28.
On the other hand, if the RSI punches below the 70 level, that could sponsor a pullback, toward the $27.00 figure. The next support would be the May 5, 2023 high turned support at $26.12, followed by the $26.00 figure.
XAG/USD Price Action – Daily Chart


© 2000-2026. All rights reserved.
This site is managed by Teletrade D.J. LLC 2351 LLC 2022 (Euro House, Richmond Hill Road, Kingstown, VC0100, St. Vincent and the Grenadines).
The information on this website is for informational purposes only and does not constitute any investment advice.
The company does not serve or provide services to customers who are residents of the US, Canada, Iran, The Democratic People's Republic of Korea, Yemen and FATF blacklisted countries.
Making transactions on financial markets with marginal financial instruments opens up wide possibilities and allows investors who are willing to take risks to earn high profits, carrying a potentially high risk of losses at the same time. Therefore you should responsibly approach the issue of choosing the appropriate investment strategy, taking the available resources into account, before starting trading.
Use of the information: full or partial use of materials from this website must always be referenced to TeleTrade as the source of information. Use of the materials on the Internet must be accompanied by a hyperlink to teletrade.org. Automatic import of materials and information from this website is prohibited.
Please contact our PR department if you have any questions or need assistance at pr@teletrade.global.
transfers