- Analytics
- News and Tools
- Market News
- EUR/JPY Price Analysis: Bulls step in and momentum grows
EUR/JPY Price Analysis: Bulls step in and momentum grows
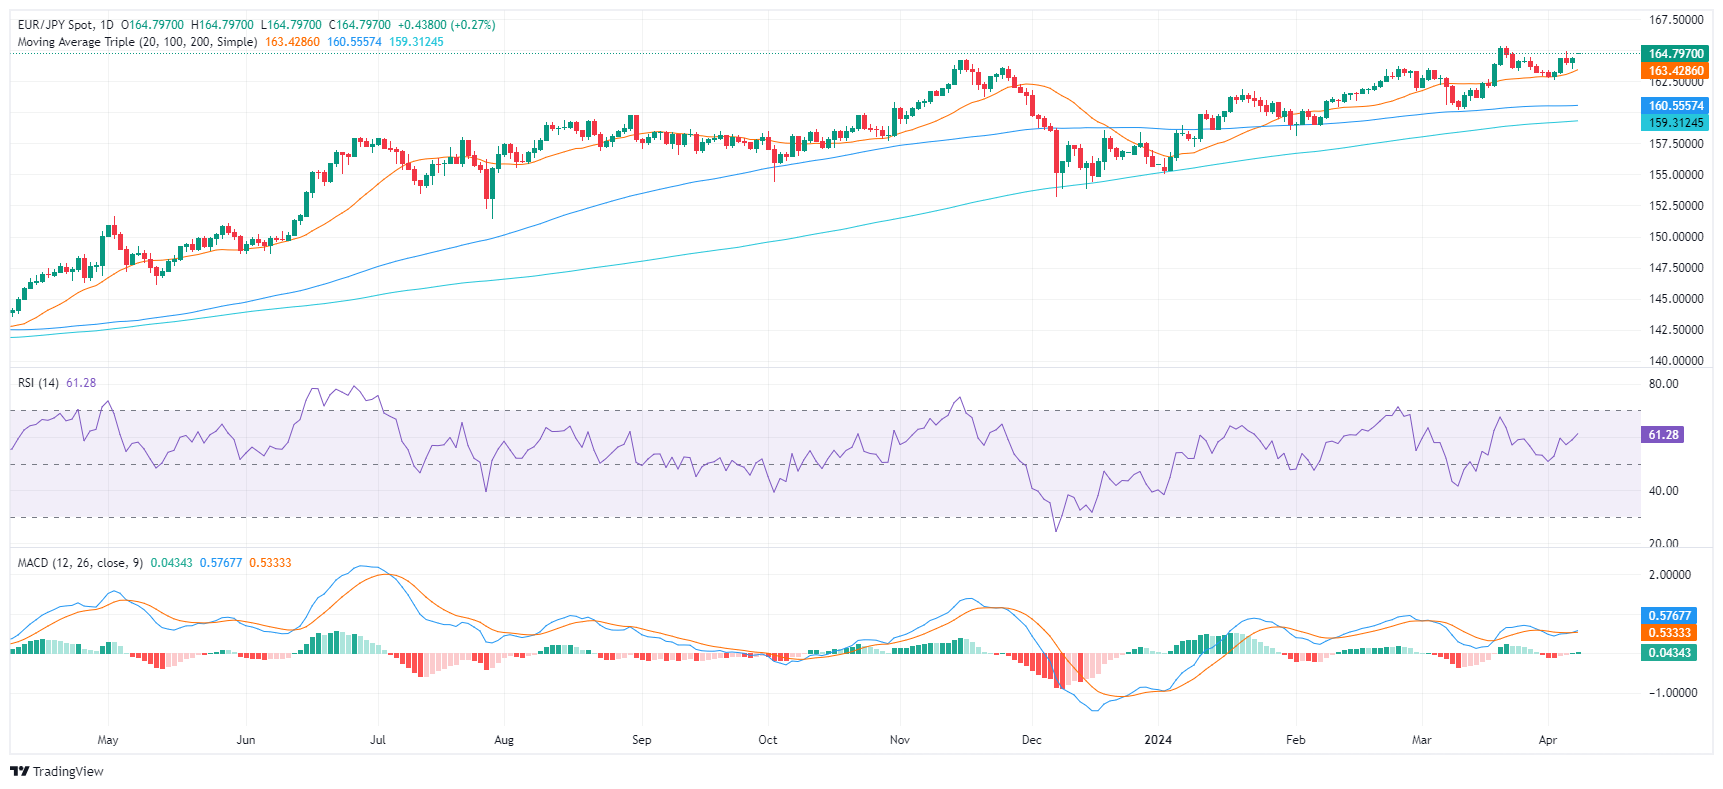
- The daily chart analysis of EUR/JPY reveals a strong buying momentum, as indicated by RSI and MACD in the positive territory.
- The MACD on the daily and hourly charts shows growing buying traction, reinforcing the bullish trend.
- The pair stance above the crucial Simple Moving Averages indicates a prolonged bullish phase.
The EUR/JPY currency pair currently trades at 164.78, demonstrating a daily gain of 0.28%. It suggests a likely continued bullish phase, well positioned above essential Simple Moving Averages (SMAs). The market's current stance signifies the dominance of buyers, with long positions appearing favorable.
On the daily chart, the Relative Strength Index (RSI) resides in the positive territory, hovering at around 62, near to the overbought region, which suggests a rather potent buying pressure. Concurrently, the Moving Average Convergence Divergence (MACD) displays ascending green bars, signifying positive momentum.
EUR/JPY daily chart
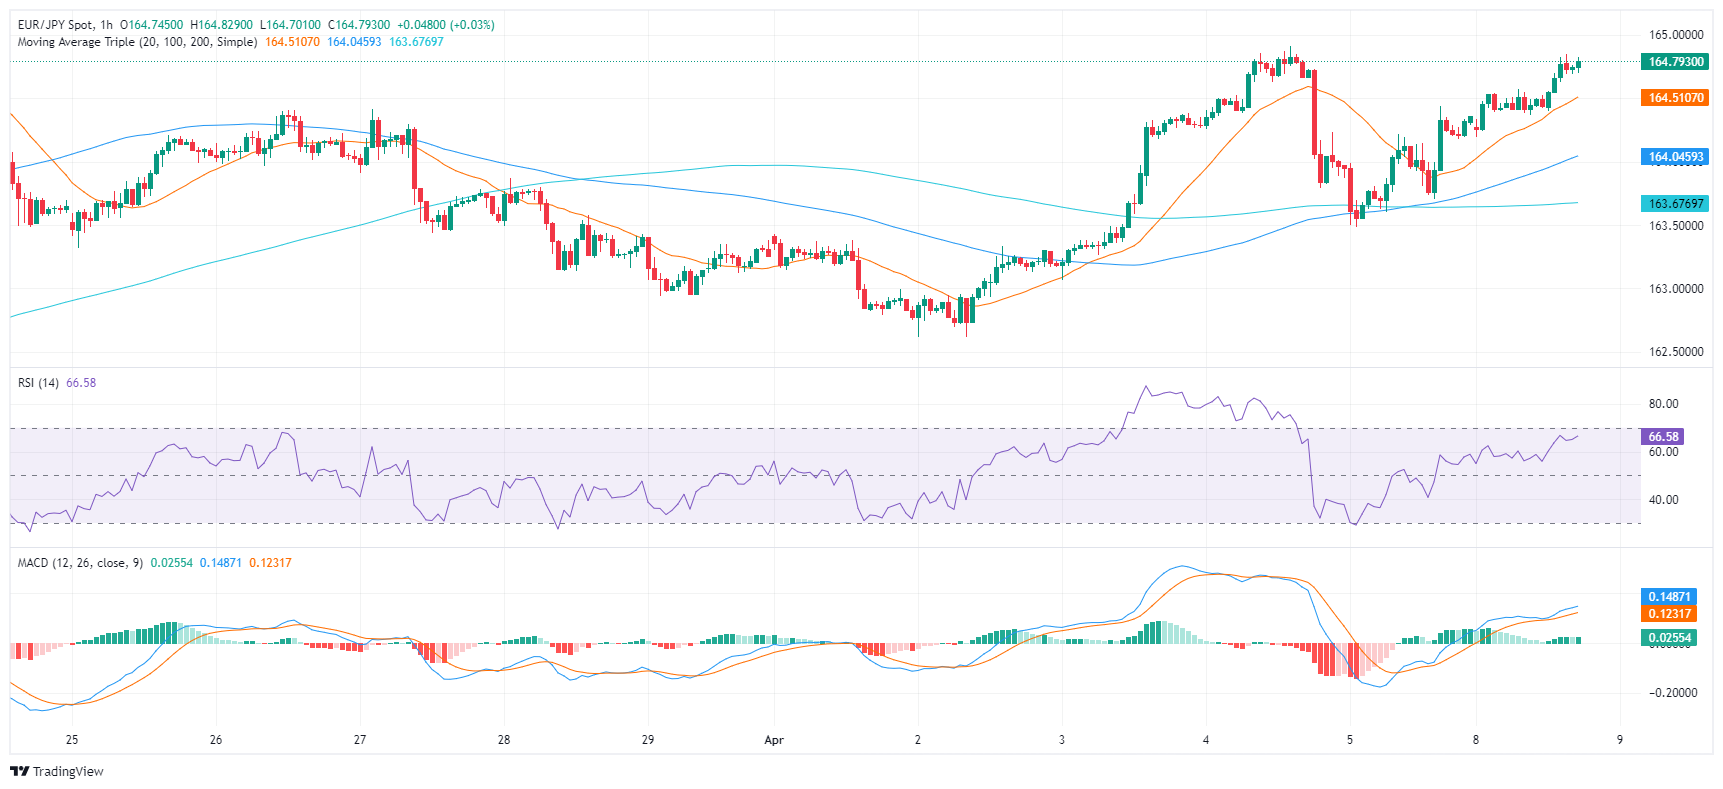
Turning to the hourly chart, the RSI portrays a similar bullish sentiment, as its latest reading registers at 67. The MACD remains consistent with the daily chart, as it exhibits an emerging green bar, indicating enhanced positive momentum. This corroborates the dominance of buyers in this time frame as well.
EUR/JPY hourly chart
Considering the broader outlook, the EUR/JPY appears to be in a solid position, standing above the 20-day, 100-day, and 200-day Simple Moving Averages (SMAs). SMAs are crucial as positions above these levels suggest a prevailing bullish trend. The higher above the SMA, the stronger the bullish sentiment.


© 2000-2026. All rights reserved.
This site is managed by Teletrade D.J. LLC 2351 LLC 2022 (Euro House, Richmond Hill Road, Kingstown, VC0100, St. Vincent and the Grenadines).
The information on this website is for informational purposes only and does not constitute any investment advice.
The company does not serve or provide services to customers who are residents of the US, Canada, Iran, The Democratic People's Republic of Korea, Yemen and FATF blacklisted countries.
Making transactions on financial markets with marginal financial instruments opens up wide possibilities and allows investors who are willing to take risks to earn high profits, carrying a potentially high risk of losses at the same time. Therefore you should responsibly approach the issue of choosing the appropriate investment strategy, taking the available resources into account, before starting trading.
Use of the information: full or partial use of materials from this website must always be referenced to TeleTrade as the source of information. Use of the materials on the Internet must be accompanied by a hyperlink to teletrade.org. Automatic import of materials and information from this website is prohibited.
Please contact our PR department if you have any questions or need assistance at pr@teletrade.global.
transfers