- Analytics
- News and Tools
- Market News
- NZD/JPY Price Analysis: Bullish bias maintains strength, with potential for minor pullbacks
NZD/JPY Price Analysis: Bullish bias maintains strength, with potential for minor pullbacks
- Daily RSI shows rising buying traction, while a positive MACD suggests a growing momentum.
- On the hourly chart, the same indicators hint at potential short-term pullbacks due to minor negative momentum.
- Despite a bullish overall outlook, the buyers need to defend short-term SMAs and defend them to prevent potential losses.
The NZD/JPY pair is trading at 91.79, experiencing a 0.25% uptick. It is currently showcasing a strong bullish course, with reinforced buying momentum as it comfortably positions above its main Simple Moving Average (SMA). Indicators remain strong on the daily chart while hourly indicators may be hinting at an incoming consolidation.
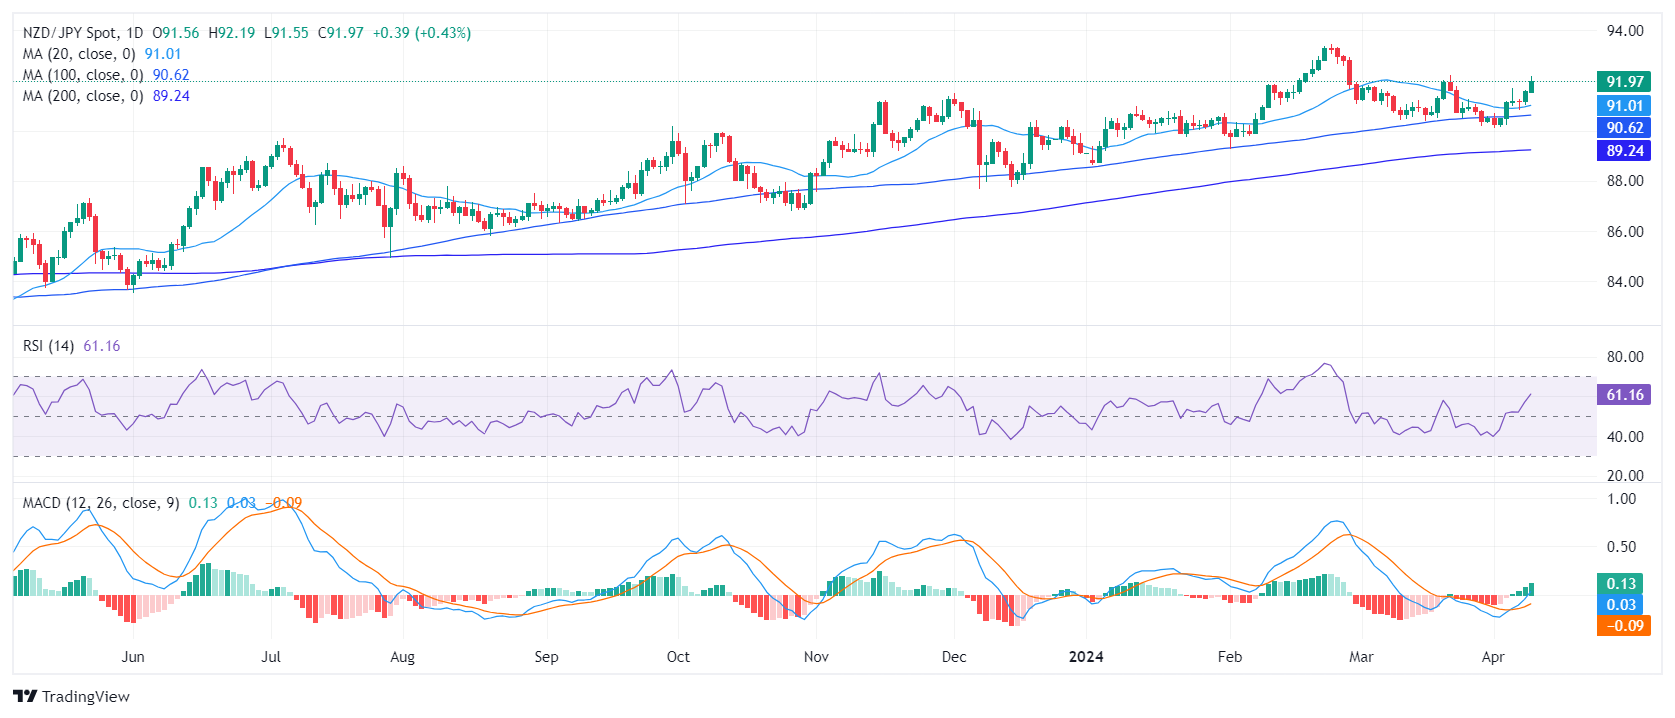
On the daily chart, the Relative Strength Index (RSI) is comfortably positioned within positive territory, suggesting that buying pressure outweighs selling pressure. Moreover, the Moving Average Convergence Divergence (MACD) shows rising green bars, an indication of growing buying momentum.
NZD/JPY daily chart
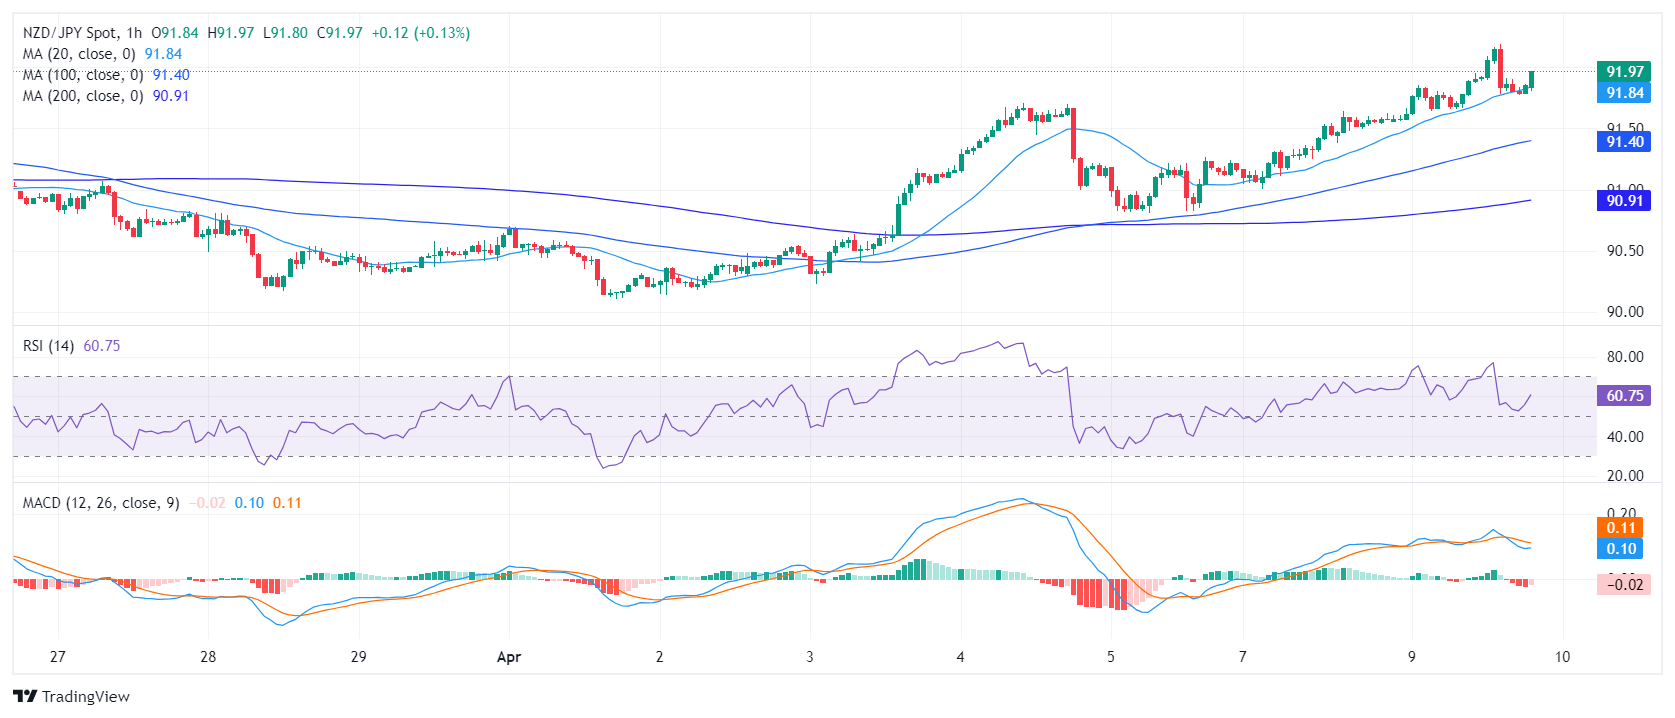
Switching to the hourly chart, a somewhat comparable trend is noticeable. The RSI took a big hit during the American session and seems to be slowly recovering. The hourly MACD, however, presents red bars, hinting at possible short-term negative momentum. This suggests that some caution is needed for intra-day traders.
NZD/JPY hourly chart
On the broader outlook, the NZD/JPY maintains its position above the 20, 100, and 200-day SMAs, indicating sustained long-term buying pressure. Therefore, both the short-term and long-term technical outlook for the pair seems to point towards a bullish trend. In summary, while the hourly MACD reveals minor negativity which may produce some temporary pullbacks, the overall bias for cross on both the daily and longer-term charts is bullish


© 2000-2026. All rights reserved.
This site is managed by Teletrade D.J. LLC 2351 LLC 2022 (Euro House, Richmond Hill Road, Kingstown, VC0100, St. Vincent and the Grenadines).
The information on this website is for informational purposes only and does not constitute any investment advice.
The company does not serve or provide services to customers who are residents of the US, Canada, Iran, The Democratic People's Republic of Korea, Yemen and FATF blacklisted countries.
Making transactions on financial markets with marginal financial instruments opens up wide possibilities and allows investors who are willing to take risks to earn high profits, carrying a potentially high risk of losses at the same time. Therefore you should responsibly approach the issue of choosing the appropriate investment strategy, taking the available resources into account, before starting trading.
Use of the information: full or partial use of materials from this website must always be referenced to TeleTrade as the source of information. Use of the materials on the Internet must be accompanied by a hyperlink to teletrade.org. Automatic import of materials and information from this website is prohibited.
Please contact our PR department if you have any questions or need assistance at pr@teletrade.global.
transfers