- Analytics
- News and Tools
- Market News
- NZD/USD Price Analysis: Bears weaken as bullish momentum hints at possible recovery
NZD/USD Price Analysis: Bears weaken as bullish momentum hints at possible recovery
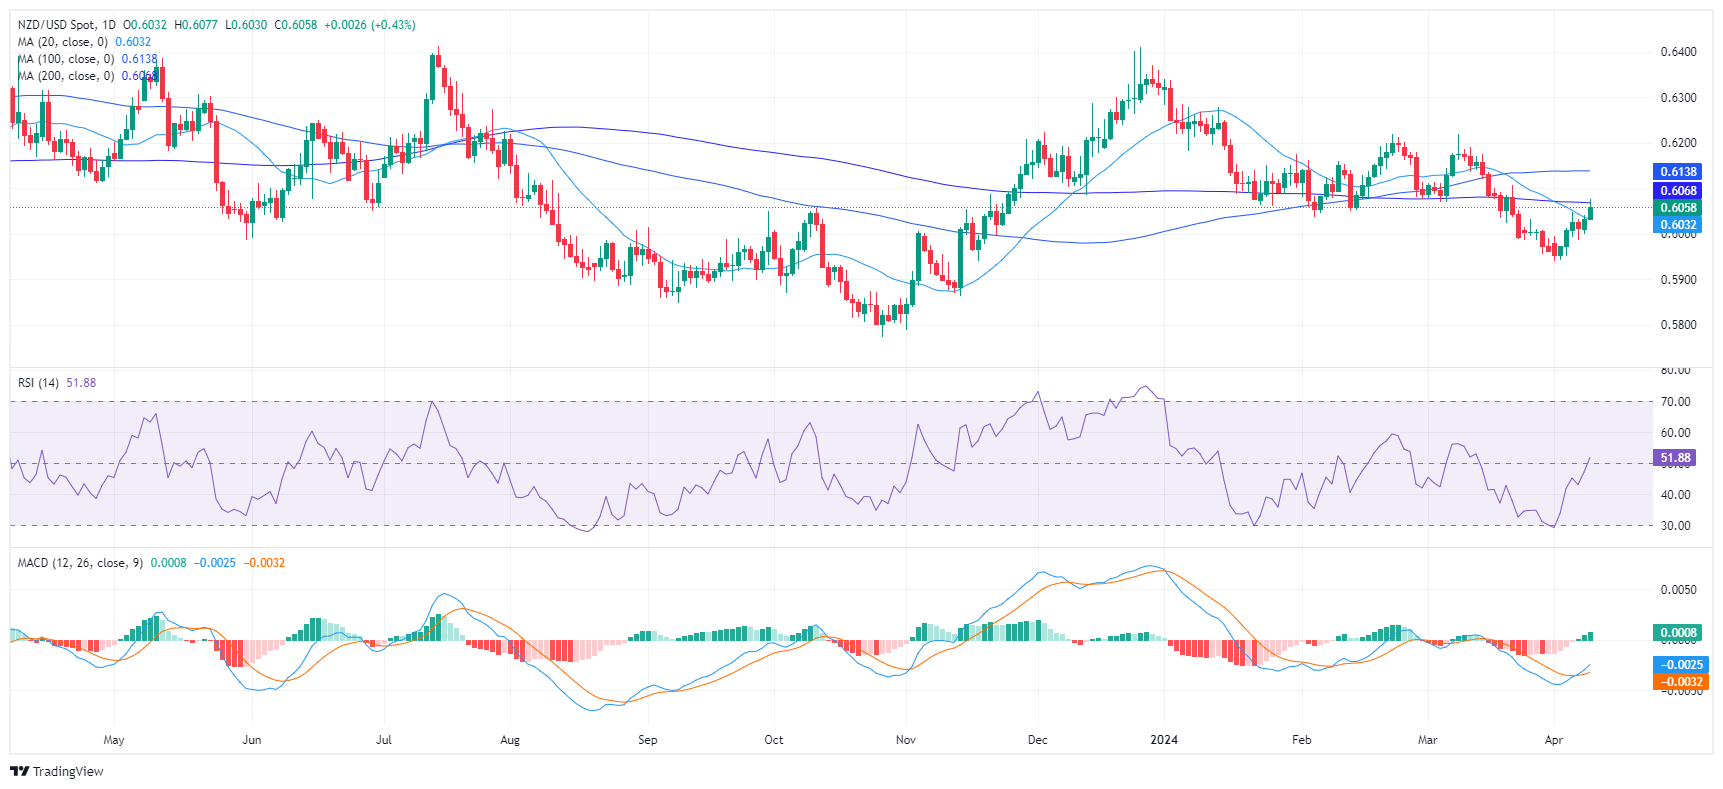
- The daily chart reveals a shift in NZD/USD from a bearish to a bullish short-term outlook.
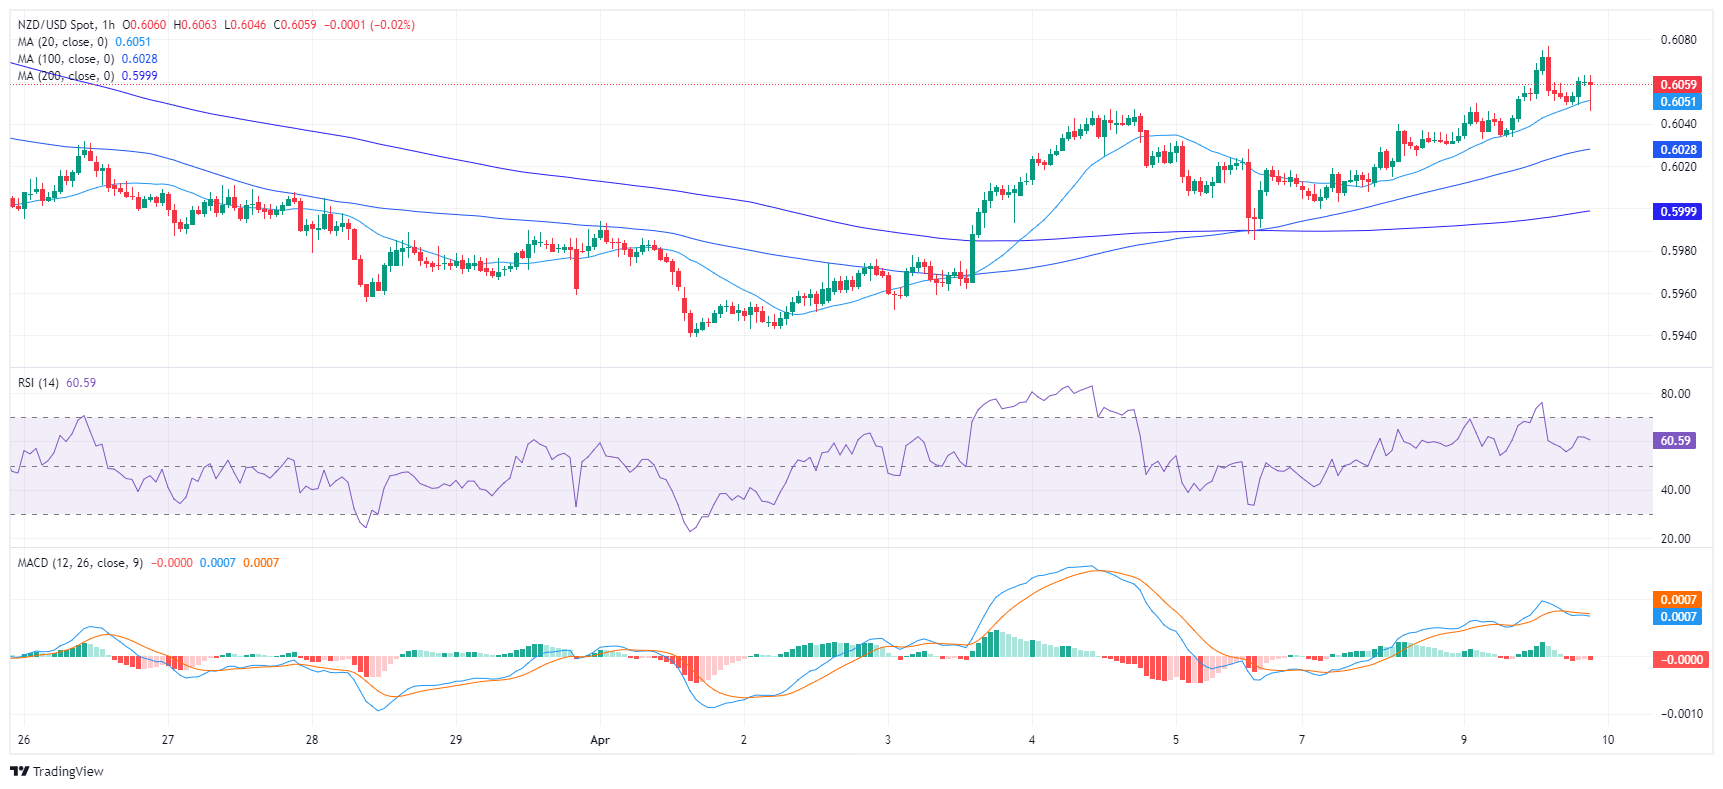
- Hourly chart indicators echo the bullish trend visible in the daily analysis.
- Buyers will need to claim dominance over key SMAs to make strides in the market.
The NZD/USD rose to around 0.6058, reflecting a 0.41% gain on Tuesday's session. Despite the pair experiencing a momentum shift from bearish to bullish, it is positioned beneath key Simple Moving Averages (SMAs), hinting at a possible extended downtrend.
On the daily chart, the Relative Strength Index (RSI) rose from negative territory and is now within the positive zone. This indicates a reversal from a bearish trend to a bullish short-term outlook. Further strengthening that, the Moving Average Convergence Divergence (MACD) histogram prints rising green bars for the first time since mid-March, signaling a potential upward momentum.
NZD/USD daily chart
Turning to the hourly chart, the RSI is on the rise, mirroring the trend found on the daily chart. The MACD histogram on the hourly scale is relatively flat but displays red bars, indicating a mild negative momentum, probably hinting that the bulls are taking profits after the RSI hit overbought conditions earlier in the session.
NZD/USD hourly chart
Regarding the overall trend, the NZD/USD has demonstrated a significant jump above its 20-day Simple Moving Average (SMA), suggesting a bullish shift in the short-term outlook. This development indicates that the pair has found some near-term buying strength. However, it continues to be positioned below both the 100 and 200-day SMA, implying a long-term bearish stance. Further to this, the pair was recently rejected by its 100-day SMA at 0.6138, suggesting a reinforced resistance at this level. A sustained move above this level would be required to alter the overall bearish bias.


© 2000-2026. All rights reserved.
This site is managed by Teletrade D.J. LLC 2351 LLC 2022 (Euro House, Richmond Hill Road, Kingstown, VC0100, St. Vincent and the Grenadines).
The information on this website is for informational purposes only and does not constitute any investment advice.
The company does not serve or provide services to customers who are residents of the US, Canada, Iran, The Democratic People's Republic of Korea, Yemen and FATF blacklisted countries.
Making transactions on financial markets with marginal financial instruments opens up wide possibilities and allows investors who are willing to take risks to earn high profits, carrying a potentially high risk of losses at the same time. Therefore you should responsibly approach the issue of choosing the appropriate investment strategy, taking the available resources into account, before starting trading.
Use of the information: full or partial use of materials from this website must always be referenced to TeleTrade as the source of information. Use of the materials on the Internet must be accompanied by a hyperlink to teletrade.org. Automatic import of materials and information from this website is prohibited.
Please contact our PR department if you have any questions or need assistance at pr@teletrade.global.
transfers