- Analytics
- News and Tools
- Market News
- EUR/JPY Price Analysis: Bulls lose traction, possible market cooling may follow
EUR/JPY Price Analysis: Bulls lose traction, possible market cooling may follow
- The daily RSI for EUR/JPY reveals a possible reduction in positive market momentum, signifying diminishing buyers' influence.
- The hourly indicators suggest a growing selling pressure.
The EUR/JPY pair is trading at 164.25 and has decreased by 0.30% in Wednesday’s session. Despite being positioned above its key Simple Moving Averages (SMAs), the pair is experiencing a potential shift in momentum from bulls to bears with technical indicators losing traction.
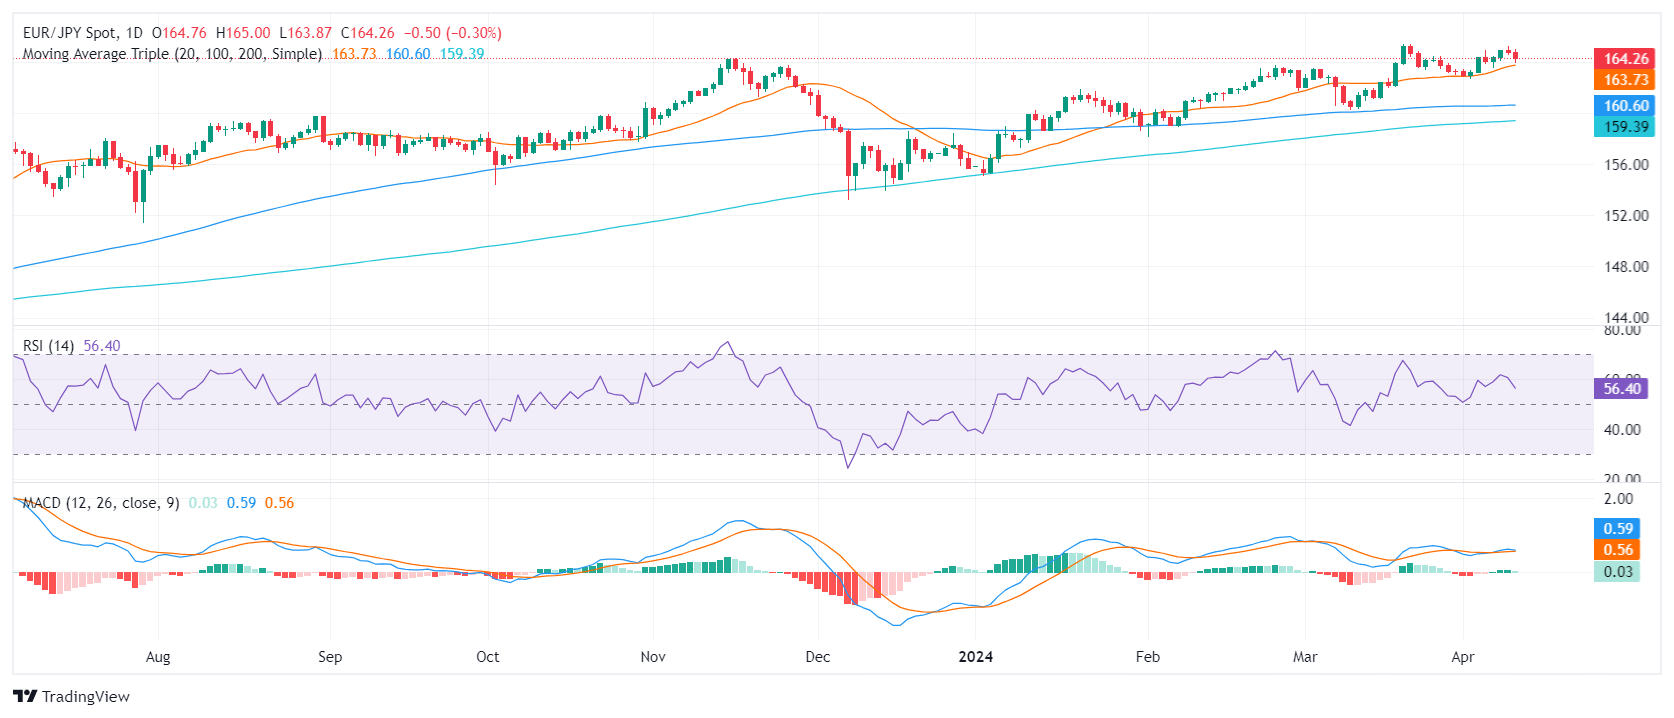
On the daily chart, the Relative Strength Index (RSI) for the pair is positioned in positive territory but points down. This, coupled with the sharp decrease in the green bars of the Moving Average Convergence Divergence (MACD), points to a possible reduction in positive market momentum. It indicates that the influence of buyers is potentially dwindling in the market. As such, the pair may start to cool off.
EUR/JPY daily chart
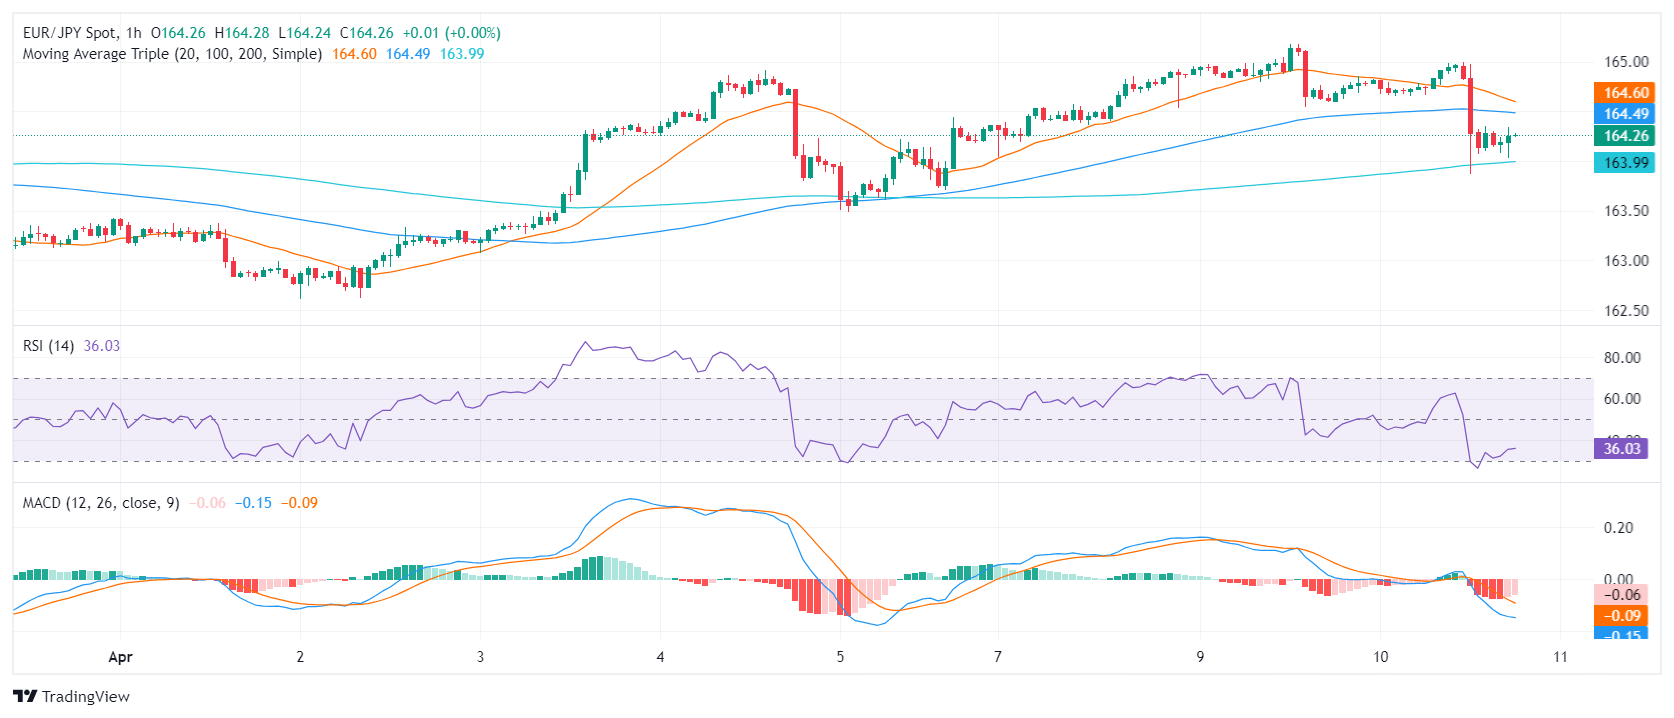
Zooming in, the hourly RSI value hovers mostly in the oversold region, with the latest value just above 30. Additionally, the MACD histogram on this timeframe presents rising red bars, showcasing an increase in negative momentum. This hints at a rise in sellers' dominance in the market.
EUR/JPY hourly chart
Inspecting the broader outlook, the EUR/JPY demonstrates considerably bullish signals. It stands above the 20-day, 100-day, and 200-day Simple Moving Averages (SMA). Such a position typically signifies a strong and resilient upward trend for both short-term and long-term scenarios. However, today's significant movements must be taken into account. Notably, the pair is challenging the 20-day SMA at the 163.72 mark. If the selling momentum grows and bears conquer the 20-day average, the pair may see further downside.


© 2000-2026. All rights reserved.
This site is managed by Teletrade D.J. LLC 2351 LLC 2022 (Euro House, Richmond Hill Road, Kingstown, VC0100, St. Vincent and the Grenadines).
The information on this website is for informational purposes only and does not constitute any investment advice.
The company does not serve or provide services to customers who are residents of the US, Canada, Iran, The Democratic People's Republic of Korea, Yemen and FATF blacklisted countries.
Making transactions on financial markets with marginal financial instruments opens up wide possibilities and allows investors who are willing to take risks to earn high profits, carrying a potentially high risk of losses at the same time. Therefore you should responsibly approach the issue of choosing the appropriate investment strategy, taking the available resources into account, before starting trading.
Use of the information: full or partial use of materials from this website must always be referenced to TeleTrade as the source of information. Use of the materials on the Internet must be accompanied by a hyperlink to teletrade.org. Automatic import of materials and information from this website is prohibited.
Please contact our PR department if you have any questions or need assistance at pr@teletrade.global.
transfers