- Analytics
- News and Tools
- Market News
- NZD/JPY Price Analysis: Bears advance and target the 20-day SMA
NZD/JPY Price Analysis: Bears advance and target the 20-day SMA
- The hourly chart indicators reveal a mounting selling pressure, hinting at a pause in bullish momentum.
- To maintain the current bullish momentum, it's essential for the pair to uphold its standing above the key SMA.
The NZD/JPY pair declined near the 91.33 mark, indicating a battle between optimism favoring a bullish market and mounting bearish pressure. The market trend leans towards the bullish side as the pair stays above critical Simple Moving Averages (SMAs) levels; however, a shift in momentum toward downward forces suggests impending consolidation.
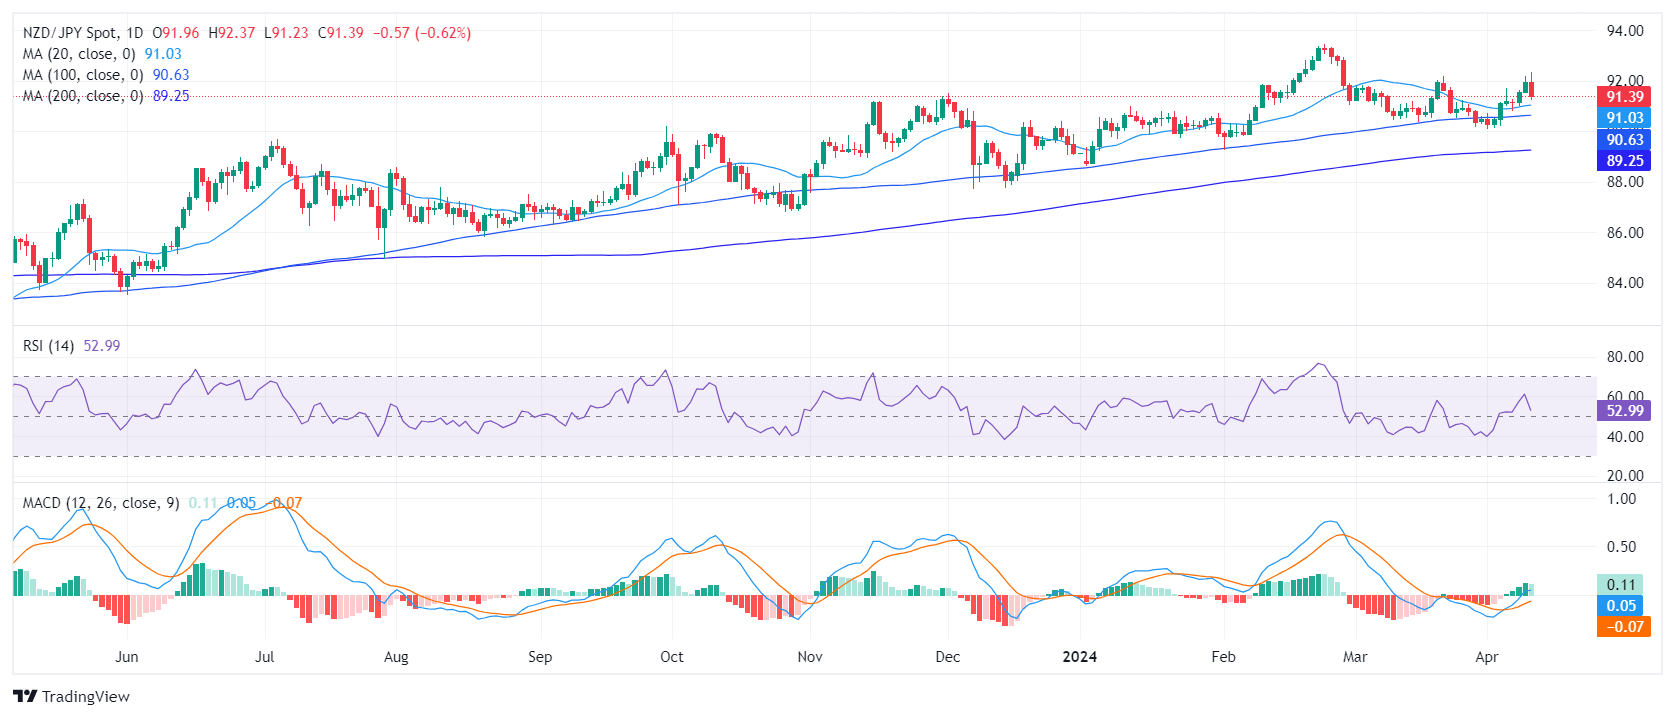
On the daily chart, the Relative Strength Index (RSI) is in positive territory, indicating a mild bullish momentum. Despite a recent decrease, the prevailing trend remains largely positive. The Moving Average Convergence Divergence (MACD) reveals decreasing green bars, also suggesting a slight loss in positive momentum. However, the persisting positive RSI readings indicate that the majority of traders favor the buy side.
NZD/JPY daily chart
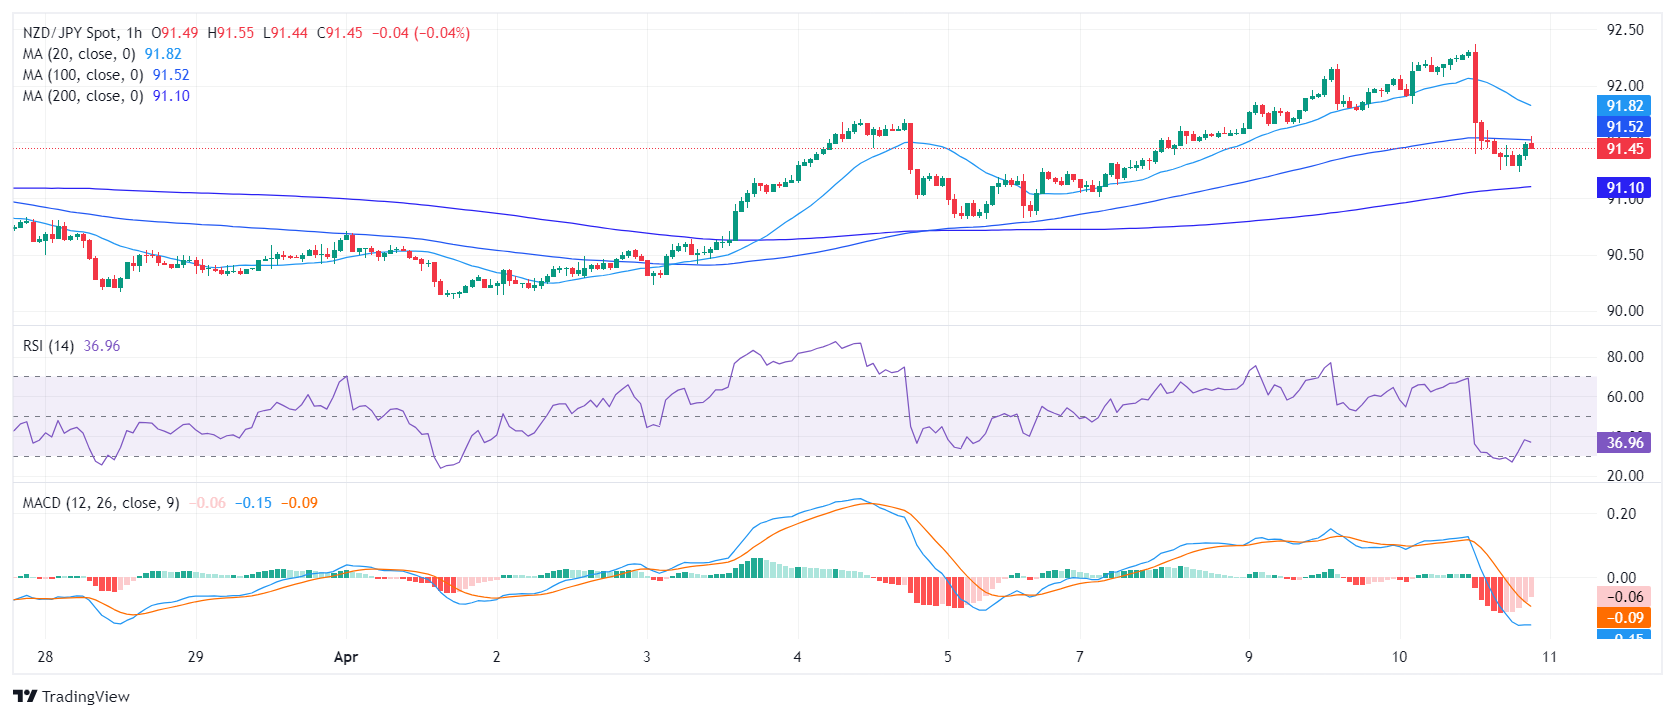
In the hourly analysis, the RSI hovers in the oversold territory, indicating strong selling pressure but as the downward movements are overextended an upward corrective move may be possible ahead of the Asian session. In addition, the MACD histogram prints red bars, adding arguments for the negative momentum.
NZD/JPY hourly chart
Inspecting the broader perspective, the NZD/JPY demonstrates a bullish trend with its current standing above the 20,100, and 200-day Simple Moving Averages (SMAs). However, the bears seem to be eyeing the 20-day SMA level of 91.00, which poses a significant turning point. A successful breach below this level could reinforce the arguments for the bears and the pair could see additional downside in the next sessions.


© 2000-2026. All rights reserved.
This site is managed by Teletrade D.J. LLC 2351 LLC 2022 (Euro House, Richmond Hill Road, Kingstown, VC0100, St. Vincent and the Grenadines).
The information on this website is for informational purposes only and does not constitute any investment advice.
The company does not serve or provide services to customers who are residents of the US, Canada, Iran, The Democratic People's Republic of Korea, Yemen and FATF blacklisted countries.
Making transactions on financial markets with marginal financial instruments opens up wide possibilities and allows investors who are willing to take risks to earn high profits, carrying a potentially high risk of losses at the same time. Therefore you should responsibly approach the issue of choosing the appropriate investment strategy, taking the available resources into account, before starting trading.
Use of the information: full or partial use of materials from this website must always be referenced to TeleTrade as the source of information. Use of the materials on the Internet must be accompanied by a hyperlink to teletrade.org. Automatic import of materials and information from this website is prohibited.
Please contact our PR department if you have any questions or need assistance at pr@teletrade.global.
transfers