- Analytics
- News and Tools
- Market News
- NZD/JPY Price Analysis: Bulls retain control and present battle around the 20-day SMA
NZD/JPY Price Analysis: Bulls retain control and present battle around the 20-day SMA
- The daily chart reveals a positive momentum, with the RSI and MACD demonstrating the upper hand of buyers.
- The hourly RSI is exchanging hands around the 50 level.
- The pair is building strong support around the 20-day SMA.
The NZD/JPY currency pair is trading near the 91.541 level, experiencing what appears to be a robust uptrend. Indicators on the daily chart remain strong while hourly indicators stand somewhat mixed. On the negative side, for bears to start talking, they must breach the 20-day Simple Moving Average (SMA) at 91.00 which is acting as a strong support in favor of the bulls.
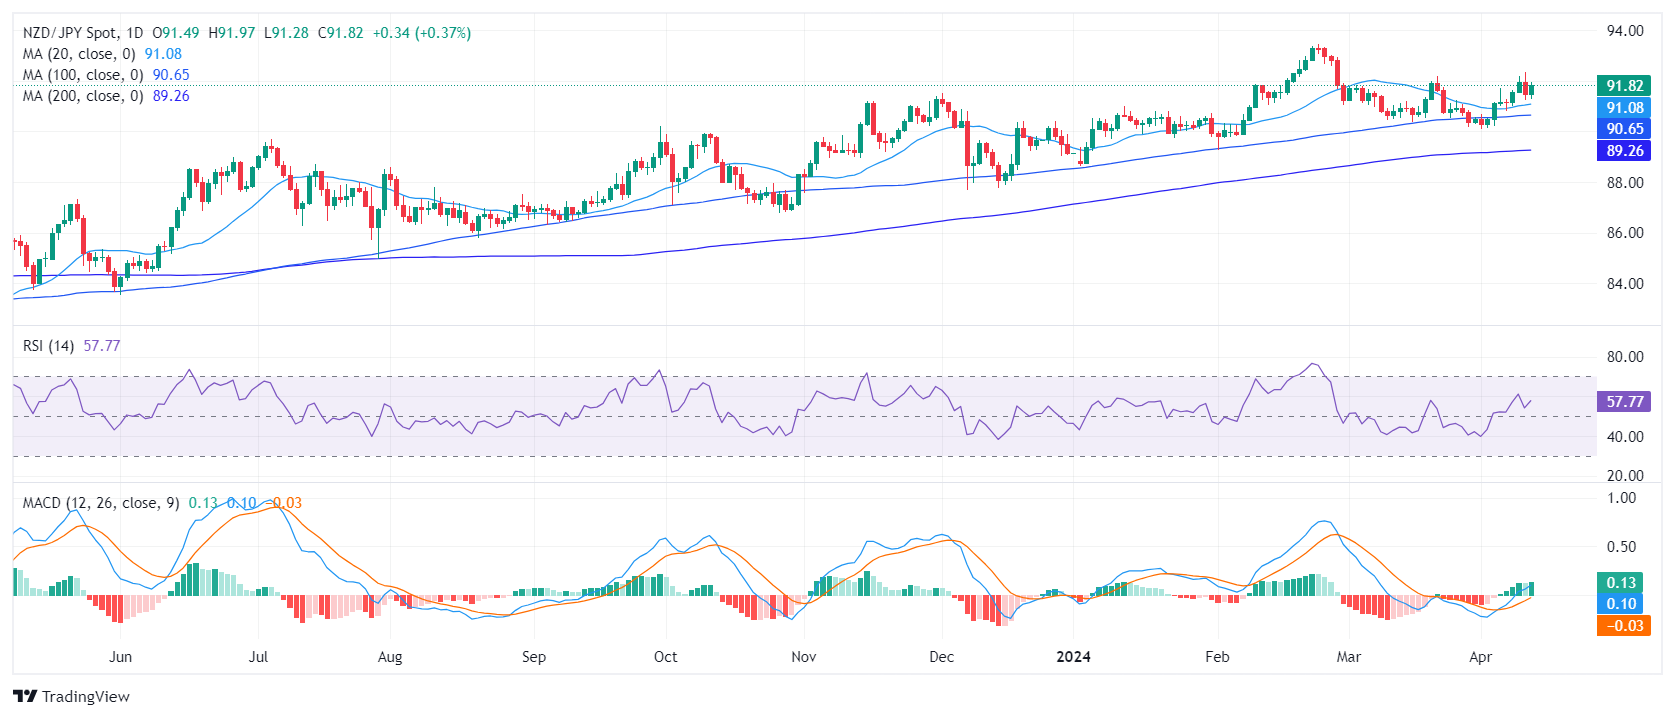
On the daily chart, the Relative Strength Index (RSI) shows positive momentum for the NZD/JPY pair, settling at about 56. The recent history of the RSI in positive territory highlights the dominance of buyers, occasionally counterbalanced with dips flirting with the negative domain. Concurrently, the MACD histogram displays green bars, further indicating positive momentum in the market.
NZD/JPY daily chart
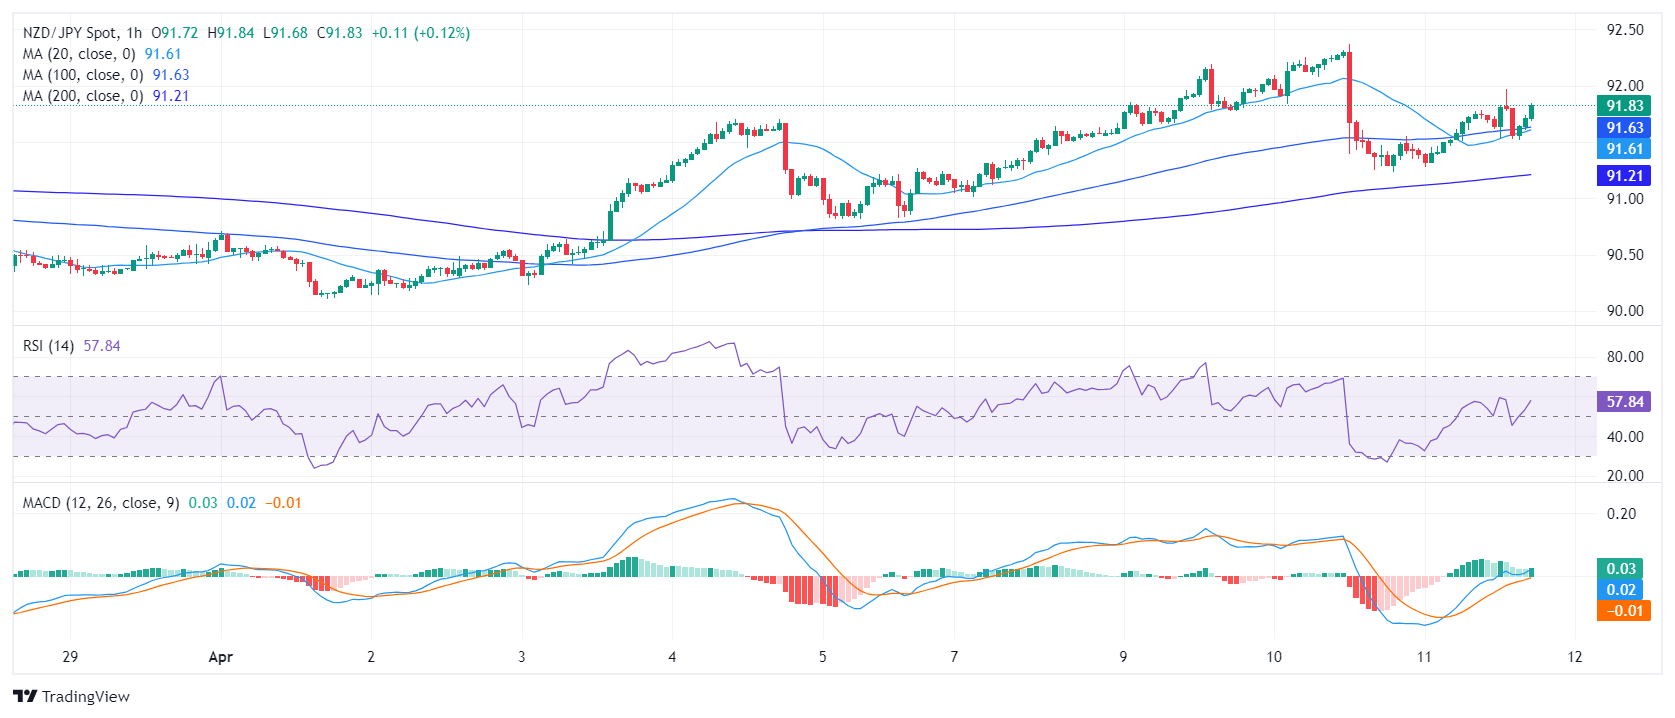
Moving to the hourly chart, the RSI fluctuates around the neutral mark of 50, with the latest reading jumping back to 57 after a slight decline earlier in the session. The MACD histogram continues to print flat green bars, indicating a flattening buying momentum.
NZD/JPY hourly chart
Taking into account this technical landscape, the NZD/JPY shows a bullish inclination in a broader outlook. It stands notably above the 20, 100, and 200-day Simple Moving Averages (SMAs), indicating a consistent uptrend. As long as the pair holds above the key 20-day average, the bullish trend will remain intact. However, the mixed outlook on the hourly chart advises that the buyers may give up ahead of the Asian session which could pave the way for a retest of the mentioned average.


© 2000-2026. All rights reserved.
This site is managed by Teletrade D.J. LLC 2351 LLC 2022 (Euro House, Richmond Hill Road, Kingstown, VC0100, St. Vincent and the Grenadines).
The information on this website is for informational purposes only and does not constitute any investment advice.
The company does not serve or provide services to customers who are residents of the US, Canada, Iran, The Democratic People's Republic of Korea, Yemen and FATF blacklisted countries.
Making transactions on financial markets with marginal financial instruments opens up wide possibilities and allows investors who are willing to take risks to earn high profits, carrying a potentially high risk of losses at the same time. Therefore you should responsibly approach the issue of choosing the appropriate investment strategy, taking the available resources into account, before starting trading.
Use of the information: full or partial use of materials from this website must always be referenced to TeleTrade as the source of information. Use of the materials on the Internet must be accompanied by a hyperlink to teletrade.org. Automatic import of materials and information from this website is prohibited.
Please contact our PR department if you have any questions or need assistance at pr@teletrade.global.
transfers