- Analytics
- News and Tools
- Market News
- NZD/JPY Price Analysis: Negative momentum gains traction, broader outlook still positive
NZD/JPY Price Analysis: Negative momentum gains traction, broader outlook still positive
- The daily chart RSI signals NZD/JPY's shift towards negative momentum.
- Hourly RSI reveals an oscillating pattern in oversold territory, indicating increasing bearish pressure.
The NZD/JPY declined to 90.95 on Friday, marking a decrease of 1%. Sellers have gained significant ground and hourly indicators indicate oversold conditions which suggests that the pair might sideways trade in the next sessions. As for now, the short term has turned somewhat bearish for the cross as it lost the 20-day Simple Moving Average (SMA).
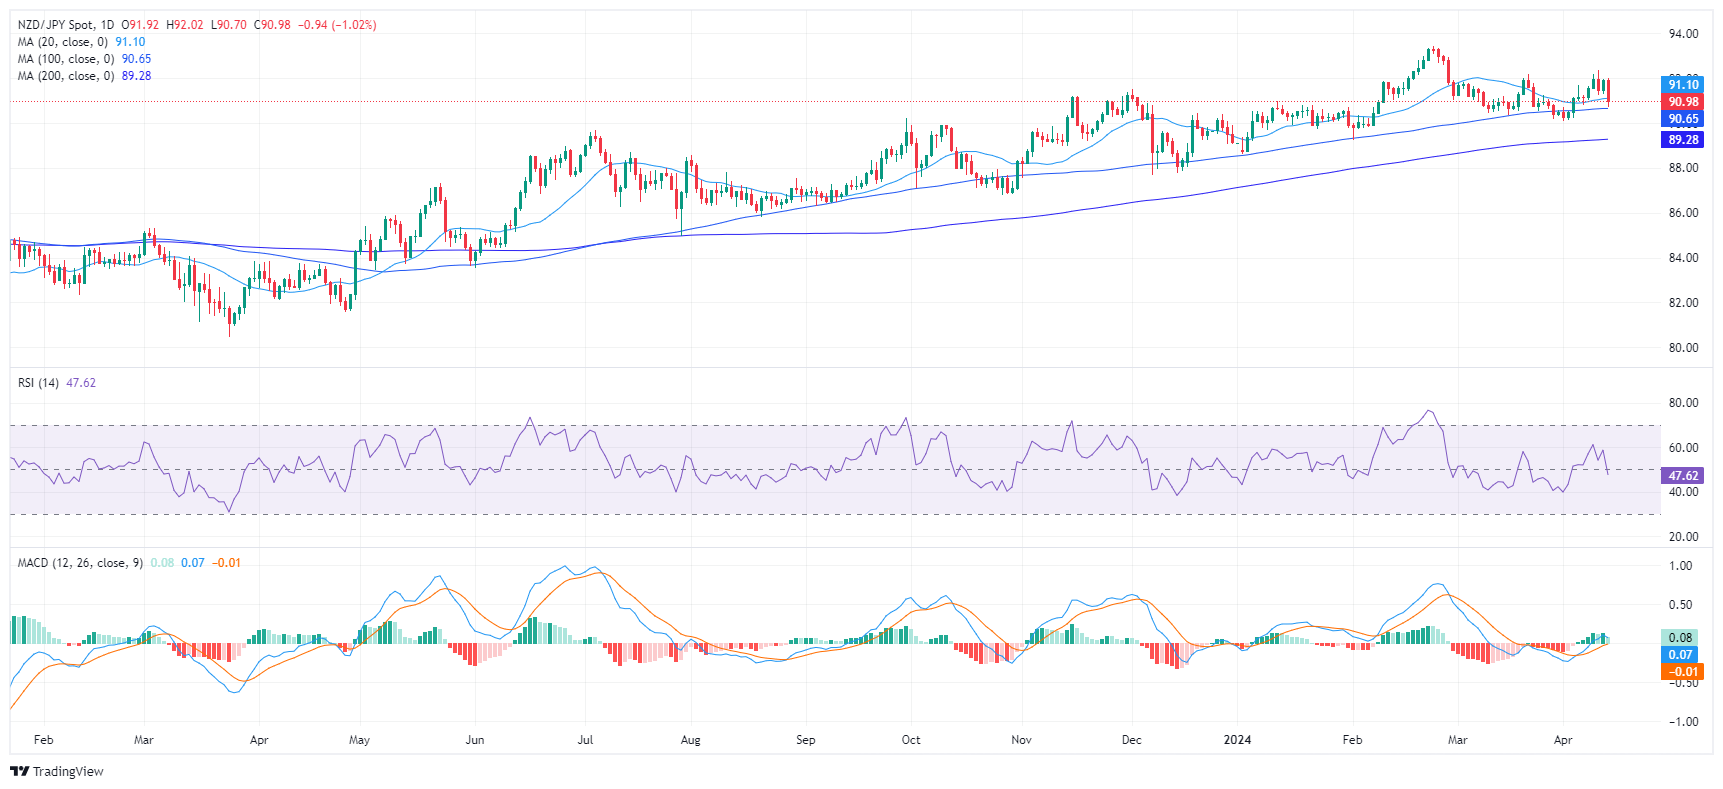
Based on the indicators of the daily chart, the NZD/JPY has pivoted towards a negative momentum. Its Relative Strength Index (RSI) is settling into negative territory, with a last reading of 47. This change indicates that sellers are taking control after a period of positive strength that had the RSI peaking at 63 this week.
NZD/JPY daily chart
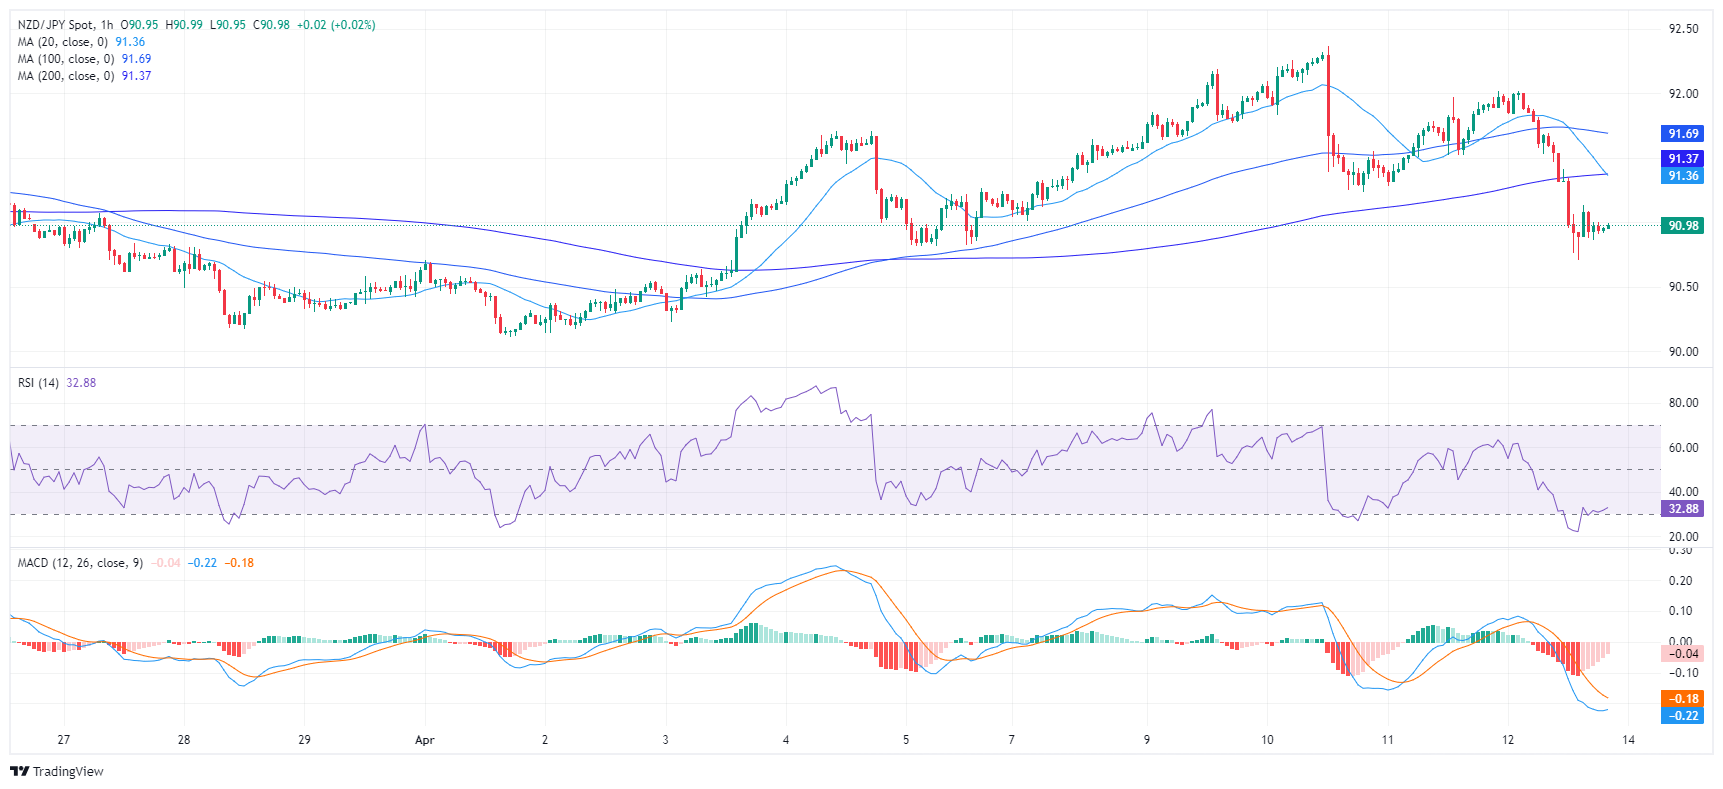
From the hourly chart, the RSI values reveal oversold conditions, with the most recent reading dipping to 30. The Moving Average Convergence Divergence (MACD) histogram generates flat red bars, signaling sustained negative momentum. This coincides with a drop in buyer demand over the past hours, and it could set the tone for the upcoming trading sessions. However, a consolidation shouldn't be ruled out as bears might take a breather.
NZD/JPY hourly chart
In the broader outlook, the NZD/JPY, based on its Simple Moving Average (SMA) still holds a positive outlook as it holds above the 100 and 200-day SMAs. However, the cross, having fallen today below the 20-day SMA, presents a bearish signal for the short term which aligns with the indicators on the daily and hourly chart.


© 2000-2026. All rights reserved.
This site is managed by Teletrade D.J. LLC 2351 LLC 2022 (Euro House, Richmond Hill Road, Kingstown, VC0100, St. Vincent and the Grenadines).
The information on this website is for informational purposes only and does not constitute any investment advice.
The company does not serve or provide services to customers who are residents of the US, Canada, Iran, The Democratic People's Republic of Korea, Yemen and FATF blacklisted countries.
Making transactions on financial markets with marginal financial instruments opens up wide possibilities and allows investors who are willing to take risks to earn high profits, carrying a potentially high risk of losses at the same time. Therefore you should responsibly approach the issue of choosing the appropriate investment strategy, taking the available resources into account, before starting trading.
Use of the information: full or partial use of materials from this website must always be referenced to TeleTrade as the source of information. Use of the materials on the Internet must be accompanied by a hyperlink to teletrade.org. Automatic import of materials and information from this website is prohibited.
Please contact our PR department if you have any questions or need assistance at pr@teletrade.global.
transfers