- Analytics
- News and Tools
- Market News
- NZD/USD Price Analysis: Bearish dominance persists, signs of short-term bullish recovery detected
NZD/USD Price Analysis: Bearish dominance persists, signs of short-term bullish recovery detected
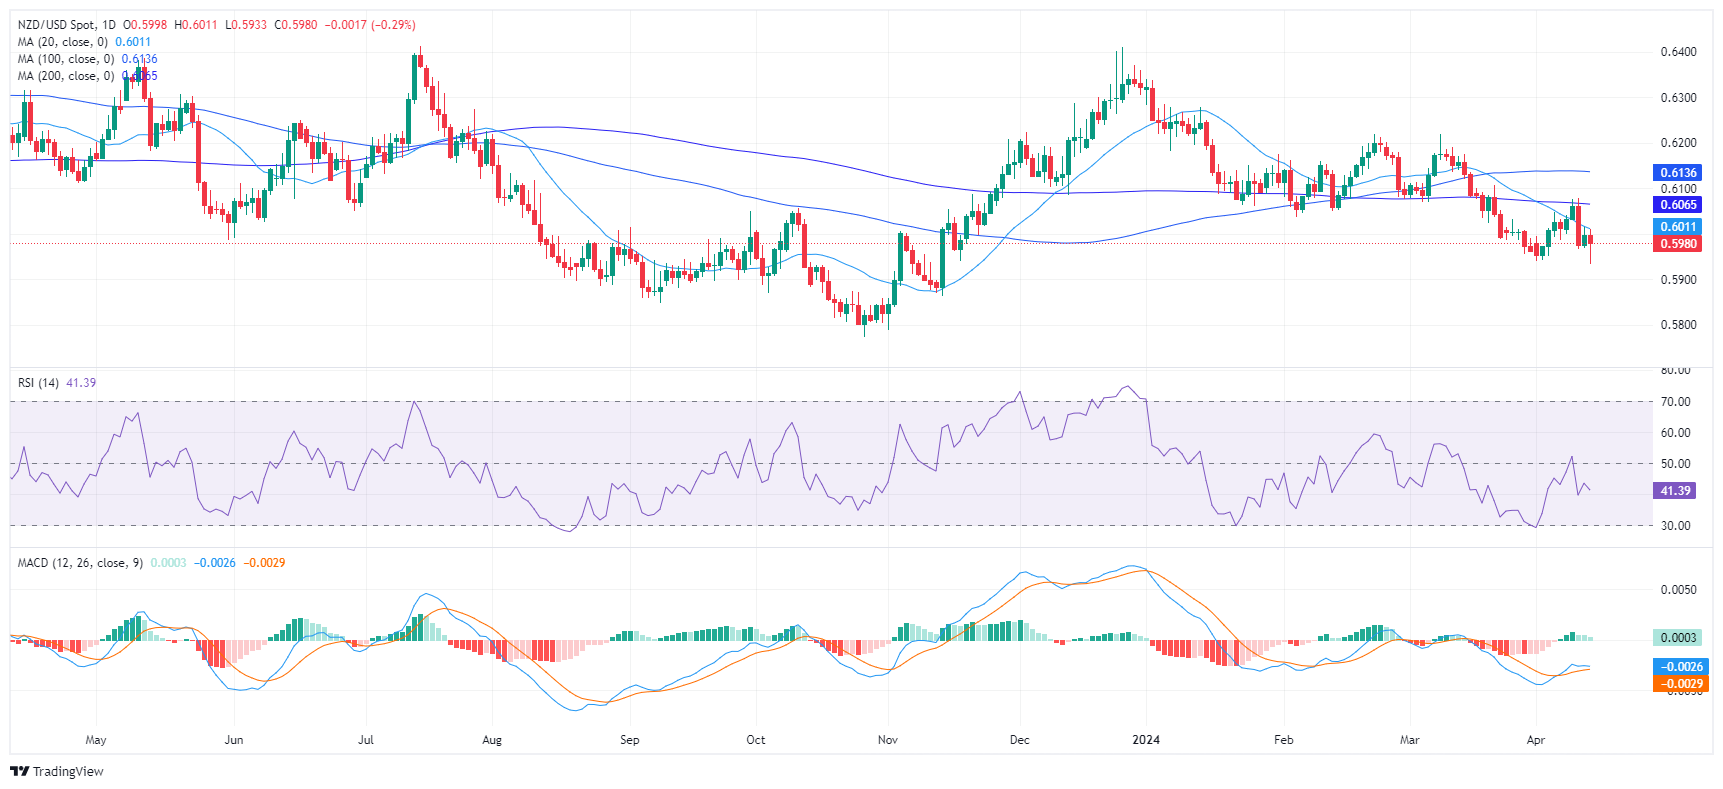
- The daily RSI of the NZD/USD reveals that sellers remain in command with values below 50.
- The daily MACD shows a slowdown in selling pressure as flat green bars begin to form.
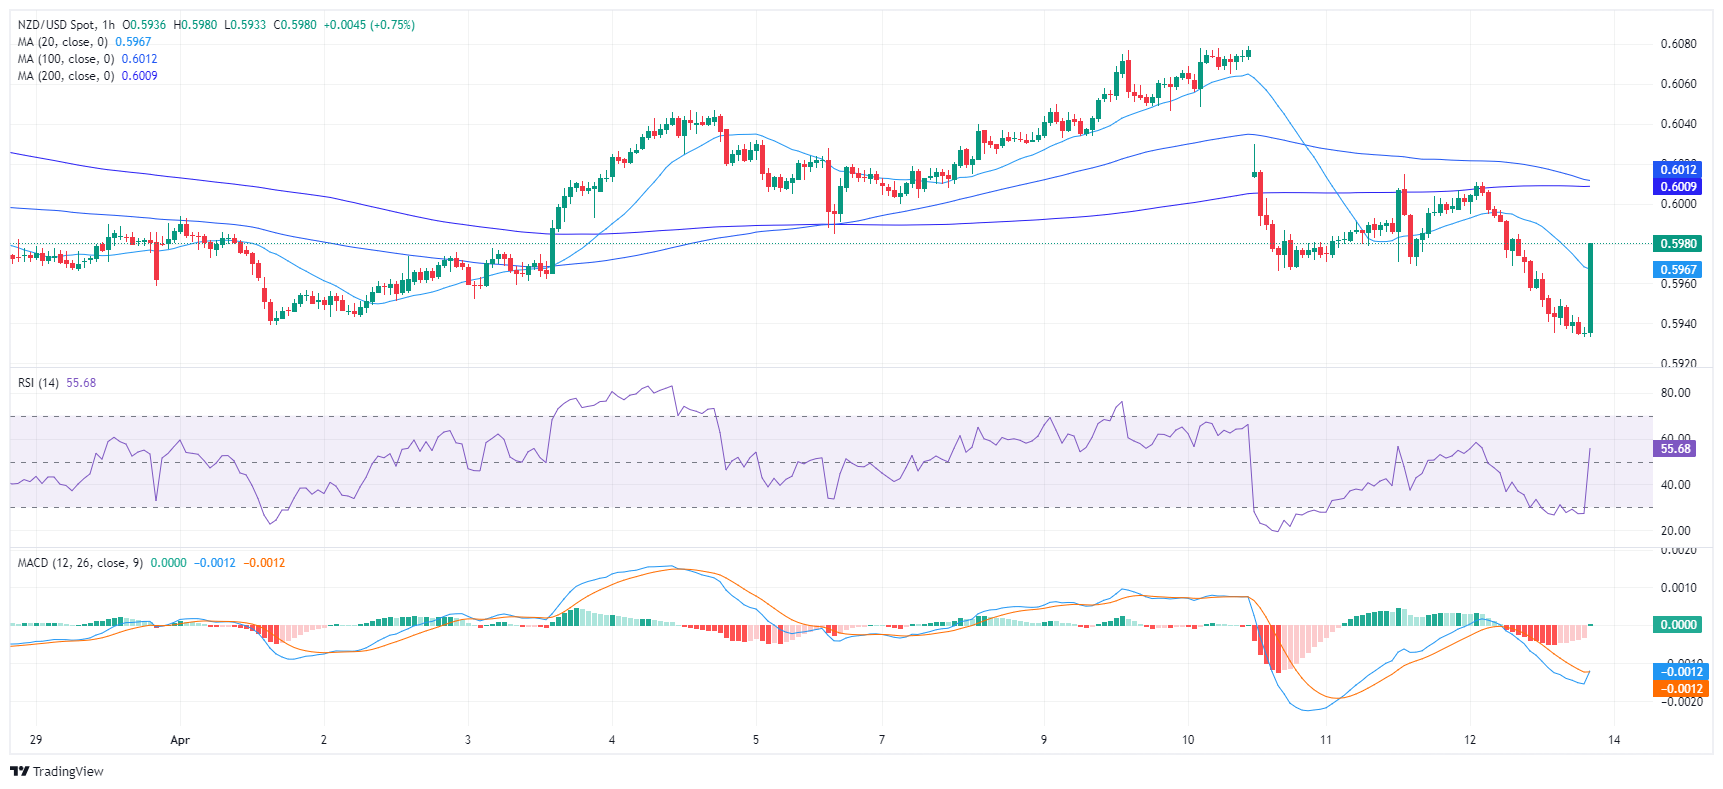
- Buyers hint at gaining minor traction in the short term, with hourly indicators recovering.
The NZD/USD pair reflects the ongoing dominance of sellers, declining towards the 0.5935 mark. While signs of bearish control are evident, there is a clue of bullish resilience, hinting at a neutral to bearish outlook in the short term.
The daily Relative Strength Index (RSI) maintains a consistent presence in the negative territory below 50, with the latest value at 38 which indicates that sellers are in command. That being said, green bars take shape on the Moving Average Convergence Divergence (MACD) histogram, indicating a slowing of the bearish momentum.
NZD/USD daily chart
In contrast, the hourly chart indicates a gradually increasing RSI with the latest reading at 47. This suggests a mild recovery of buying interest after dropping into oversold conditions earlier in the session. Moreover, the MACD histogram shows a fresh green bar, implying a positive change in the short term momentum.
NZD/USD hourly chart
With respect to the broader trend, the outlook is bearish with the pair below the 20,100 and 200-day Simple Moving Averages (SMAs). However, the pair is close to its 20-day average and if buyers regain additional ground and recapture it, the outlook may start to shift in favor of the bulls.


© 2000-2026. All rights reserved.
This site is managed by Teletrade D.J. LLC 2351 LLC 2022 (Euro House, Richmond Hill Road, Kingstown, VC0100, St. Vincent and the Grenadines).
The information on this website is for informational purposes only and does not constitute any investment advice.
The company does not serve or provide services to customers who are residents of the US, Canada, Iran, The Democratic People's Republic of Korea, Yemen and FATF blacklisted countries.
Making transactions on financial markets with marginal financial instruments opens up wide possibilities and allows investors who are willing to take risks to earn high profits, carrying a potentially high risk of losses at the same time. Therefore you should responsibly approach the issue of choosing the appropriate investment strategy, taking the available resources into account, before starting trading.
Use of the information: full or partial use of materials from this website must always be referenced to TeleTrade as the source of information. Use of the materials on the Internet must be accompanied by a hyperlink to teletrade.org. Automatic import of materials and information from this website is prohibited.
Please contact our PR department if you have any questions or need assistance at pr@teletrade.global.
transfers