- Analytics
- News and Tools
- Market News
- NZD/USD Price Analysis: Tests the key barrier of 0.5950; next resistance at 14-day EMA
NZD/USD Price Analysis: Tests the key barrier of 0.5950; next resistance at 14-day EMA
- NZD/USD consolidates amid heightened geopolitical tensions after Iranian attack on Israel.
- Technical analysis suggests a confirmation of a tepid momentum for the pair.
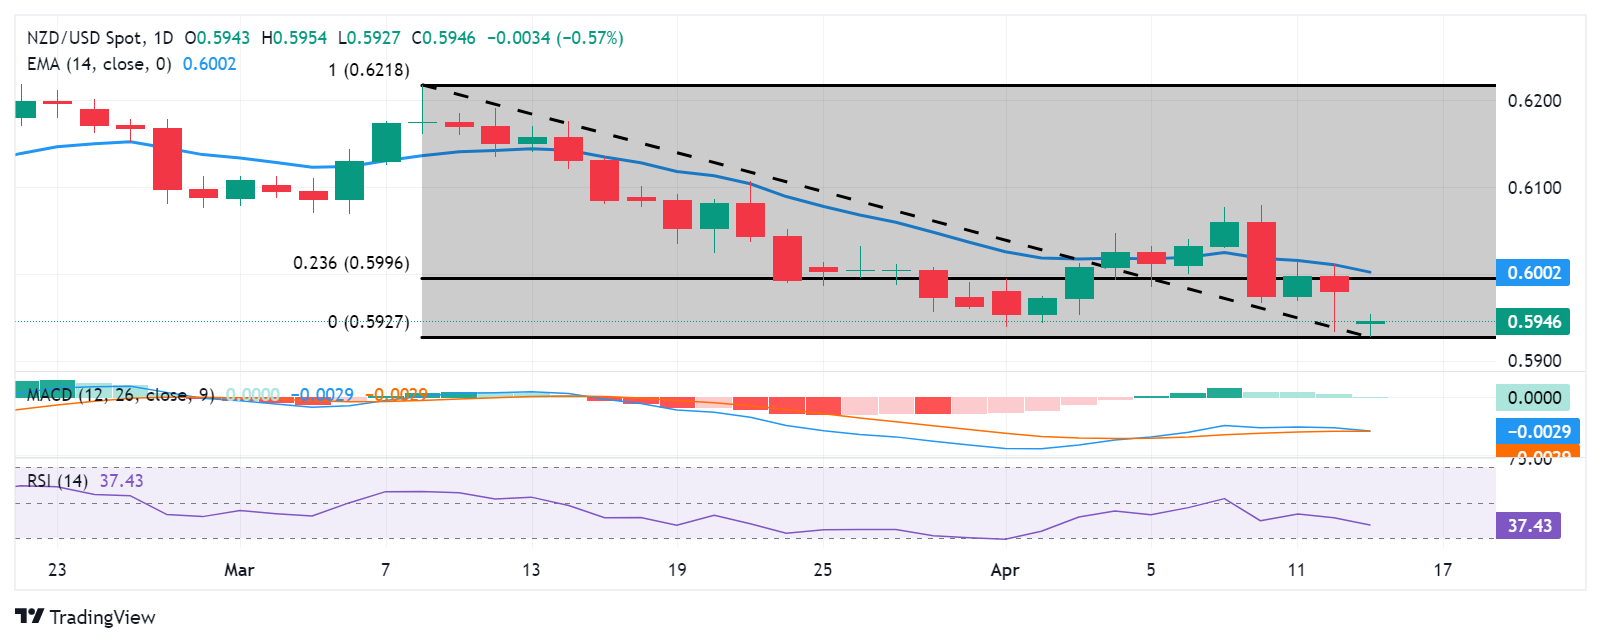
- The level of 0.5950 appears as the immediate barrier followed by the 23.6% Fibo level of 0.5996 and the psychological level of 0.6000.
NZD/USD moves back and forth amid heightened geopolitical tensions in the Middle East after Iran attacked potential Israel military on Saturday by launching explosive drones and missiles targeting military installations in Israel. However, Israel successfully intercepted most of the incoming projectiles, according to Reuters. The NZD/USD pair consolidates around 0.5940 during the European session on Monday.
According to the Moving Average Convergence Divergence (MACD) analysis, a prevailing downward sentiment is indicated for the NZD/USD pair. This is evidenced by the MACD line positioned below the centerline and the signal line, signaling a bearish trend.
Furthermore, the 14-day Relative Strength Index (RSI) is below the 50 level, providing additional confirmation of the bearish sentiment, which could prompt traders of the NZD/USD pair to navigate the region around the psychological level of 0.5900. A break below the latter could influence the NZD/USD pair to approach further support at the major level of 0.5850.
On the upside, the NZD/USD pair could find immediate resistance at the major level of 0.5950. A breakthrough above this level could lead the pair to test a strong resistance area around the 23.6% Fibonacci retracement level of 0.5996, aligned with the psychological level of 0.6000 and 14-day Exponential Moving Average (EMA) of 0.6001.
NZD/USD: Daily Chart


© 2000-2026. All rights reserved.
This site is managed by Teletrade D.J. LLC 2351 LLC 2022 (Euro House, Richmond Hill Road, Kingstown, VC0100, St. Vincent and the Grenadines).
The information on this website is for informational purposes only and does not constitute any investment advice.
The company does not serve or provide services to customers who are residents of the US, Canada, Iran, The Democratic People's Republic of Korea, Yemen and FATF blacklisted countries.
Making transactions on financial markets with marginal financial instruments opens up wide possibilities and allows investors who are willing to take risks to earn high profits, carrying a potentially high risk of losses at the same time. Therefore you should responsibly approach the issue of choosing the appropriate investment strategy, taking the available resources into account, before starting trading.
Use of the information: full or partial use of materials from this website must always be referenced to TeleTrade as the source of information. Use of the materials on the Internet must be accompanied by a hyperlink to teletrade.org. Automatic import of materials and information from this website is prohibited.
Please contact our PR department if you have any questions or need assistance at pr@teletrade.global.
transfers