- Analytics
- News and Tools
- Market News
- NZD/JPY Price Analysis: Bearish momentum overpowers, buyers struggle to retake the 20-day SMA
NZD/JPY Price Analysis: Bearish momentum overpowers, buyers struggle to retake the 20-day SMA
- The daily RSI and MACD reveal a weaker NZD/JPY, pointing towards bearish momentum.
- The negative trend is stronger on the hourly chart.
- Despite short-term bearish inclination, the cross position above main SMAs signifies a bullish sentiment in the longer term.
The NZD/JPY is trading at the 91.14 level, securing some daily gains after peaking at a daily high of 91.60. Despite a bearish short-term trend, the pair maintains a bullish position over the longer term, being positioned above key Simple Moving Averages (SMAs). For the short term, bears seem to be gearing up and bulls starting to weaken.
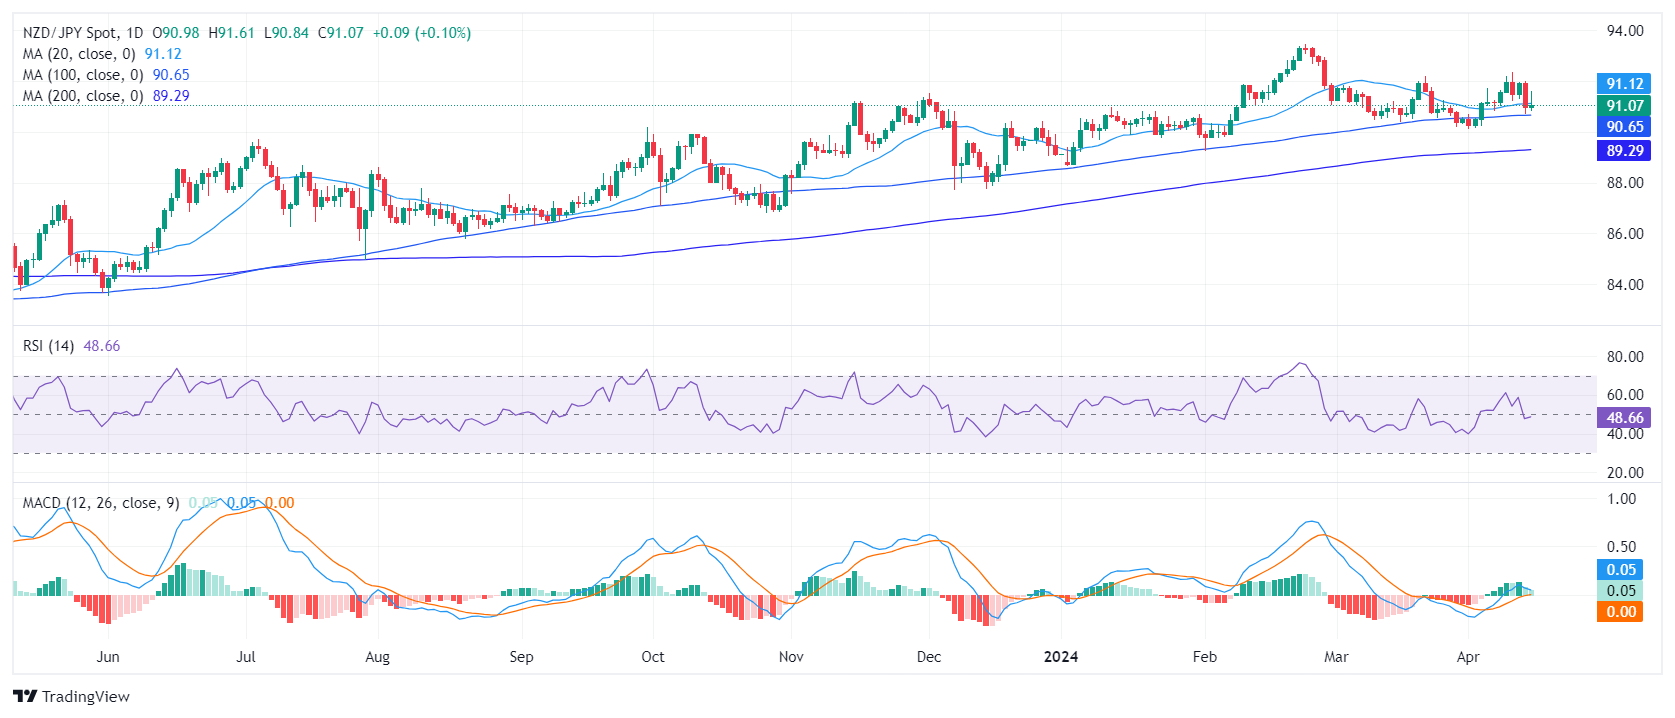
On the daily chart, the Relative Strength Index (RSI) is currently trending in negative territory, with the latest reading of 49. This, coupled with decreasing green bars on the Moving Average Convergence Divergence (MACD) histogram, indicates a slowdown in positive momentum, suggesting that sellers are currently dominating the market.
NZD/JPY daily chart
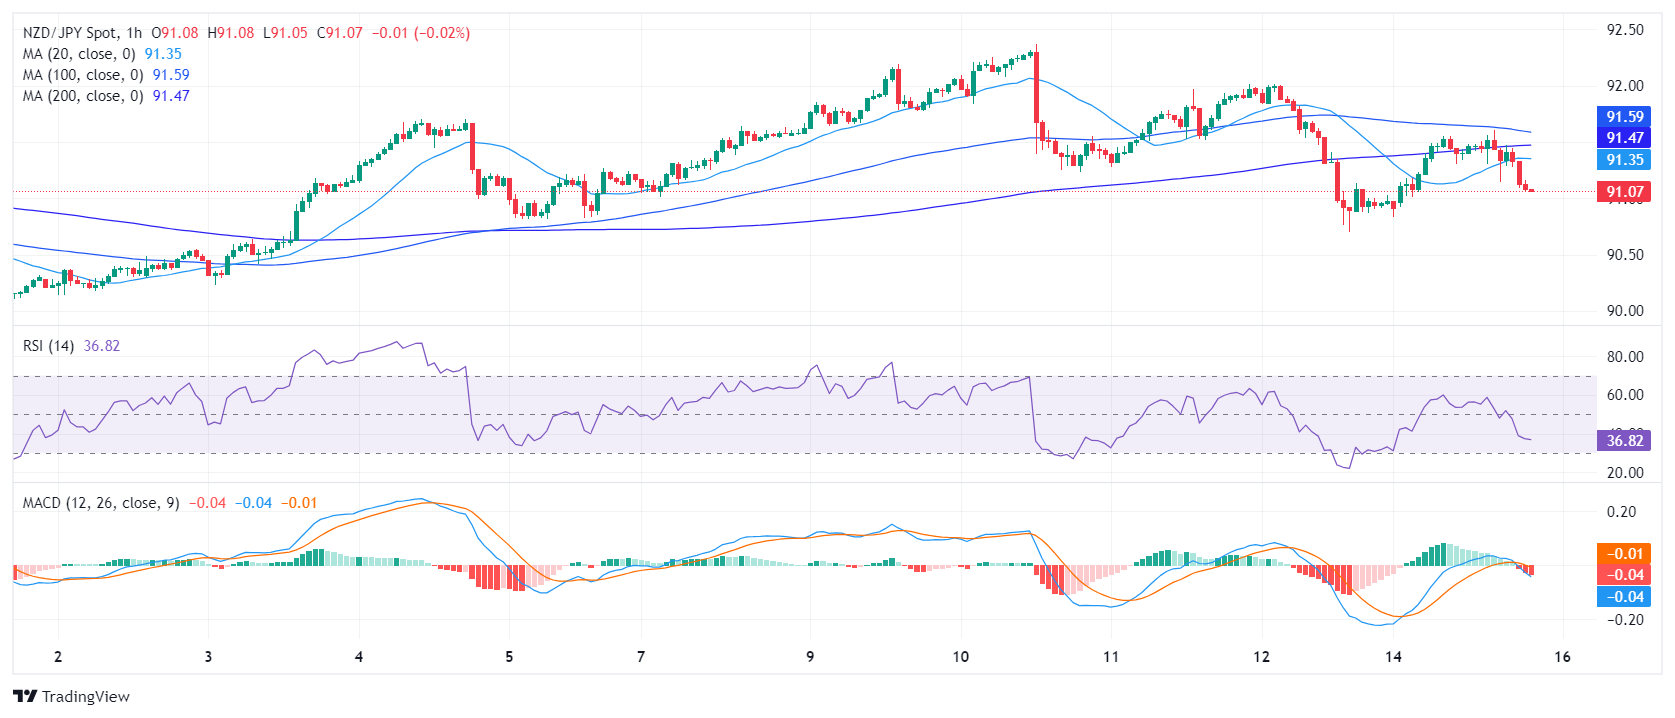
Switching to the hourly chart, the RSI similarly shows lower readings, with the latest value at 43, signaling a stronger negative trend in this time frame. Additionally, the MACD histogram shows an increase in red bars, reinforcing the negative momentum. This shift could indicate an increase in selling pressure during recent trading sessions and that the cross may see further downside ahead of the Asian session.
NZD/JPY hourly chart
The broader inspection of NZD/JPY illustrates a mixed technical scenario according to its position relative to its Simple Moving Averages (SMAs). In the short term, bearish tendencies are apparent as the NZD/JPY fell below the 20-day SMA last week and failed to re-conquer it. This move might trigger selling pressure from a short-term perspective. However, the position of NZD/JPY above the 100-day and 200-day SMAs shows a more bullish underlying structure in longer-term horizons.
In case the bulls fail to regain the 20-day SMA, the cross might be exposed to further downside in the coming sessions.


© 2000-2026. All rights reserved.
This site is managed by Teletrade D.J. LLC 2351 LLC 2022 (Euro House, Richmond Hill Road, Kingstown, VC0100, St. Vincent and the Grenadines).
The information on this website is for informational purposes only and does not constitute any investment advice.
The company does not serve or provide services to customers who are residents of the US, Canada, Iran, The Democratic People's Republic of Korea, Yemen and FATF blacklisted countries.
Making transactions on financial markets with marginal financial instruments opens up wide possibilities and allows investors who are willing to take risks to earn high profits, carrying a potentially high risk of losses at the same time. Therefore you should responsibly approach the issue of choosing the appropriate investment strategy, taking the available resources into account, before starting trading.
Use of the information: full or partial use of materials from this website must always be referenced to TeleTrade as the source of information. Use of the materials on the Internet must be accompanied by a hyperlink to teletrade.org. Automatic import of materials and information from this website is prohibited.
Please contact our PR department if you have any questions or need assistance at pr@teletrade.global.
transfers