- Analytics
- News and Tools
- Market News
- Silver Price Analysis: XAG/USD pulls back as dark cloud cover loom
Silver Price Analysis: XAG/USD pulls back as dark cloud cover loom
- Silver retreats to $28.09, unable to hold above the crucial $29 mark, indicating potential further declines.
- The 'dark cloud cover' technical pattern suggests vulnerability and possible downward movement.
- Focus remains on silver's ability to sustain above the $28.00 threshold, with key support and resistance levels closely watched.
Silver prices retreat from daily highs reached $29.01, dropping 2.63%, affected by high US Treasury yields, and stirring resistance around the $29.00 threshold. The XAG/USD trades at $28.09, breaking key support levels on its way toward current spot prices.
XAG/USD Price Analysis: Technical outlook
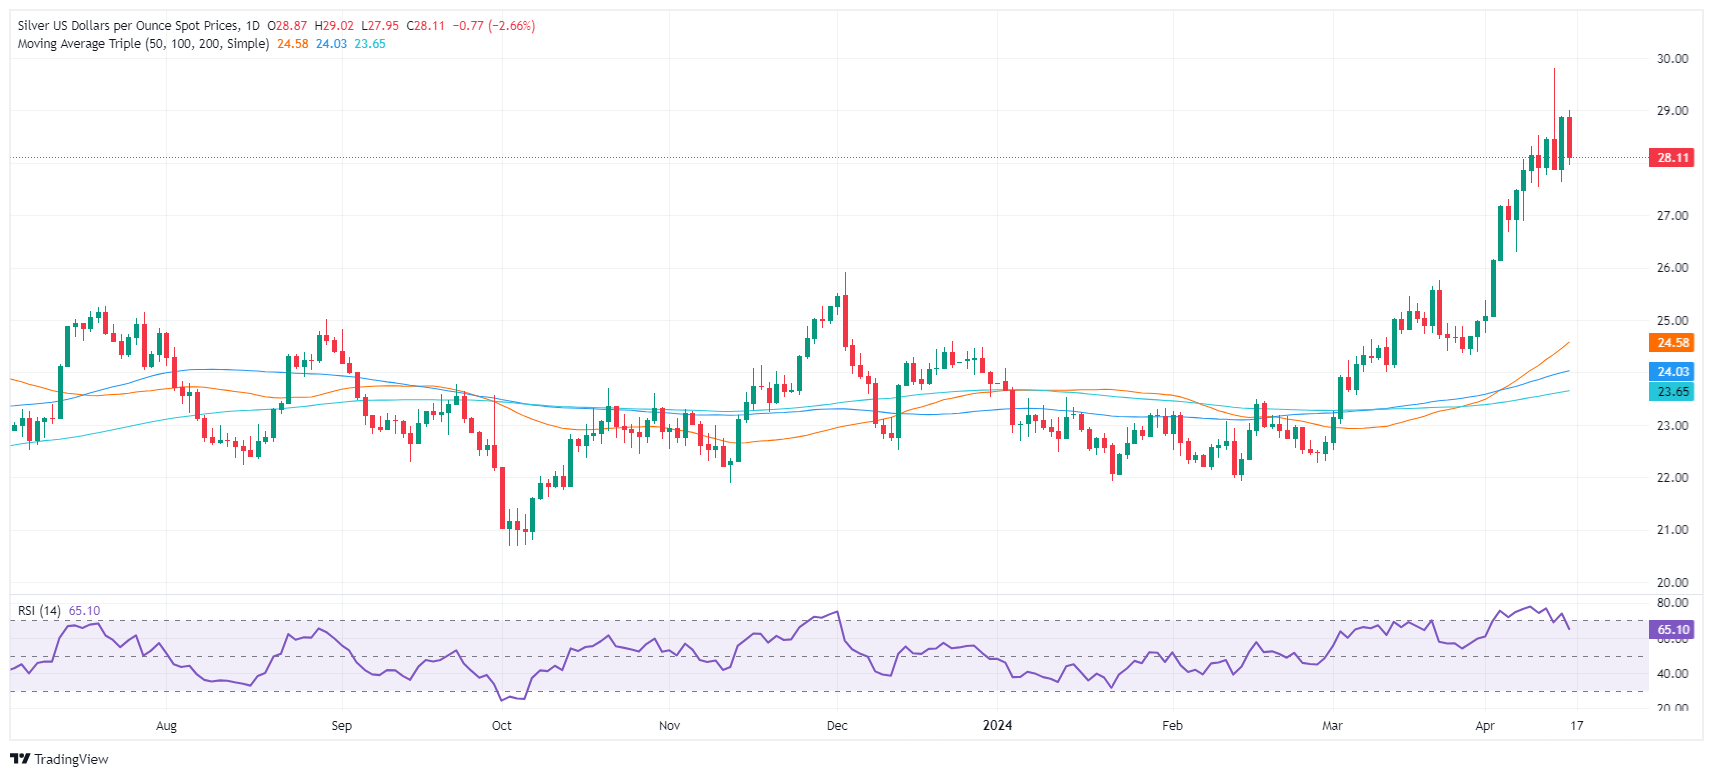
From a technical standpoint, XAG/USD buyers failed to hold Siver’s quote above the psychological $29.00 level after reaching a year-to-date (YTD) high of $29.79. That exacerbated the grey’s metal drop toward the $28.00 mark, opening the door for further downside. During the last couple of days, price action formed a ‘dark cloud cover’ that needs confirmation below the April 15 low of $27.59.
Momentum was extremely bullish, though the Relative Strength Index (RSI) exited from overbought conditions during the day, sponsoring a leg-down on Silver. That said, XAG/USD could witness a pullback before buyers attempt to challenge the $29.00 mark.
Given the backdrop, Siver’s first support would be $27.59, followed by the $27.00 mark. Further losses are seen at $26.29, the April 5 low. On the flip side, if buyers keep the XAG/USD spot price above $28.00, the next resistance levels are seen at the June 10, 2021, high at $28.28, followed by the May 18, 2021 high at $28.74.
XAG/USD Price Action – Daily Chart


© 2000-2026. All rights reserved.
This site is managed by Teletrade D.J. LLC 2351 LLC 2022 (Euro House, Richmond Hill Road, Kingstown, VC0100, St. Vincent and the Grenadines).
The information on this website is for informational purposes only and does not constitute any investment advice.
The company does not serve or provide services to customers who are residents of the US, Canada, Iran, The Democratic People's Republic of Korea, Yemen and FATF blacklisted countries.
Making transactions on financial markets with marginal financial instruments opens up wide possibilities and allows investors who are willing to take risks to earn high profits, carrying a potentially high risk of losses at the same time. Therefore you should responsibly approach the issue of choosing the appropriate investment strategy, taking the available resources into account, before starting trading.
Use of the information: full or partial use of materials from this website must always be referenced to TeleTrade as the source of information. Use of the materials on the Internet must be accompanied by a hyperlink to teletrade.org. Automatic import of materials and information from this website is prohibited.
Please contact our PR department if you have any questions or need assistance at pr@teletrade.global.
transfers