- Analytics
- News and Tools
- Market News
- AUD/JPY Price Analysis: Bulls must regain the 20-day SMA to avoid further losses
AUD/JPY Price Analysis: Bulls must regain the 20-day SMA to avoid further losses
- The daily RSI for the AUD/JPY demonstrates a modest uptrend, maintaining above the middle ground.
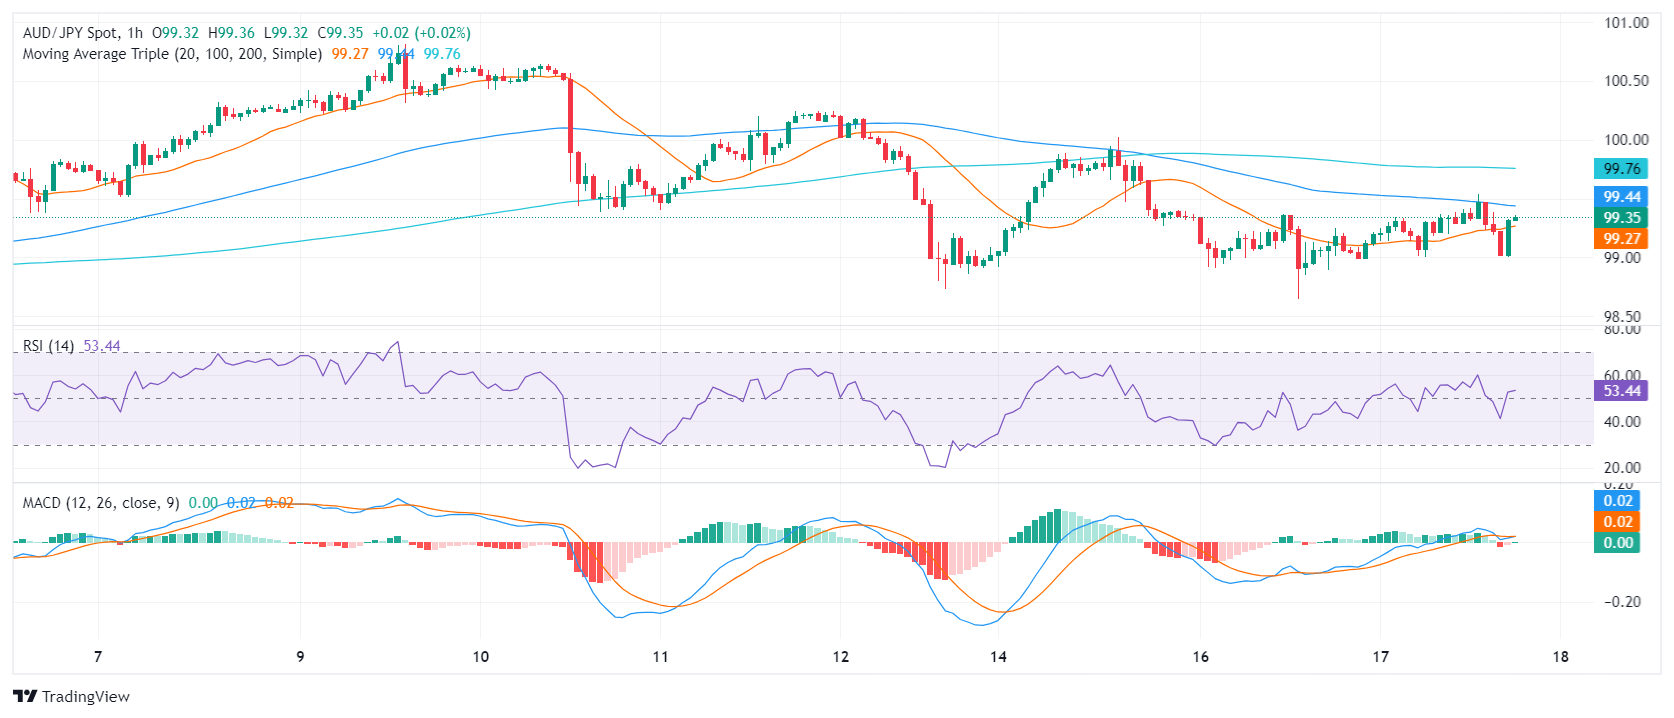
- The Hourly chart reveals mixed sentiment, with frequent RSI changes and negative momentum portrayed by the MACD bars.
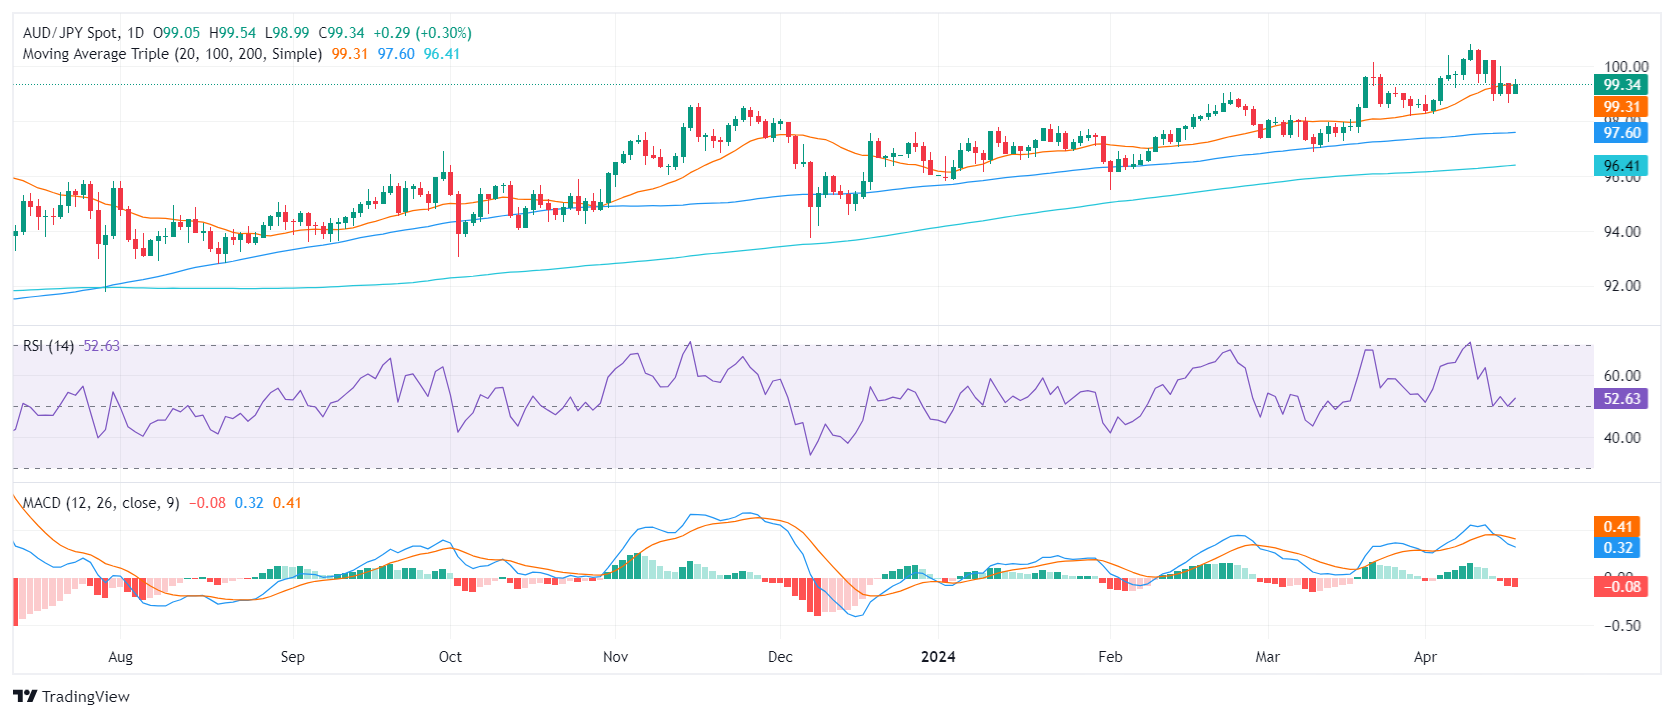
- The 20-day SMA at 99.30 is the main target for the bulls.
The AUD/JPY showed a stronger stance by posting a gain of 0.27% and settling at 99.24 in Wednesday’s session. Despite the recent downside, the pair indicates a dominant bullish outlook, firmly standing above the key Simple Moving Averages (SMAs). However, the recent dip below the 20-day SMA brightened the outlook for the bears for the short term.
On the daily chart, the Relative Strength Index (RSI) pair indicates a slight positive trend. Despite dipping close to the 50 level, it recovered and retained its position in positive territory, hovering around 52. Meanwhile, the Moving Average Convergence Divergence (MACD) shows rising red bars, signaling a potential shift in momentum.
AUD/JPY daily chart
The hourly RSI reveals a mixed trend. The latest reading was 53, indicating a positive trend, while previous readings varied between positive and negative territories, revealing fluctuating market momentum. The hourly MACD shows flat red bars, signifying a steady negative momentum.
AUD/JPY hourly chart
Observing the broader prospect, the AUD/JPY's position above the 100-day and 200-day SMA reveals a robust long-term bullish trend. Any significant movements today that keep the cross above these levels won’t threaten the positive outlook, but as the bears gather momentum, some downside in the short term should be expected.


© 2000-2026. All rights reserved.
This site is managed by Teletrade D.J. LLC 2351 LLC 2022 (Euro House, Richmond Hill Road, Kingstown, VC0100, St. Vincent and the Grenadines).
The information on this website is for informational purposes only and does not constitute any investment advice.
The company does not serve or provide services to customers who are residents of the US, Canada, Iran, The Democratic People's Republic of Korea, Yemen and FATF blacklisted countries.
Making transactions on financial markets with marginal financial instruments opens up wide possibilities and allows investors who are willing to take risks to earn high profits, carrying a potentially high risk of losses at the same time. Therefore you should responsibly approach the issue of choosing the appropriate investment strategy, taking the available resources into account, before starting trading.
Use of the information: full or partial use of materials from this website must always be referenced to TeleTrade as the source of information. Use of the materials on the Internet must be accompanied by a hyperlink to teletrade.org. Automatic import of materials and information from this website is prohibited.
Please contact our PR department if you have any questions or need assistance at pr@teletrade.global.
transfers