- Analytics
- News and Tools
- Market News
- NZD/USD Price Analysis: Downward trend likely to continue despite indicators recovering
NZD/USD Price Analysis: Downward trend likely to continue despite indicators recovering
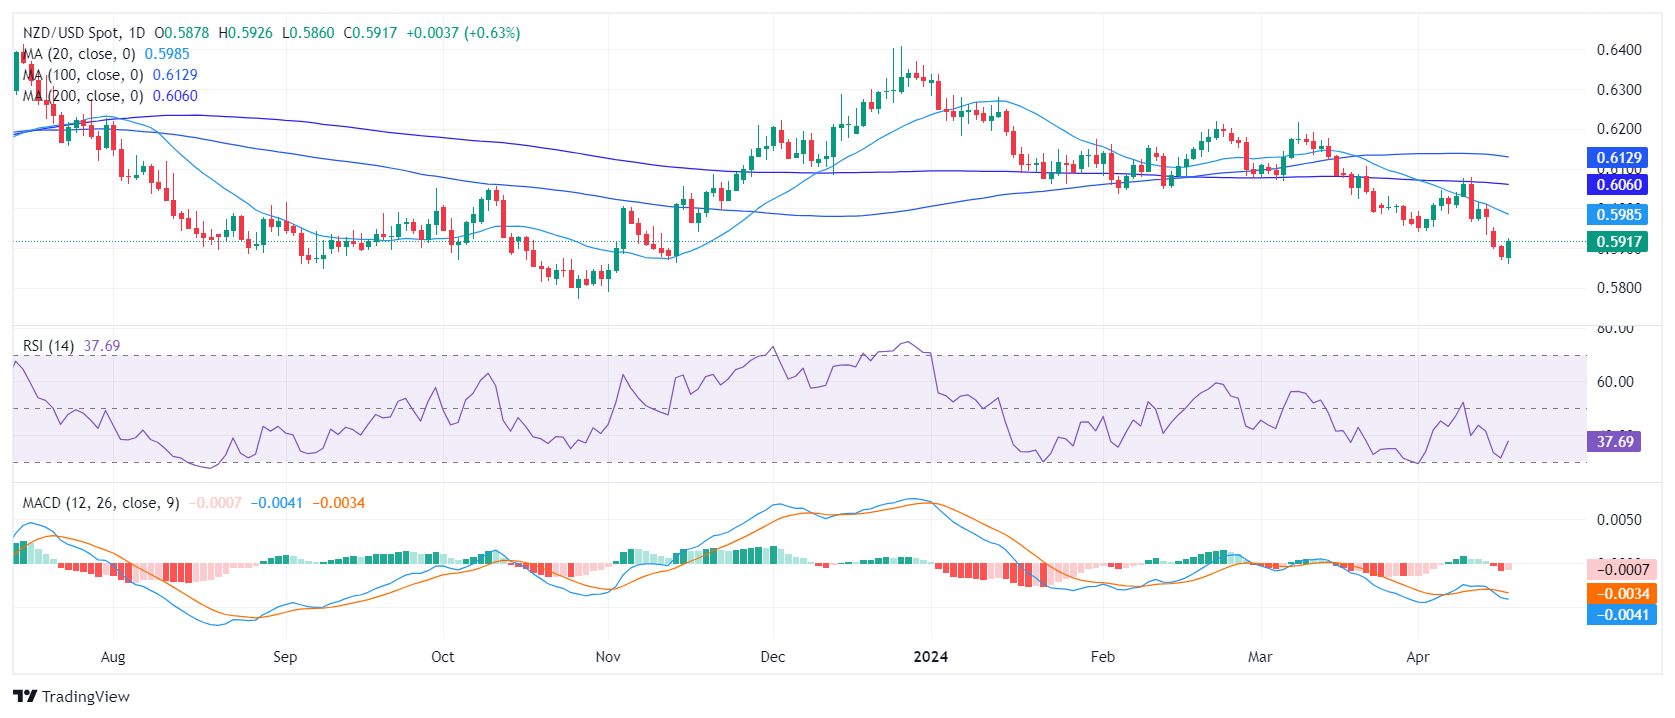
- The RSI on the daily chart lies deep in negative terrain but recovered.
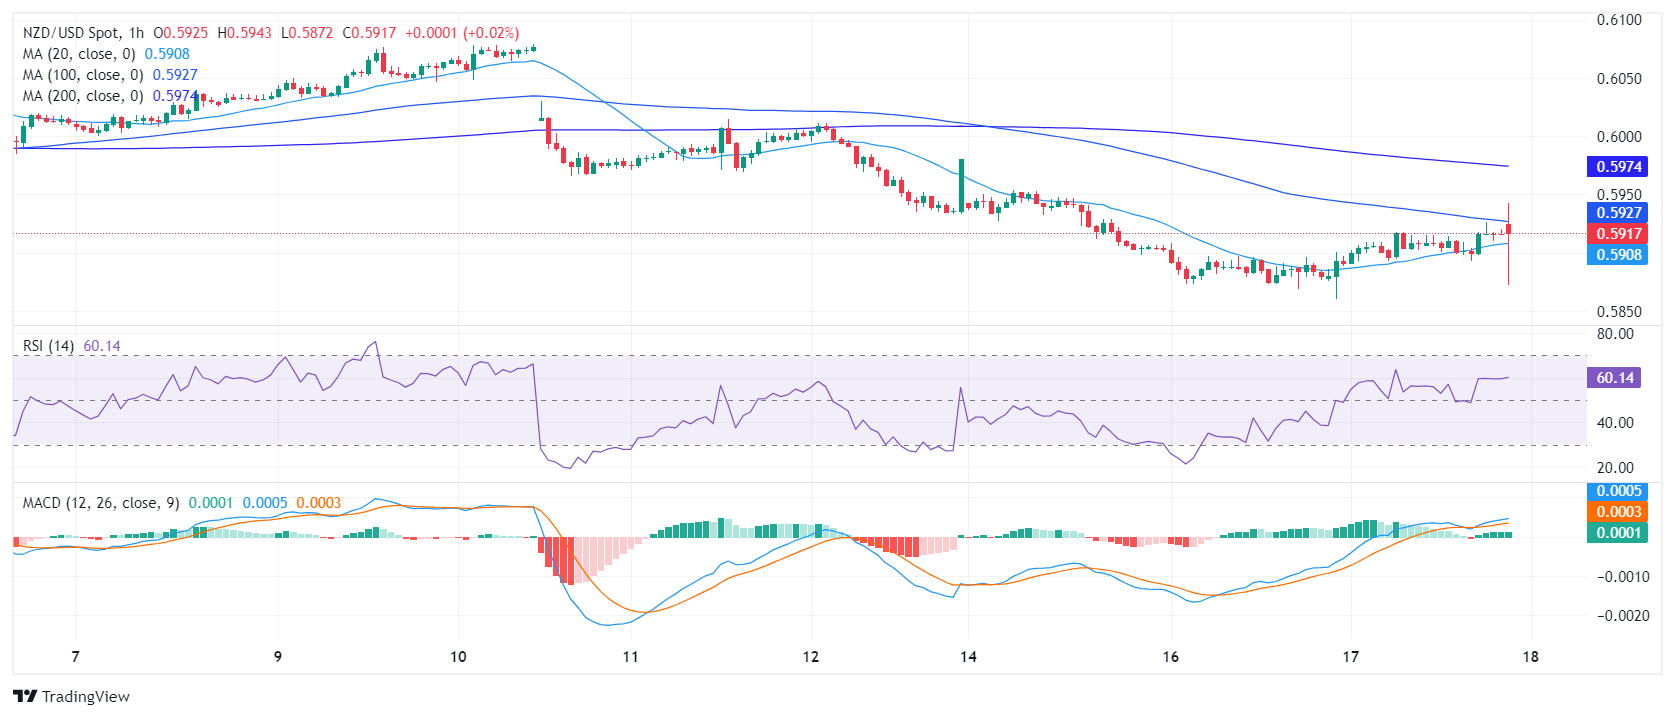
- The hourly RSI paints a growing buying momentum, trending the positive territory.
- The MACD on both charts signals a less intense selling momentum.
The NZD/USD stands recovered to 0.5919, it seeing 0.60% gains. The dominant sentiment remains bearish, subtly dominated by sellers due to the consistent positioning beneath key Simple Moving Averages (SMAs). However, indicators on the daily and hourly charts seem to be recovering.
On the daily chart, the Relative Strength Index (RSI) demonstrates a negative sentiment as it continues an under-50 trend. Although there was a slight uptick from the recent low point seen on Monday, the RSI remains in deep in negative territory. Moreover, the Moving Average Convergence Divergence (MACD) displays falling red bars, reinforcing a weakening bearish momentum.
NZD/USD daily chart
The hourly chart presents an interesting contrast. Here, recent RSI readings consistently float above 50, marking a positive territory. The latest reading is 57, revealing that buyers are taking the reins on the hourly scale. The MACD histogram echoes the buying momentum printing rising green bars.
NZD/USD hourly chart
Upon examining the long-term trend, it becomes apparent that the NZD/USD exhibits bearish momentum as it slots below the 20-day, 100-day, and 200-day Simple Moving Average (SMA) indicators. So any movements which keeps the pair beneath these levels shouldn't be considered as a clear buying signal.


© 2000-2026. All rights reserved.
This site is managed by Teletrade D.J. LLC 2351 LLC 2022 (Euro House, Richmond Hill Road, Kingstown, VC0100, St. Vincent and the Grenadines).
The information on this website is for informational purposes only and does not constitute any investment advice.
The company does not serve or provide services to customers who are residents of the US, Canada, Iran, The Democratic People's Republic of Korea, Yemen and FATF blacklisted countries.
Making transactions on financial markets with marginal financial instruments opens up wide possibilities and allows investors who are willing to take risks to earn high profits, carrying a potentially high risk of losses at the same time. Therefore you should responsibly approach the issue of choosing the appropriate investment strategy, taking the available resources into account, before starting trading.
Use of the information: full or partial use of materials from this website must always be referenced to TeleTrade as the source of information. Use of the materials on the Internet must be accompanied by a hyperlink to teletrade.org. Automatic import of materials and information from this website is prohibited.
Please contact our PR department if you have any questions or need assistance at pr@teletrade.global.
transfers