- Analytics
- News and Tools
- Market News
- EUR/JPY Price Analysis: Bullish push persists, eyes on waning momentum
EUR/JPY Price Analysis: Bullish push persists, eyes on waning momentum
- Flattening indicators on the daily chart may signal a period of consolidation.
- The flat RSI slope and falling MACD bars on the hourly chart translate into a neutral sentiment for the session.
The EUR/JPY currency pair stands at 164.71, reflecting a persistent bullish upsurge as it cleared daily losses and defended the 20-day Simple Moving Averages (SMA). However, caution is warranted considering the shifting market environment as the flattening momentum, revealed on the daily and hourly chart may cool down the bullish outlook.
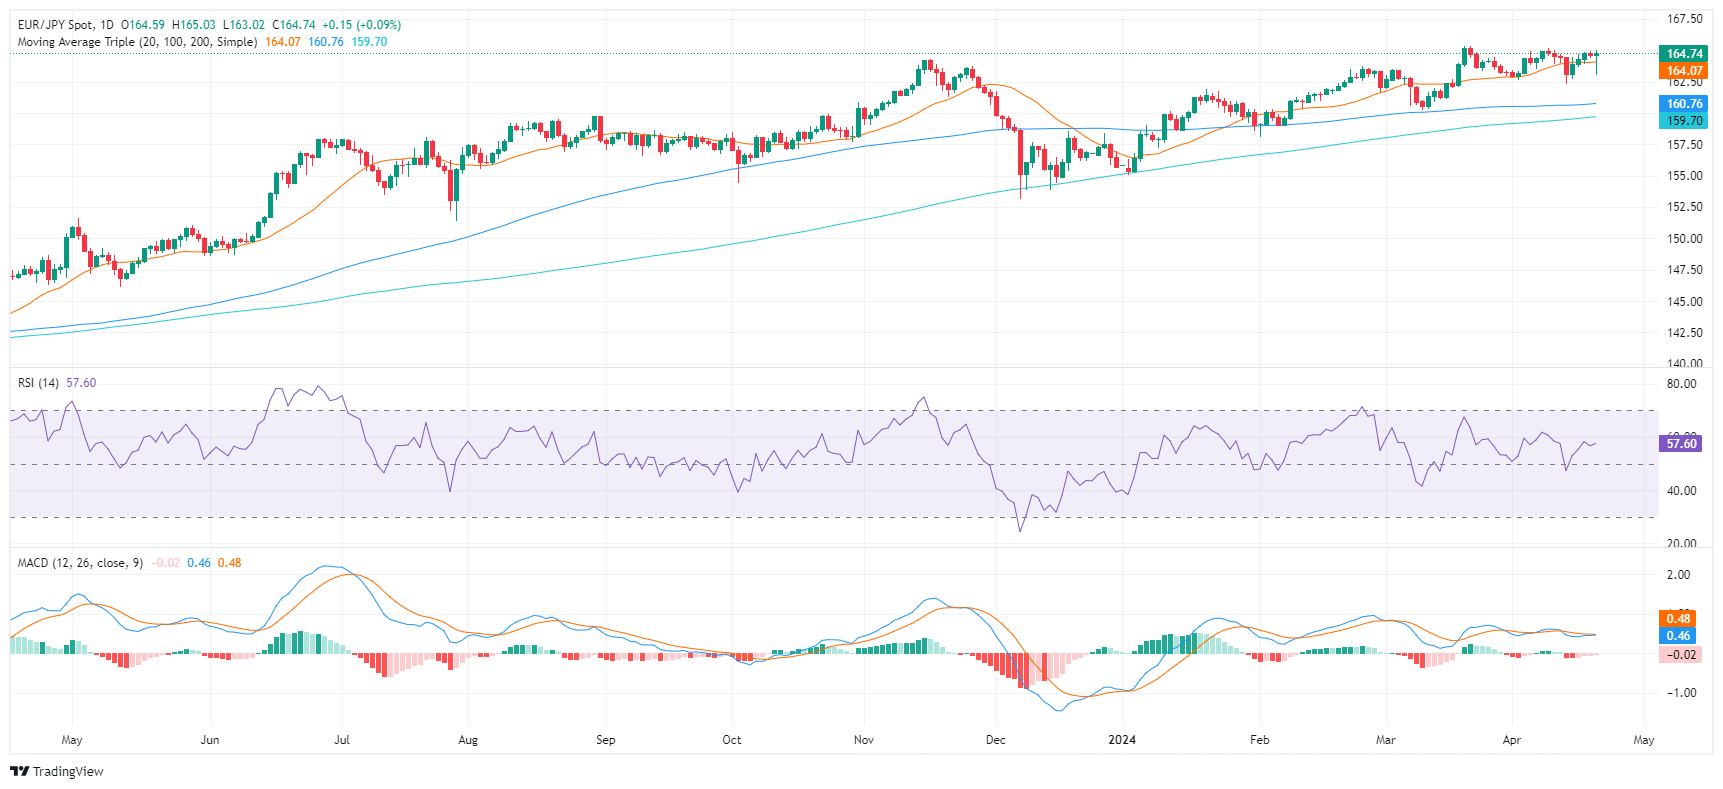
On the daily chart, the Relative Strength Index (RSI) pair is trending positive, at 58 but flattened. Simultaneously, the Moving Average Convergence Divergence (MACD) reveals red bars, hinting at a steady selling pressure.
EUR/JPY daily chart
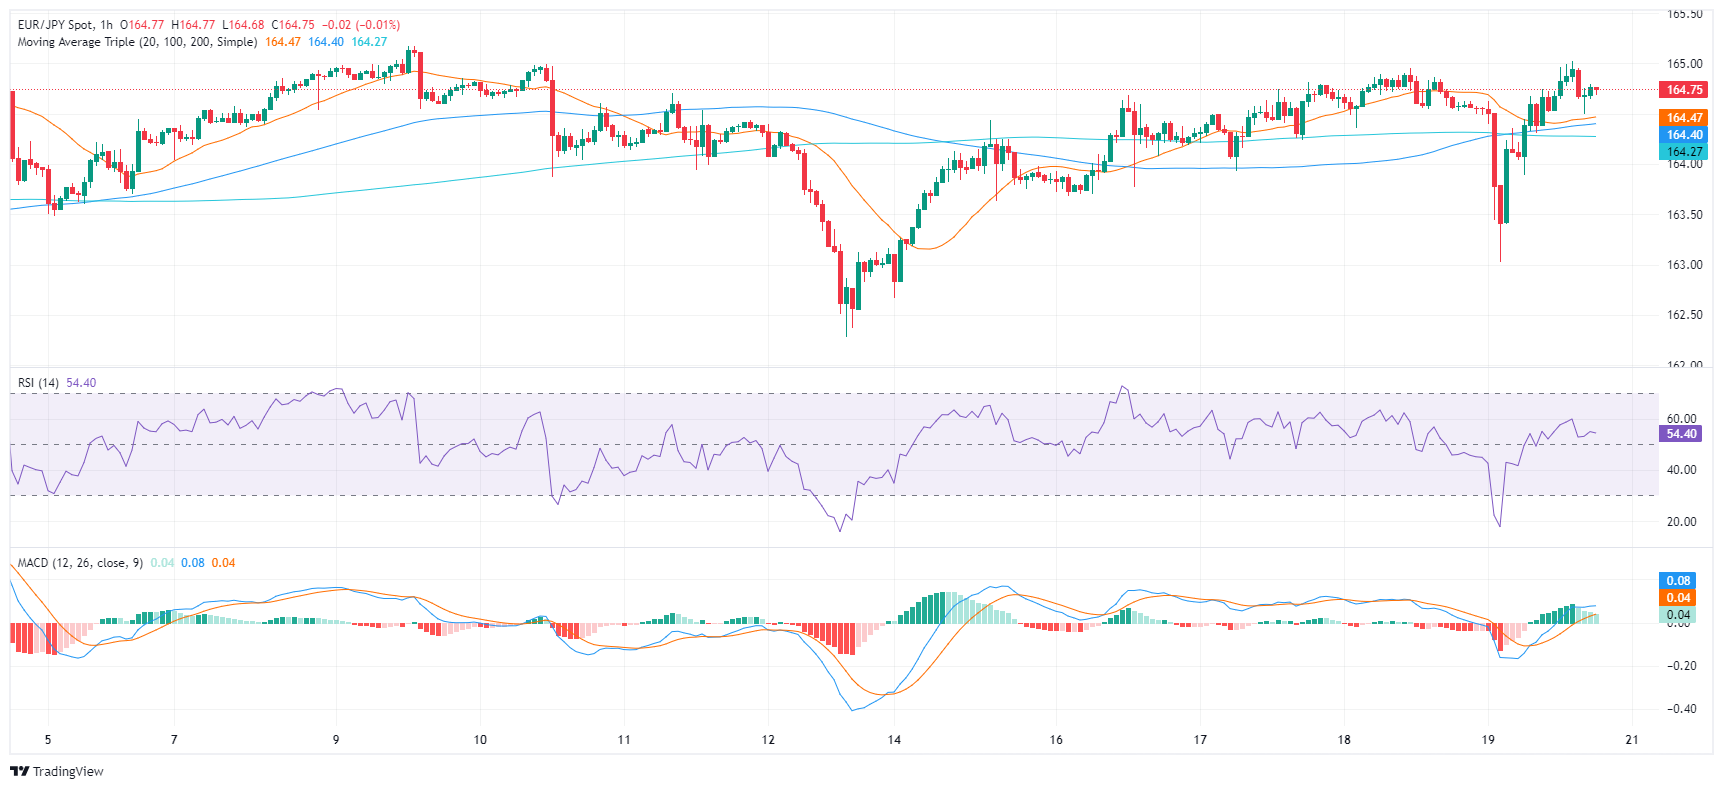
Taking into account the hourly chart, the latest RSI value is just above the middle ground at 53, also with a flat slope. This signifies neutrality within the market. Meanwhile, the MACD decreasing green bars, signaling a potential slowdown in the upward pressure.
EUR/JPY hourly chart
In light of the recent market conditions, the EUR/JPY lies above its 20,100, and 200-day SMA, depicting a sturdy ascending pattern in its broader outlook. It suggests the pair have shown resilience in maintaining the bullish momentum both from a short-term and long-term perspective. On Friday, the cross held onto the 20-day SMA at 164.00, suggesting that the bulls remain resilient. Essentially, if the pair continues to stay above the SMA's, it could extend its upward trajectory, enhancing its technical stance in the forthcoming sessions.


© 2000-2026. All rights reserved.
This site is managed by Teletrade D.J. LLC 2351 LLC 2022 (Euro House, Richmond Hill Road, Kingstown, VC0100, St. Vincent and the Grenadines).
The information on this website is for informational purposes only and does not constitute any investment advice.
The company does not serve or provide services to customers who are residents of the US, Canada, Iran, The Democratic People's Republic of Korea, Yemen and FATF blacklisted countries.
Making transactions on financial markets with marginal financial instruments opens up wide possibilities and allows investors who are willing to take risks to earn high profits, carrying a potentially high risk of losses at the same time. Therefore you should responsibly approach the issue of choosing the appropriate investment strategy, taking the available resources into account, before starting trading.
Use of the information: full or partial use of materials from this website must always be referenced to TeleTrade as the source of information. Use of the materials on the Internet must be accompanied by a hyperlink to teletrade.org. Automatic import of materials and information from this website is prohibited.
Please contact our PR department if you have any questions or need assistance at pr@teletrade.global.
transfers