- Analytics
- News and Tools
- Market News
- NZD/JPY Price Analysis: Bearish momentum strengthens as sellers reclaim the 20-day SMA
NZD/JPY Price Analysis: Bearish momentum strengthens as sellers reclaim the 20-day SMA
- The daily chart of the NZD/JPY indicates a weakening momentum, with RSI and MACD signifying rising selling pressure.
- The NZD/JPY plunged below the crucial short-term 20-day SMA, hinting at immediate bearish prospects.
- Despite recent bearish actions, the long-term outlook continues to favor buyers.
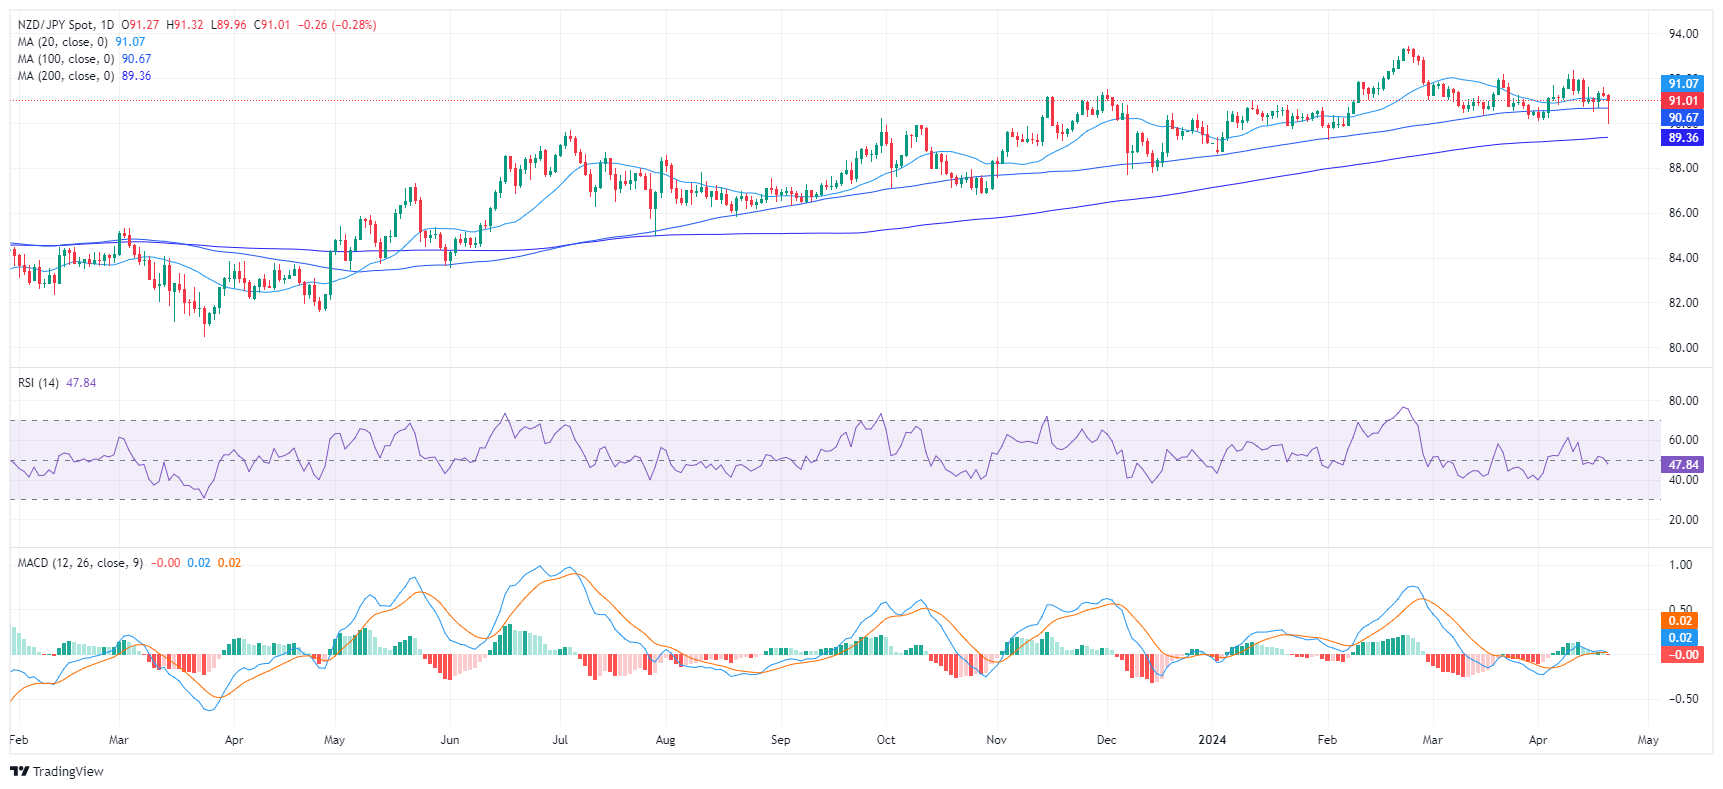
The NZD/JPY declined to 91.00, down by 0.27% on Friday. Bears are quietly gaining ground conquering the 20-day Simple Moving Average (SMA) and the selling traction is mounting. On the broader outlook, the trend is still bullish.
On the daily chart, the Relative Strength Index (RSI) pair reveals a recent drift into negative territory towards 47, indicating weakening momentum. Likewise, the Moving Average Convergence Divergence (MACD) paints a similar picture with a fresh red bar, signaling a growing bearish momentum. These indicators collectively imply sellers' dominance in the current market scenario.
NZD/JPY daily chart
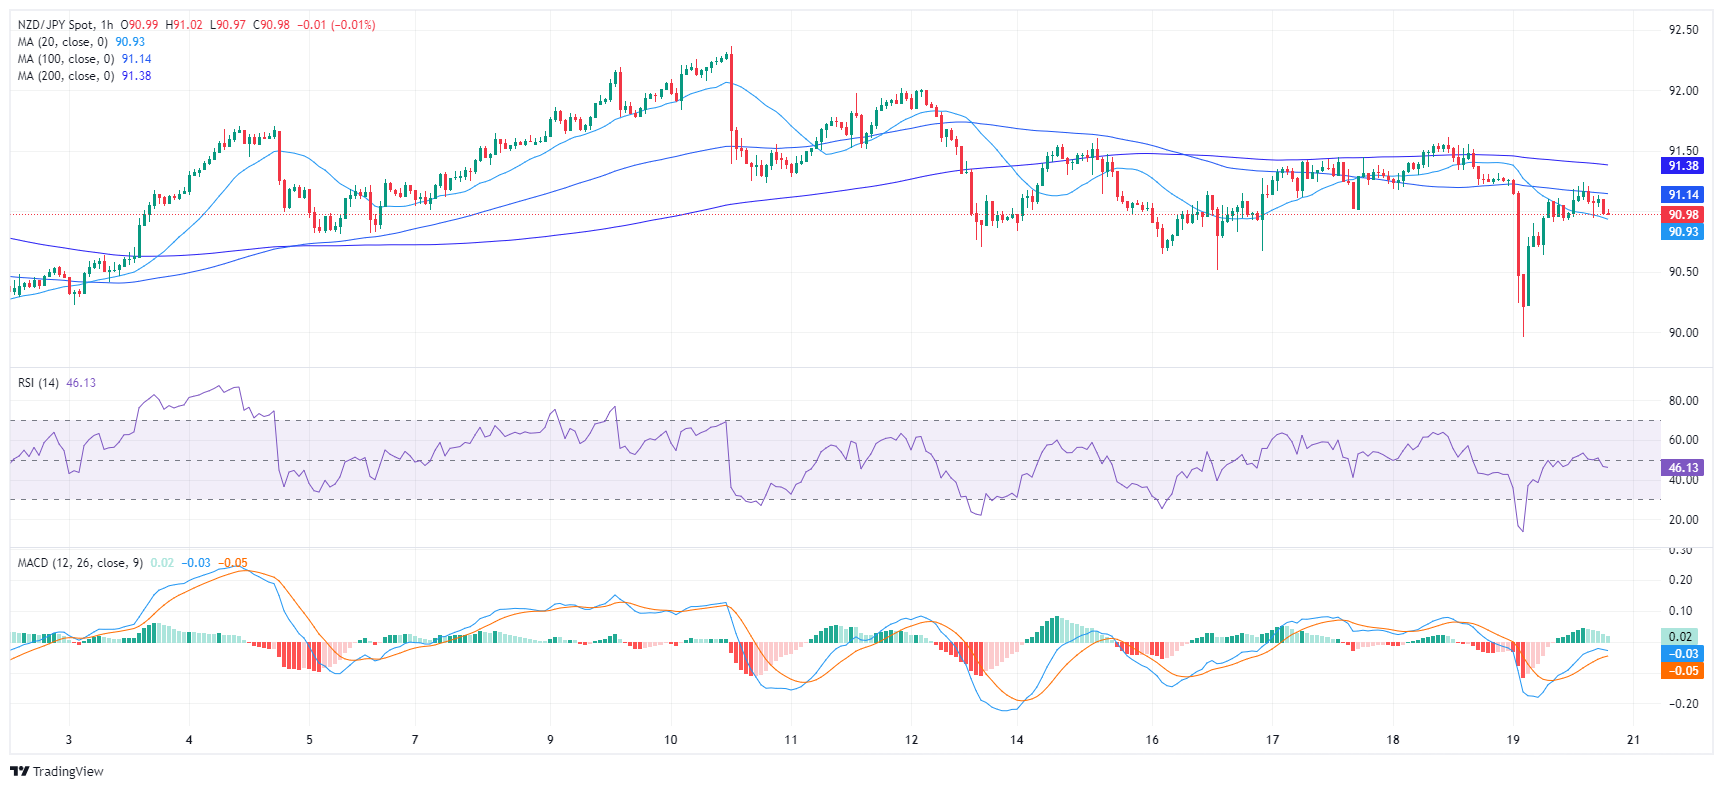
Upon examining the hourly chart, the RSI stands below its middle points, also adding arguments for a negative short-term outlook. In addition, the MACD histogram is printing decreasing green bars a clear indication of diminishing bullish momentum.
NZD/JPY hourly chart
When turning the lens to the broader landscape, NZD/JPY underwent substantial changes on Friday. The pair sunk beneath the 20-day Simple Moving Average (SMA), a significant short-term technical indicator, thus potentially establishing a bearish outlook in the immediate future. Despite this, the pair has managed to maintain its position above the 100-day and 200-day SMAs, revealing sustained bullish momentum over a more extended period. That being said, as bears gather ground, they might make a stride toward the 100-day SMA at around 90.60 which in case of conquering it, would worsen the outlook for the pair.


© 2000-2026. All rights reserved.
This site is managed by Teletrade D.J. LLC 2351 LLC 2022 (Euro House, Richmond Hill Road, Kingstown, VC0100, St. Vincent and the Grenadines).
The information on this website is for informational purposes only and does not constitute any investment advice.
The company does not serve or provide services to customers who are residents of the US, Canada, Iran, The Democratic People's Republic of Korea, Yemen and FATF blacklisted countries.
Making transactions on financial markets with marginal financial instruments opens up wide possibilities and allows investors who are willing to take risks to earn high profits, carrying a potentially high risk of losses at the same time. Therefore you should responsibly approach the issue of choosing the appropriate investment strategy, taking the available resources into account, before starting trading.
Use of the information: full or partial use of materials from this website must always be referenced to TeleTrade as the source of information. Use of the materials on the Internet must be accompanied by a hyperlink to teletrade.org. Automatic import of materials and information from this website is prohibited.
Please contact our PR department if you have any questions or need assistance at pr@teletrade.global.
transfers