- Analytics
- News and Tools
- Market News
- NZD/USD Price Analysis: Treads water around 0.5900 with a bearish sentiment
NZD/USD Price Analysis: Treads water around 0.5900 with a bearish sentiment
- NZD/USD maintains gains despite the bearish sentiment indicated by the technical analysis.
- Traders might contemplate short positions if the pair breaks below the support area encompassing 0.5863 and 0.5850.
- A pullback from the level of 0.5863 could lead the pair toward lower boundary of a symmetrical pattern around 0.5933.
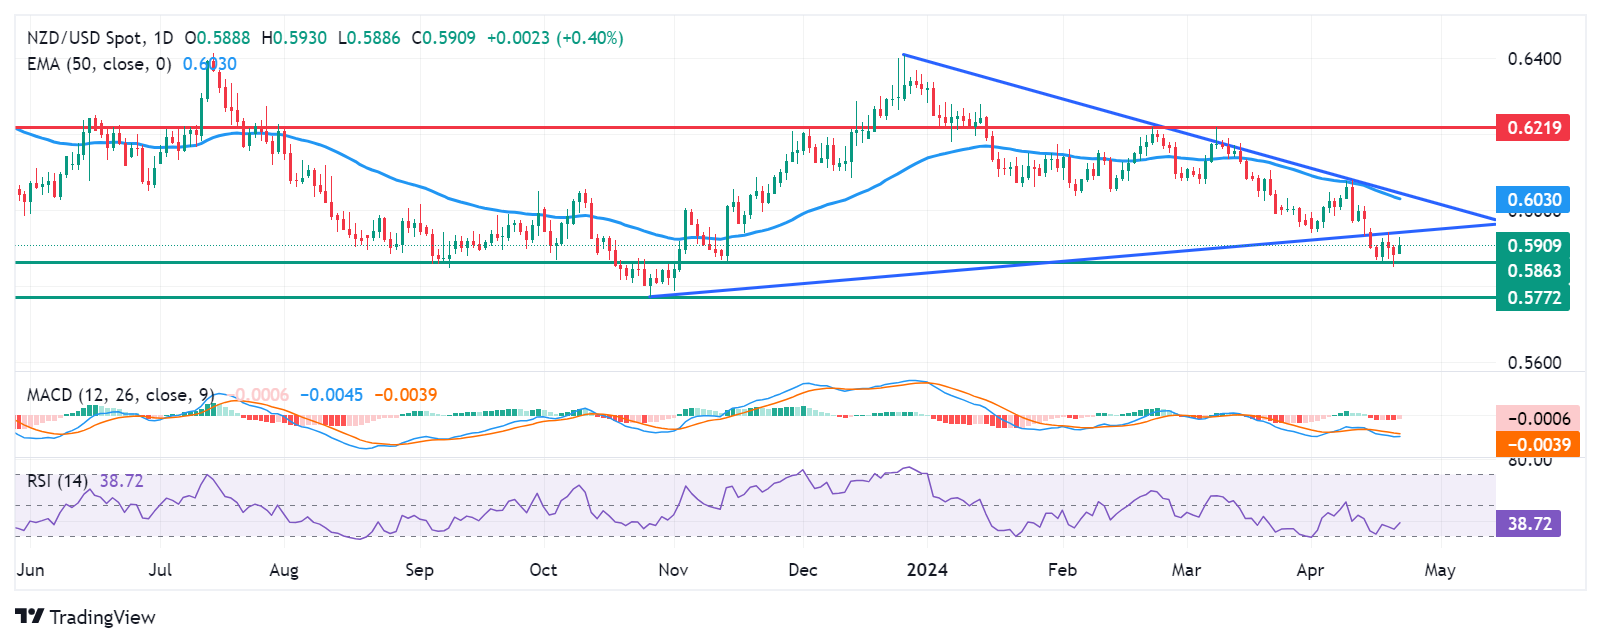
NZD/USD snaps its two-day losing streak, trading around 0.5910 during the European session on Monday. The recent break below the symmetrical channel on April 15 on the daily chart denotes a bearish sentiment.
Furthermore, analysis of the lagging indicator Moving Average Convergence Divergence (MACD) suggests a prevailing downward trend for the NZD/USD pair. This is evident from the MACD line's placement below the centerline and the signal line.
Additionally, the 14-day Relative Strength Index (RSI) remains below the 50 level, offering further confirmation of the bearish sentiment. This could prompt traders of the NZD/USD pair to focus on the region around the significant support levels of 0.5863 and 0.5850. Should these levels be breached, traders may consider short positions, potentially driving the pair to test the psychological barrier at 0.5800, followed by the support level of 0.5772.
Alternatively, if the pair rebounds from the support level of 0.5863, it could target the lower boundary of a symmetrical pattern around 0.5933 and the key level of 0.5950. A breakthrough above these levels might encourage traders to adopt long positions, shifting the sentiment towards bullish, with a potential aim to reach the 50-day Exponential Moving Average (EMA) positioned at 0.6030.
A break above the 50-day EMA will strengthen the bullish sentiment and test the upper boundary of the symmetrical pattern around 0.6043. A breakthrough at this level could prompt the traders to go bullish and approach the resistance barrier at 0.6219.
NZD/USD: Daily Chart


© 2000-2026. All rights reserved.
This site is managed by Teletrade D.J. LLC 2351 LLC 2022 (Euro House, Richmond Hill Road, Kingstown, VC0100, St. Vincent and the Grenadines).
The information on this website is for informational purposes only and does not constitute any investment advice.
The company does not serve or provide services to customers who are residents of the US, Canada, Iran, The Democratic People's Republic of Korea, Yemen and FATF blacklisted countries.
Making transactions on financial markets with marginal financial instruments opens up wide possibilities and allows investors who are willing to take risks to earn high profits, carrying a potentially high risk of losses at the same time. Therefore you should responsibly approach the issue of choosing the appropriate investment strategy, taking the available resources into account, before starting trading.
Use of the information: full or partial use of materials from this website must always be referenced to TeleTrade as the source of information. Use of the materials on the Internet must be accompanied by a hyperlink to teletrade.org. Automatic import of materials and information from this website is prohibited.
Please contact our PR department if you have any questions or need assistance at pr@teletrade.global.
transfers