- Analytics
- News and Tools
- Market News
- NZD/USD Price Analysis: Bears hold sway, subtle signs of potential bullish reversal emerging
NZD/USD Price Analysis: Bears hold sway, subtle signs of potential bullish reversal emerging
- Diminishing red bars of the daily MACD imply a potential easing of bearish momentum, signaling an early indication of a bullish turnaround.
- The hourly chart reveals an RSI oscillating in the positive zone, and MACD with green bars, signaling potential short-term positive momentum.
The NZD/USD pair advanced to 0.5920 on Monday, reflecting a gain of 0.47%. Overall, the bearish force remains strong, while the bulls begin to give signs of potential recovery, highlighting the start of a possible bullish reversal.
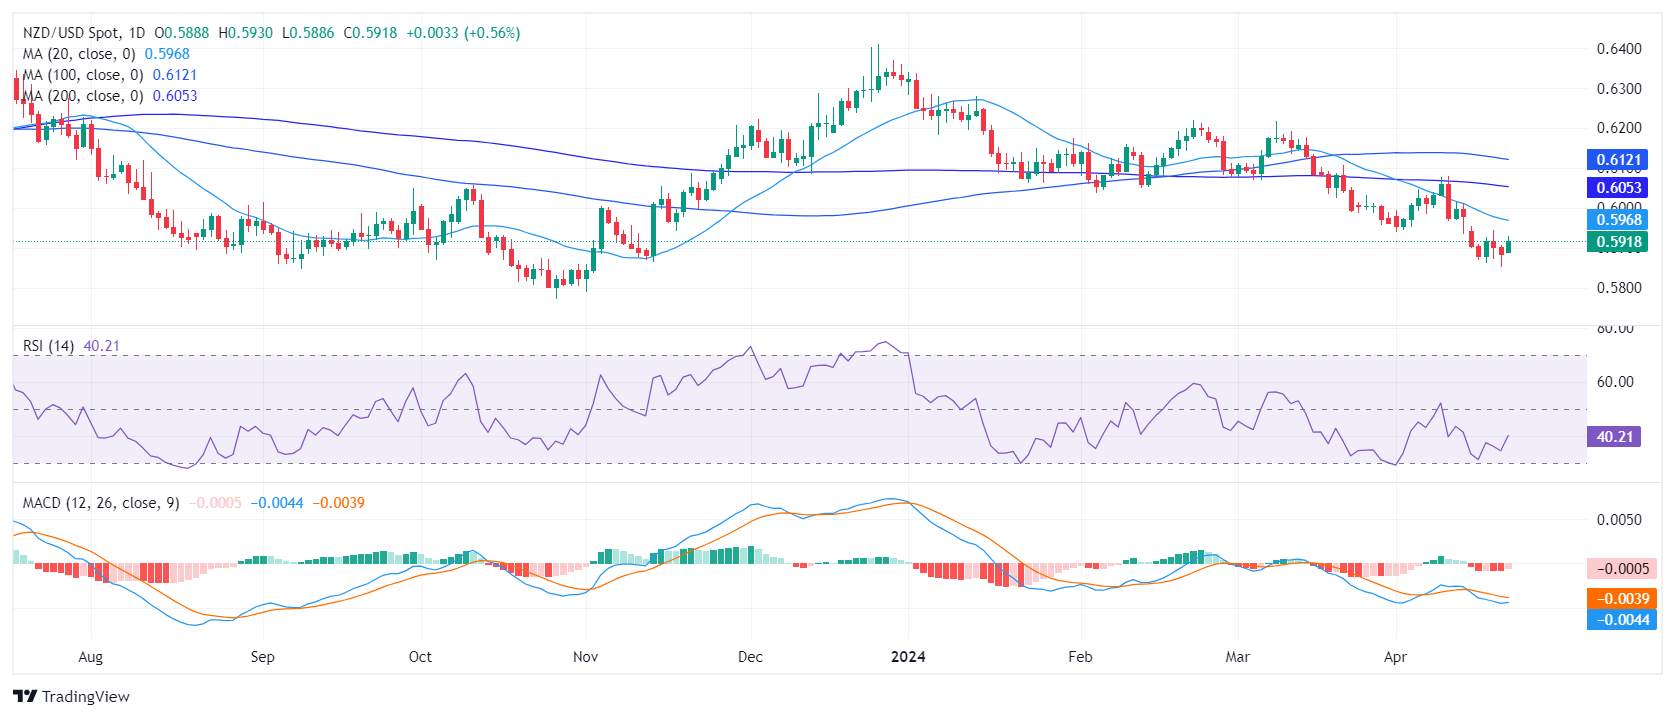
On the daily chart, the Relative Strength Index (RSI) remains in negative territory, indicating an ongoing bearish momentum. Although there is a minor upward trend, it remains short of breaking into the positive zone. The decreasing red bars of the Moving Average Convergence Divergence (MACD) suggest a slide in negative momentum, indicating possible signs of a potential bullish reversal.
NZD/USD daily chart
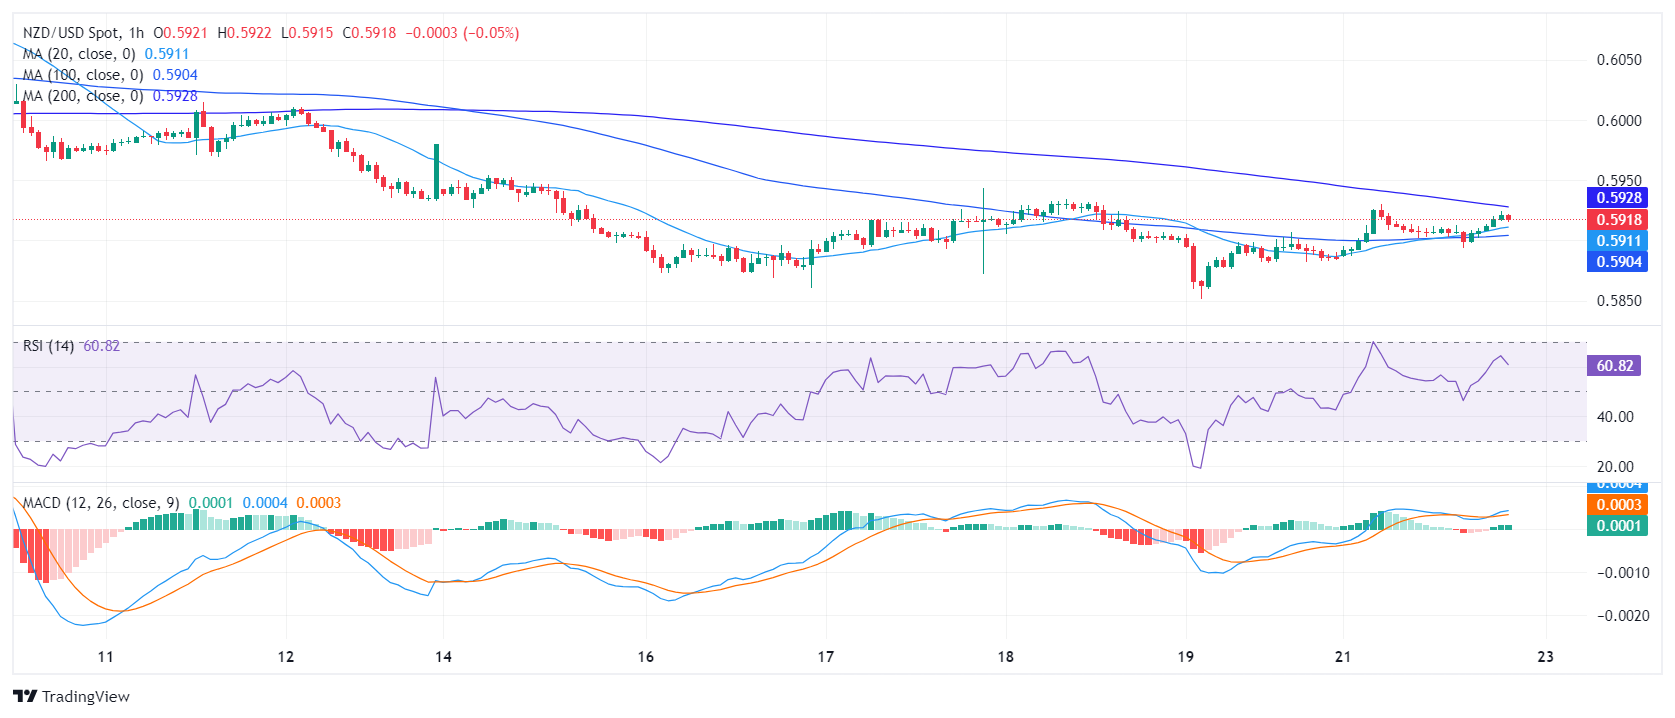
On the hourly chart, a similar condition prevails. The RSI has been oscillating in the positive territory for most of the session, but recently recorded a slight downward inclination, signaling a potential pullback. The MACD histogram also shows rising green bars, indicating a surge in positive momentum.
NZD/USD hourly chart
The broader market perspective reveals much regarding the NZD/USD's performance versus its Simple Moving Average (SMA). With the pair being below the 20,100 and 200-day SMA, a long and short-term downward pressure on the currency is evident.
In summary, there is a bearish dominance in the market, reinforced by both the RSI and MACD trends on the daily and hourly charts, as well as the SMA positioning. However, the slight increase in the daily RSI and the diminishing bearish momentum in the MACD could signify the early stages of a market reversal.


© 2000-2026. All rights reserved.
This site is managed by Teletrade D.J. LLC 2351 LLC 2022 (Euro House, Richmond Hill Road, Kingstown, VC0100, St. Vincent and the Grenadines).
The information on this website is for informational purposes only and does not constitute any investment advice.
The company does not serve or provide services to customers who are residents of the US, Canada, Iran, The Democratic People's Republic of Korea, Yemen and FATF blacklisted countries.
Making transactions on financial markets with marginal financial instruments opens up wide possibilities and allows investors who are willing to take risks to earn high profits, carrying a potentially high risk of losses at the same time. Therefore you should responsibly approach the issue of choosing the appropriate investment strategy, taking the available resources into account, before starting trading.
Use of the information: full or partial use of materials from this website must always be referenced to TeleTrade as the source of information. Use of the materials on the Internet must be accompanied by a hyperlink to teletrade.org. Automatic import of materials and information from this website is prohibited.
Please contact our PR department if you have any questions or need assistance at pr@teletrade.global.
transfers