- Analytics
- News and Tools
- Market News
- EUR/JPY Price Analysis: Bullish momentum prevails, reaches its highest since 2008
EUR/JPY Price Analysis: Bullish momentum prevails, reaches its highest since 2008
- The daily RSI signals growing buying momentum for the EUR/JPY.
- The daily MACD also shows a strengthening buying momentum.
- On the hourly chart, the same indicators reveal signs of a more immediate buyer dominance.
The EUR/JPY rose towards 165.64 on Tuesday’s session, its highest level since 2008, showcasing clear bullish signals that point to further gains. With buyers in command, the overall landscape for the pair can be viewed as bullish.
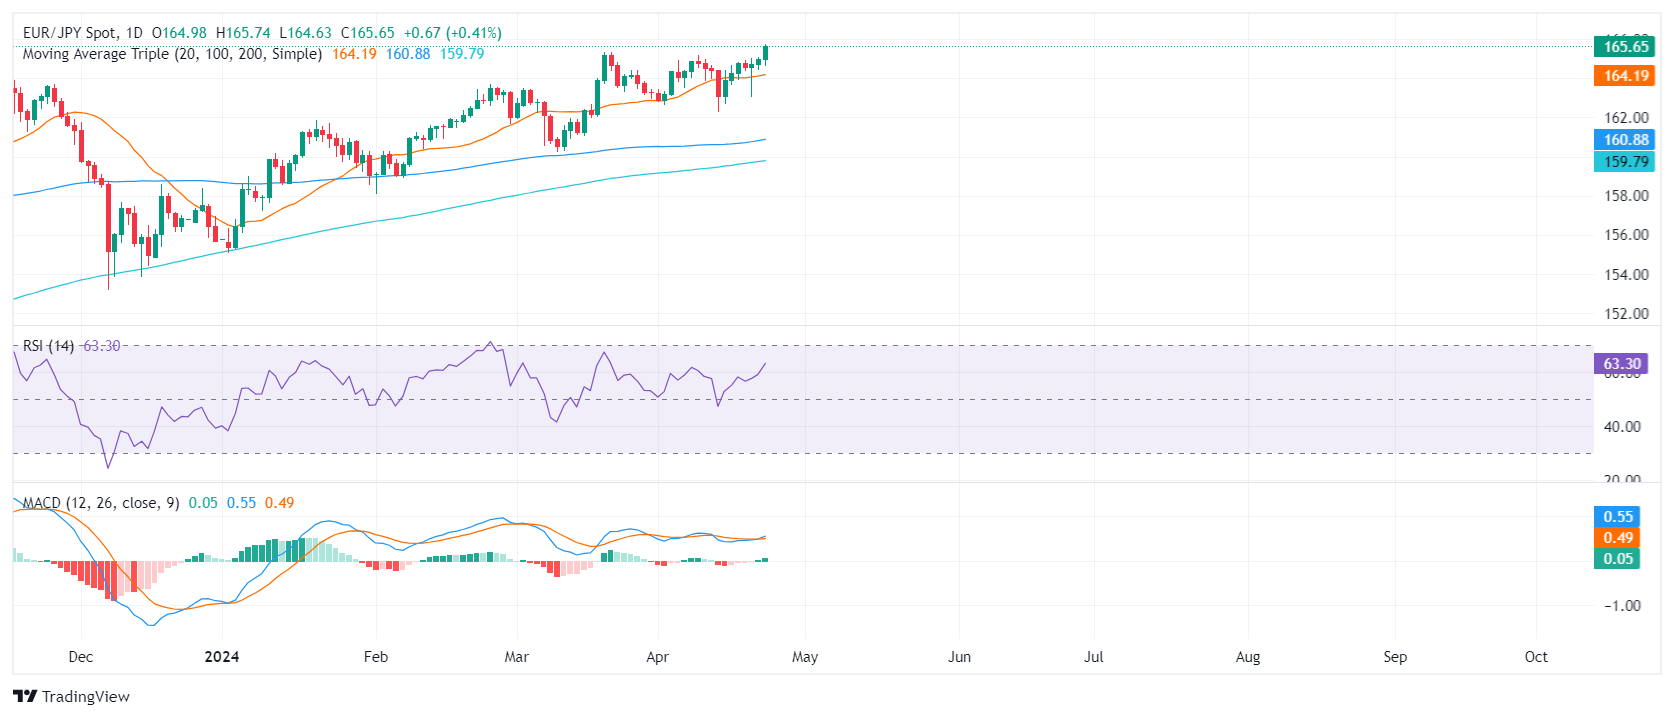
On the daily chart, the Relative Strength Index (RSI) shows an ascending trend for the, moving deep in positive terrain. Concurrently, the Moving Average Convergence Divergence (MACD) backs this outlook as its histogram displays ascending green bars, underscoring the positive momentum.
EUR/JPY daily chart
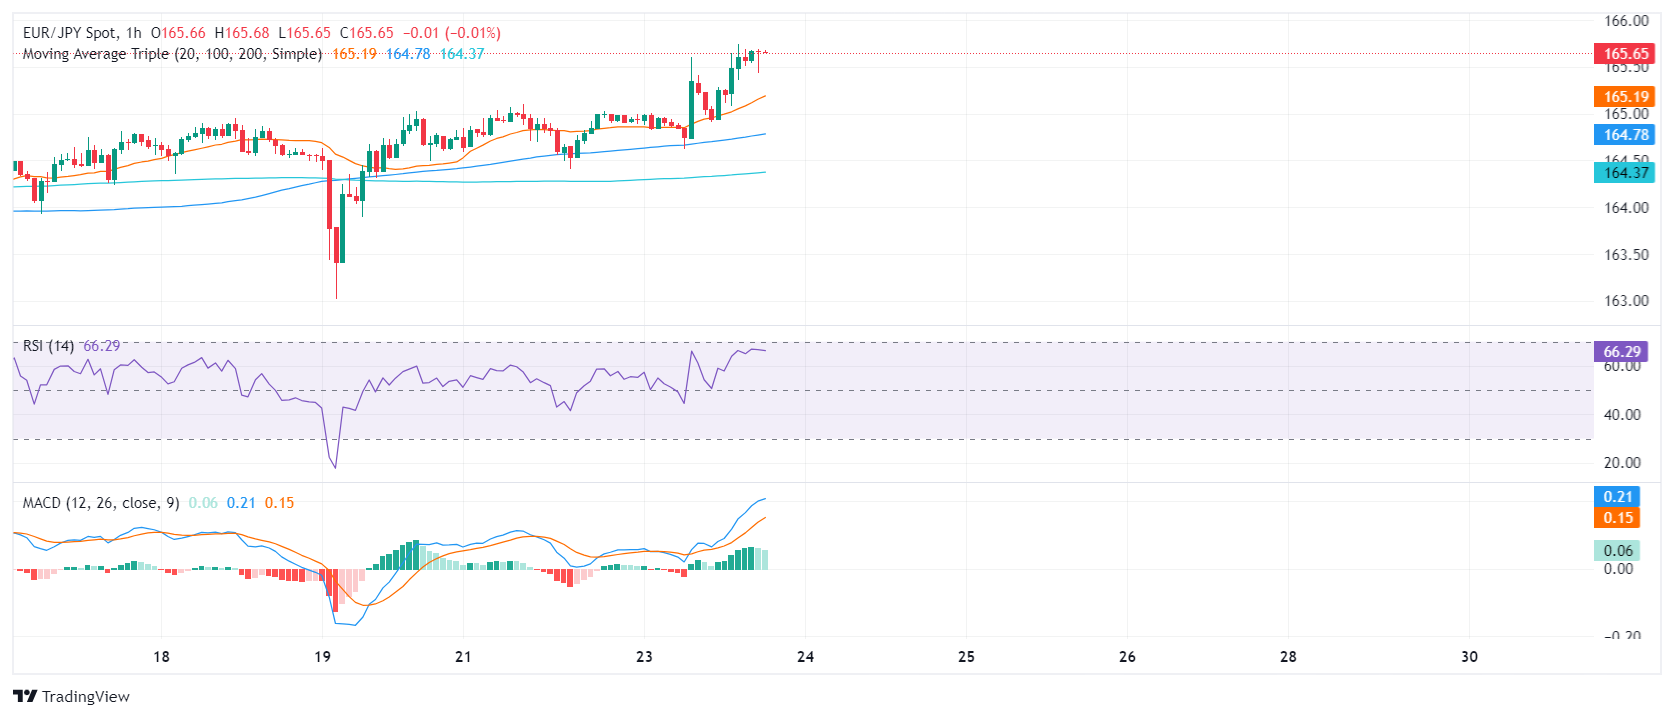
In contrast, the insight from the hourly chart provides a slightly different perspective. While the RSI also showcases an uptrend into positive territory, the current level was higher than that of the daily chart, hinting at a more immediate upward momentum. Simultaneously, the MACD on the hourly chart strengthens the bullish bias, evident from the rising green bars.
EUR/JPY hourly chart
Observing the broader view, the EUR/JPY stands above its 20, 100, and 200-day Simple Moving Average (SMA), suggesting a strong bullish trend both in the short and long-term perspectives. Overall, bears show no signs of recovering and as bulls capture fresh multi-year highs, there are no technical signals that threaten the clear bullish trend.


© 2000-2026. All rights reserved.
This site is managed by Teletrade D.J. LLC 2351 LLC 2022 (Euro House, Richmond Hill Road, Kingstown, VC0100, St. Vincent and the Grenadines).
The information on this website is for informational purposes only and does not constitute any investment advice.
The company does not serve or provide services to customers who are residents of the US, Canada, Iran, The Democratic People's Republic of Korea, Yemen and FATF blacklisted countries.
Making transactions on financial markets with marginal financial instruments opens up wide possibilities and allows investors who are willing to take risks to earn high profits, carrying a potentially high risk of losses at the same time. Therefore you should responsibly approach the issue of choosing the appropriate investment strategy, taking the available resources into account, before starting trading.
Use of the information: full or partial use of materials from this website must always be referenced to TeleTrade as the source of information. Use of the materials on the Internet must be accompanied by a hyperlink to teletrade.org. Automatic import of materials and information from this website is prohibited.
Please contact our PR department if you have any questions or need assistance at pr@teletrade.global.
transfers