- Analytics
- News and Tools
- Market News
- NZD/JPY Price Analysis: Bullish strength persists, additional corrective pullbacks are possible
NZD/JPY Price Analysis: Bullish strength persists, additional corrective pullbacks are possible
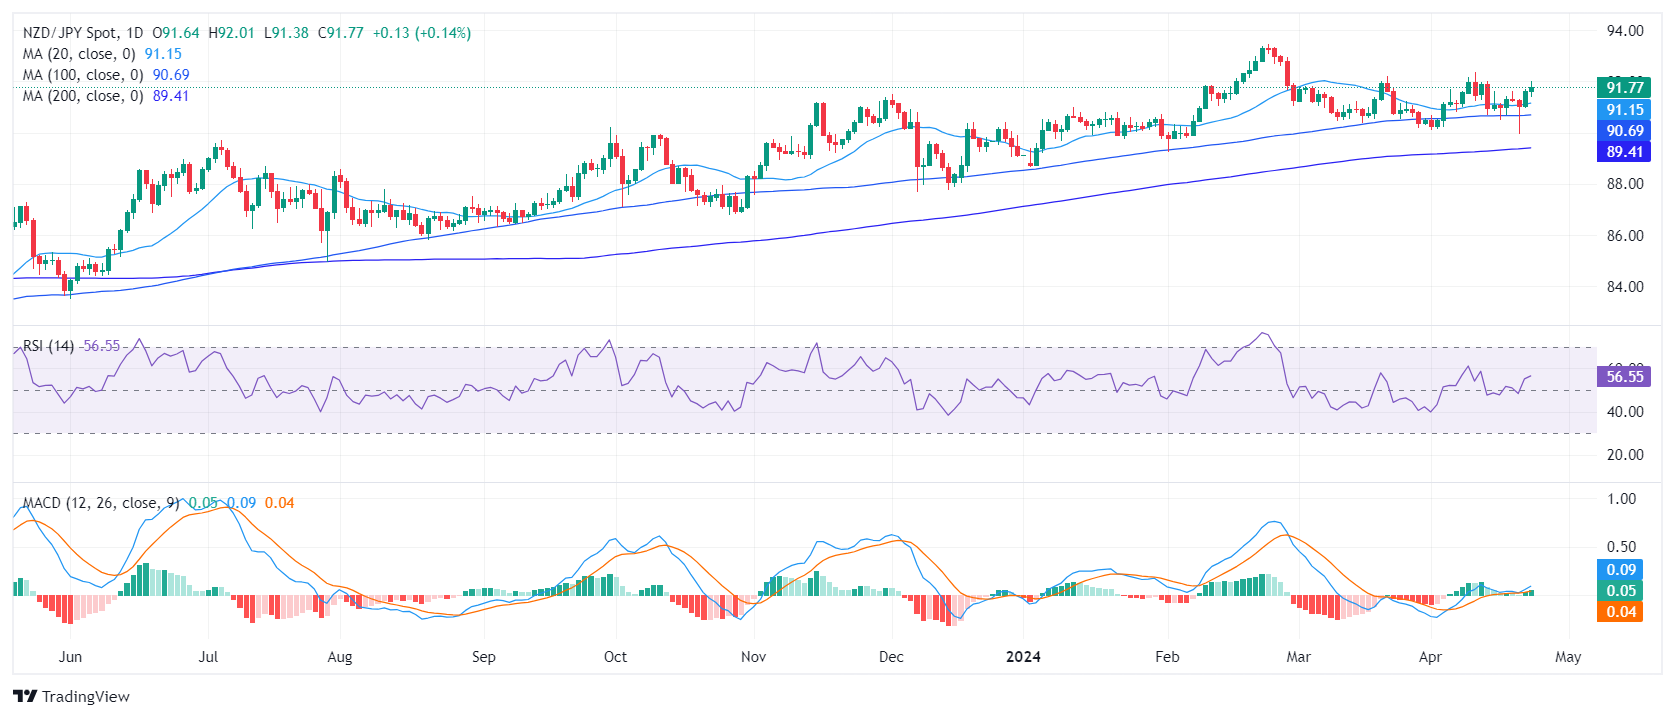
- The daily chart for NZD/JPY reveals continuing bullish momentum, with indicators in positive terrain.
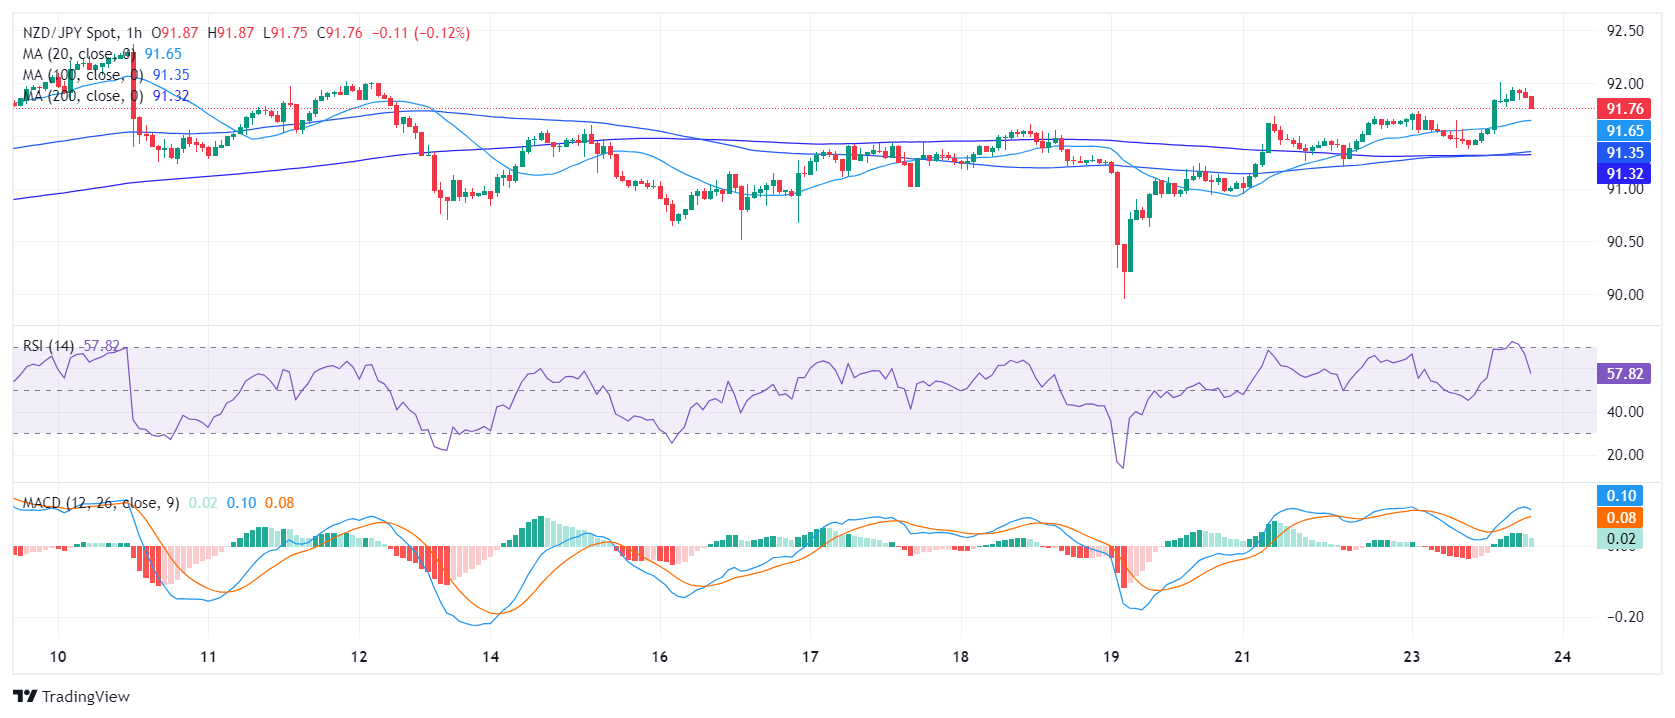
- The hourly indicators are correcting overbought conditions.
The NZD/JPY tallied daily gains on Tuesday’s session and rose to 91.78. The pair maintains a solid footing above all main Simple Moving Averages (SMAs), which may signal additional strength despite intra-day pull-backs seen during the American session. Indicators remain strong on the daily chart but the hourly ones are losing traction as they are correcting overbought conditions.
On the daily chart, the Relative Strength Index (RSI) for the NZD/JPY has been trending positively within the positive territory. The Moving Average Convergence Divergence (MACD) histogram also displays increasing green bars, indicating bullish momentum.
NZD/JPY daily chart
On the hourly chart, the RSI shows a reading of 68 but points south which reveals that buyers seem to be taking a breather as they hit overbought conditions earlier in the session. The hourly MACD, similar to the daily chart, also prints green bars, suggesting an ongoing upward trajectory.
NZD/JPY hourly chart
Looking at the bigger picture, the NZD/JPY remains favourably positioned above its relevant Simple Moving Average (SMA) metrics, these being the 20, 100, and 200-day time horizons. However, ahead of the Asian session the pair may see further pullbacks as indicators start to lose traction on the hourly chart. One the other hand, the daily RSI and MACD remain strong and unless the bears conquer the 20-day SMA, the outlook will remain positive.


© 2000-2026. All rights reserved.
This site is managed by Teletrade D.J. LLC 2351 LLC 2022 (Euro House, Richmond Hill Road, Kingstown, VC0100, St. Vincent and the Grenadines).
The information on this website is for informational purposes only and does not constitute any investment advice.
The company does not serve or provide services to customers who are residents of the US, Canada, Iran, The Democratic People's Republic of Korea, Yemen and FATF blacklisted countries.
Making transactions on financial markets with marginal financial instruments opens up wide possibilities and allows investors who are willing to take risks to earn high profits, carrying a potentially high risk of losses at the same time. Therefore you should responsibly approach the issue of choosing the appropriate investment strategy, taking the available resources into account, before starting trading.
Use of the information: full or partial use of materials from this website must always be referenced to TeleTrade as the source of information. Use of the materials on the Internet must be accompanied by a hyperlink to teletrade.org. Automatic import of materials and information from this website is prohibited.
Please contact our PR department if you have any questions or need assistance at pr@teletrade.global.
transfers