- Analytics
- News and Tools
- Market News
- NZD/USD Price Analysis: Could break into the symmetrical triangle, rises to near 0.5950
NZD/USD Price Analysis: Could break into the symmetrical triangle, rises to near 0.5950
- NZD/USD extends gains despite the prevailing bearish sentiment for the pair.
- A break below 0.5900 could lead the pair to test the rebound support level of 0.5863.
- A break into the triangle around the level of 0.5963 has the potential to weaken the bearish sentiment.
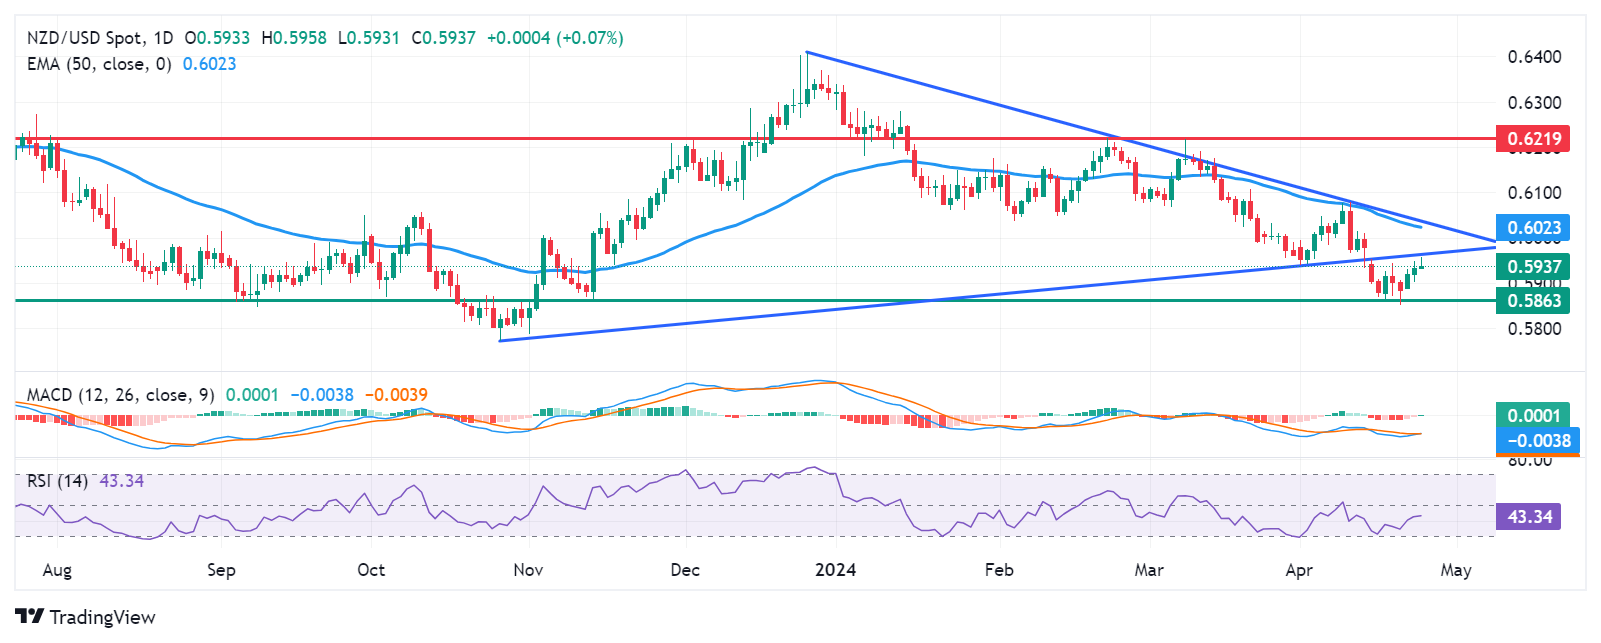
NZD/USD advances for the third consecutive session on Wednesday, trading around 0.5940 during the European session. The pair is testing the lower boundary of the daily symmetrical triangle around the level of 0.5963. A breach into the triangle could potentially weaken the bearish sentiment.
However, analysis of the lagging indicator Moving Average Convergence Divergence (MACD) suggests a downward trend for the NZD/USD pair. This is indicated by the placement of the MACD line below the centerline and the signal line.
Additionally, the 14-day Relative Strength Index (RSI) remains below the 50 level, further confirming the bearish sentiment. This could prompt NZD/USD to approach the psychological level of 0.5900. A break below this level may lead the pair to test the rebound support region around the levels of 0.5863 and 0.5850.
Alternatively, If the NZD/USD pair breaks into the symmetrical triangle, it might target the psychological barrier of 0.6000. A breakthrough above this level could support the pair's momentum to test the 50-day Exponential Moving Average (EMA) at 0.6023, which aligns with the upper boundary of the triangle around 0.6030.
NZD/USD: Daily Chart


© 2000-2026. All rights reserved.
This site is managed by Teletrade D.J. LLC 2351 LLC 2022 (Euro House, Richmond Hill Road, Kingstown, VC0100, St. Vincent and the Grenadines).
The information on this website is for informational purposes only and does not constitute any investment advice.
The company does not serve or provide services to customers who are residents of the US, Canada, Iran, The Democratic People's Republic of Korea, Yemen and FATF blacklisted countries.
Making transactions on financial markets with marginal financial instruments opens up wide possibilities and allows investors who are willing to take risks to earn high profits, carrying a potentially high risk of losses at the same time. Therefore you should responsibly approach the issue of choosing the appropriate investment strategy, taking the available resources into account, before starting trading.
Use of the information: full or partial use of materials from this website must always be referenced to TeleTrade as the source of information. Use of the materials on the Internet must be accompanied by a hyperlink to teletrade.org. Automatic import of materials and information from this website is prohibited.
Please contact our PR department if you have any questions or need assistance at pr@teletrade.global.
transfers