- Analytics
- News and Tools
- Market News
- NZD/USD Price Analysis: Bearish forces persist, bulls challenged the 20-day SMA
NZD/USD Price Analysis: Bearish forces persist, bulls challenged the 20-day SMA
- The daily RSI reveals potential minor correction, indicating latent buying momentum.
- The hourly indicators show fluctuating momentum, indicating a possible pause in the bearish impulse.
- For bulls to make ground, they would need to assert above the 20-day SMAs.
The NZD/USD rose to 0.5937 on Wednesday’s session, presenting subtle gains. Long-term bearish forces maintain overall control of the pair's course. However, there are signals that the bulls may be waking up and as sellers lose traction, it might be the buyer's turn now.
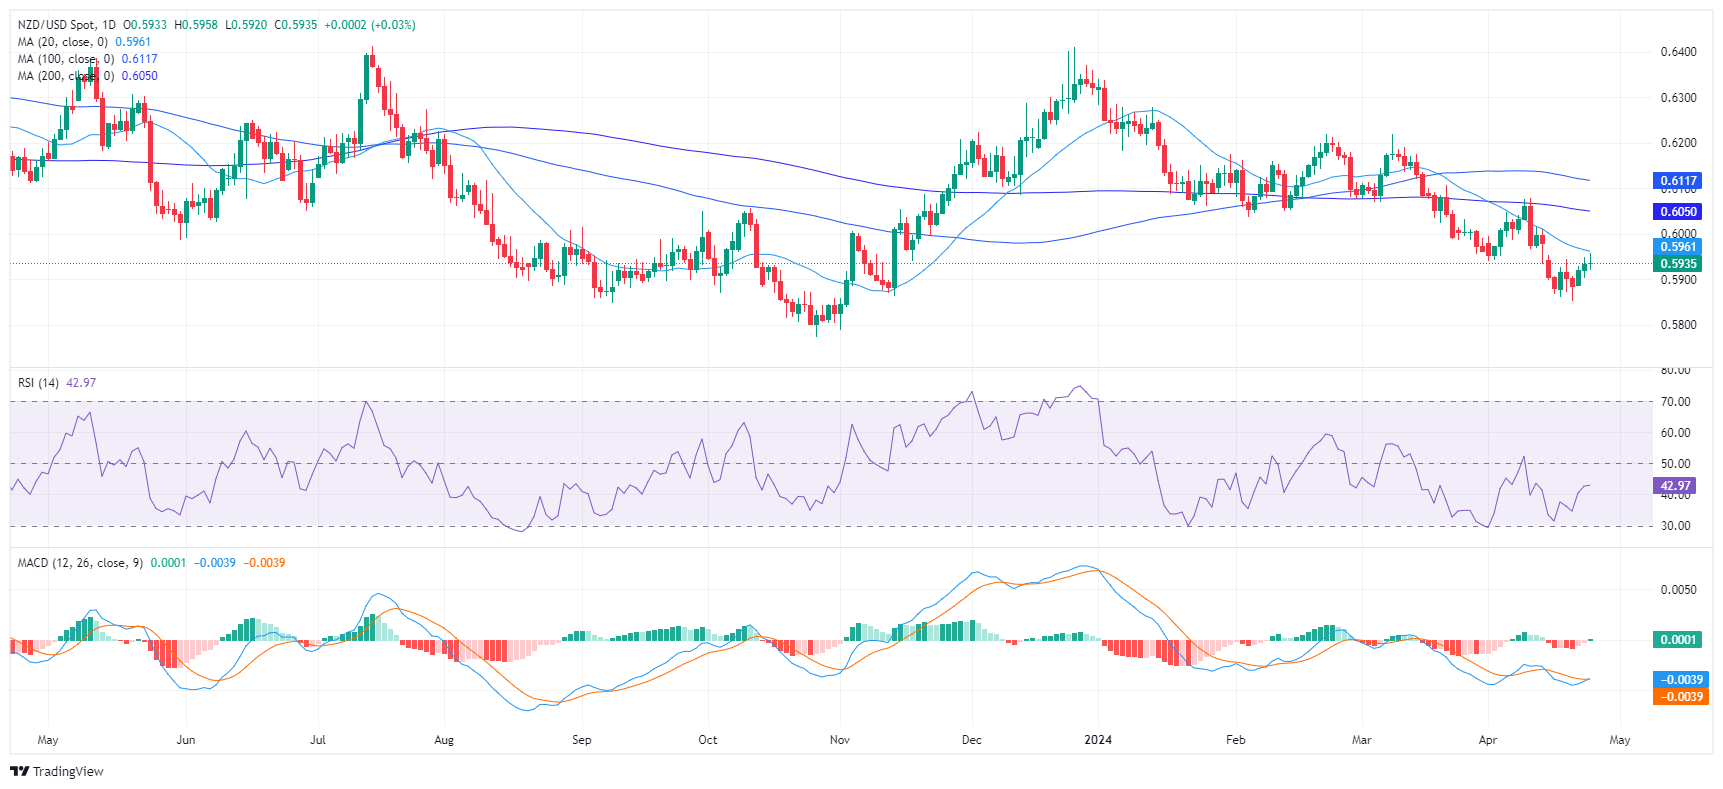
The daily chart Relative Strength Index (RSI) languishes in negative territory. However, an uptick suggests a potential minor correction following many days of depressed readings. The Moving Average Convergence Divergence (MACD) reveals a fresh green bar, signaling that positive momentum is starting to build, albeit the prevailing trend remains bearish.
NZD/USD daily chart
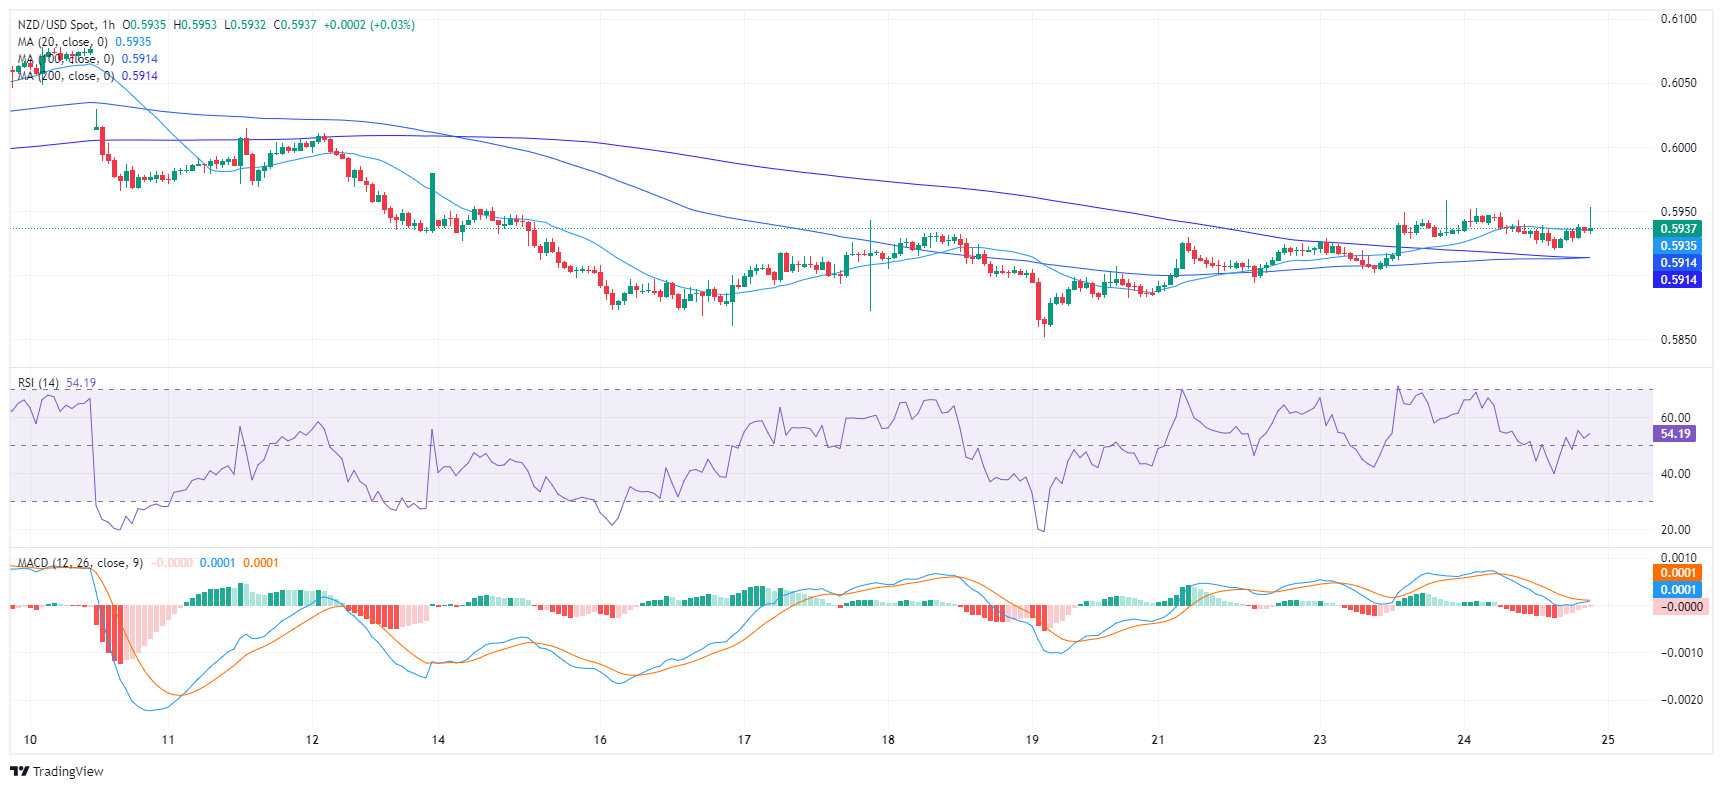
Zooming in, the hourly RSI readings display more fluctuations, swinging between the 40 and 55 marks within Wednesday's timeframe. Furthermore, the hourly MACD shows decreasing red bars, indicating a decline in the pair's downward momentum on this shorter-term chart.
NZD/USD hourly chart
Taking a broader view, the NZD/USD has stayed below its 20, 100, and 200-day Simple Moving Averages (SMAs). This positioning below the SMAs reveals a bearish trend prevailing in short- and long-term frames. Wednesday's rejection of buyers at 0.5960, at the 20-day SMA, reinforces the dominance of sellers in the market and suggests that the downward trend may continue. This situation implies that the current buying momentum isn’t strong enough to be considered a bullish signal. However, the tables would change if the buyers manage to conquer that level in the next sessions.


© 2000-2026. All rights reserved.
This site is managed by Teletrade D.J. LLC 2351 LLC 2022 (Euro House, Richmond Hill Road, Kingstown, VC0100, St. Vincent and the Grenadines).
The information on this website is for informational purposes only and does not constitute any investment advice.
The company does not serve or provide services to customers who are residents of the US, Canada, Iran, The Democratic People's Republic of Korea, Yemen and FATF blacklisted countries.
Making transactions on financial markets with marginal financial instruments opens up wide possibilities and allows investors who are willing to take risks to earn high profits, carrying a potentially high risk of losses at the same time. Therefore you should responsibly approach the issue of choosing the appropriate investment strategy, taking the available resources into account, before starting trading.
Use of the information: full or partial use of materials from this website must always be referenced to TeleTrade as the source of information. Use of the materials on the Internet must be accompanied by a hyperlink to teletrade.org. Automatic import of materials and information from this website is prohibited.
Please contact our PR department if you have any questions or need assistance at pr@teletrade.global.
transfers