- Analytics
- News and Tools
- Market News
- US Q1 GDP Preview: Economic growth set to remain firm in, albeit easing from Q4
US Q1 GDP Preview: Economic growth set to remain firm in, albeit easing from Q4
- The United States Gross Domestic Product is seen expanding at an annualized rate of 2.5% in Q1.
- The current resilience of the US economy bolsters the case for a soft landing.
- Markets now see the US Federal Reserve starting its easing cycle in September.
The US Bureau of Economic Analysis (BEA) will publish the first estimate of the US Gross Domestic Product (GDP) for the January-March period on Thursday. The report is expected to show an economic expansion of 2.5% after growing at an annualized pace of 3.4% during the prior quarter.
Forecasting US Gross Domestic Product: Deciphering the Numbers
Thursday's economic agenda in the US features the unveiling of the initial GDP report for the first quarter, set to be disclosed at 12:30 GMT. Analysts anticipate that the first assessment will reveal a 2.5% growth rate for the world's largest economy in the January–March period, a moderately robust pace, albeit markedly slower than the 3.4% expansion recorded in the preceding quarter.
From the latest release of the BEA: “Real GDP increased 2.5 percent in 2023 (from the 2022 annual level to the 2023 annual level), compared with an increase of 1.9 percent in 2022. The increase in real GDP in 2023 primarily reflected increases in consumer spending, nonresidential fixed investment, state and local government spending, exports, and federal government spending that were partly offset by decreases in residential fixed investment and private inventory investment. Imports decreased”.
Market participants will also pay close attention to the GDP Price Index (GDP Deflator), which represents the average change in prices of all new, domestically produced final goods and services in an economy over a specific period, typically a year or a quarter. It essentially reflects the inflation or deflation rate within an economy. During the last quarter of 2023, the GDP Price Index rose by 1.7% and is now seen rising by 3.0%.
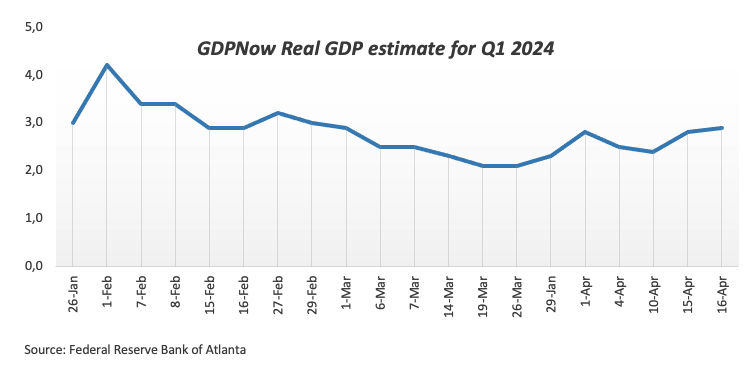
Furthermore, the Atlanta Fed GDPNow real GDP estimate for Q1 also props up the case for a solid performance of the US economy during that period.
According to analysts at TD Securities: “GDP growth likely modestly cooled to start the year, but to a still firm pace following two stronger expansions at 4.9% and 3.4% q/q annualized rate (AR) in Q3 and Q4 of last year, respectively. Growth in final domestic sales was likely firmer in 24Q1 than the headline would suggest (TD: 2.8% q/q AR), as we look for net trade & inventories to modestly dent still solid consumer spending.”
When is the GDP print released, and how can it affect the USD?
The US GDP report will be published at 12:30 GMT on Thursday. Meanwhile, the Greenback seems to have embarked on a consolidative phase ahead of the first estimate of US Q1 GDP as well as the inflation tracked by the Personal Consumption Expenditures Price Index (PCE) due on Friday.
Meanwhile, the macroeconomic outlook remains consistent with growing anticipation among market participants of the US Federal Reserve's (Fed) first interest rate reduction in September. On this, CME Group’s FedWatch Tool sees the probability of a lower interest rate at around 70%, up from nearly 3% a month ago.
Still around the commencement of the Fed’s easing cycle, Atlanta Federal Reserve Bank President Raphael Bostic predicted US inflation would reach 2% more gradually than previously predicted but did not rush to cut rates. New York Federal Reserve Bank President John Williams emphasized that the Fed's decisions are based on positive data and the strength of the economy, adding that the Fed may adjust if higher rates are needed. Fed Governor Michelle Bowman suggests that efforts to reduce inflation may have hit a snag, leaving uncertainty about interest rates' ability to return to the bank's target. Finally, in his latest comments, Fed Chairman Jerome Powell showed no rush to start reducing interest rates, matching the broad-based rate setters’ views.
A sneak peek ahead of the results
Stronger-than-anticipated GDP growth in the first quarter could bolster expectations that the Fed will delay the start of its easing programme, probably until September or December, which should in turn morph into further strength in the US Dollar (USD). The Greenback is also expected to hold its ground in the case of a higher GDP Price Deflator.
Alternatively, an abrupt change of heart around the US Dollar and, hence, a challenge to the current markets’ bets for a rate cut later in the year, should require an unexpectedly worse-than-estimated print, which appears quite unlikely for the time being.
Techs on the US Dollar Index (DXY)
Pablo Piovano, Senior Analyst at FXStreet, notes: “In case the bullish sentiment gathers steam, the USD Index (DXY) could confront the so-far 2024 top at 106.51 (April 16). Surpassing this level could encourage market participants to embark on a potential visit to the November peak at 107.11 (November 1), just ahead of the 2023 high at 107.34 (October 3).”
Pablo adds: “If we look in the opposite direction, the April bottom at 103.88 (April 9) remains underpinned by the 200-day Simple Moving Average (SMA) at 103.99, and this area is expected to offer decent contention. The breakdown of this region exposes a drop to the 100-day SMA at 103.67 prior to the March low at 102.35 (March 8).”
Economic Indicator
Gross Domestic Product Annualized
The real Gross Domestic Product (GDP) Annualized, released quarterly by the US Bureau of Economic Analysis, measures the value of the final goods and services produced in the United States in a given period of time. Changes in GDP are the most popular indicator of the nation’s overall economic health. The data is expressed at an annualized rate, which means that the rate has been adjusted to reflect the amount GDP would have changed over a year’s time, had it continued to grow at that specific rate. Generally speaking, a high reading is seen as bullish for the US Dollar (USD), while a low reading is seen as bearish.
Read more.Next release: Thu Apr 25, 2024 12:30 (Prel)
Frequency: Quarterly
Consensus: 2.5%
Previous: 3.4%
Source: US Bureau of Economic Analysis
The US Bureau of Economic Analysis (BEA) releases the Gross Domestic Product (GDP) growth on an annualized basis for each quarter. After publishing the first estimate, the BEA revises the data two more times, with the third release representing the final reading. Usually, the first estimate is the main market mover and a positive surprise is seen as a USD-positive development while a disappointing print is likely to weigh on the greenback. Market participants usually dismiss the second and third releases as they are generally not significant enough to meaningfully alter the growth picture.
GDP FAQs
A country’s Gross Domestic Product (GDP) measures the rate of growth of its economy over a given period of time, usually a quarter. The most reliable figures are those that compare GDP to the previous quarter e.g Q2 of 2023 vs Q1 of 2023, or to the same period in the previous year, e.g Q2 of 2023 vs Q2 of 2022. Annualized quarterly GDP figures extrapolate the growth rate of the quarter as if it were constant for the rest of the year. These can be misleading, however, if temporary shocks impact growth in one quarter but are unlikely to last all year – such as happened in the first quarter of 2020 at the outbreak of the covid pandemic, when growth plummeted.
A higher GDP result is generally positive for a nation’s currency as it reflects a growing economy, which is more likely to produce goods and services that can be exported, as well as attracting higher foreign investment. By the same token, when GDP falls it is usually negative for the currency. When an economy grows people tend to spend more, which leads to inflation. The country’s central bank then has to put up interest rates to combat the inflation with the side effect of attracting more capital inflows from global investors, thus helping the local currency appreciate.
When an economy grows and GDP is rising, people tend to spend more which leads to inflation. The country’s central bank then has to put up interest rates to combat the inflation. Higher interest rates are negative for Gold because they increase the opportunity-cost of holding Gold versus placing the money in a cash deposit account. Therefore, a higher GDP growth rate is usually a bearish factor for Gold price.


© 2000-2026. All rights reserved.
This site is managed by Teletrade D.J. LLC 2351 LLC 2022 (Euro House, Richmond Hill Road, Kingstown, VC0100, St. Vincent and the Grenadines).
The information on this website is for informational purposes only and does not constitute any investment advice.
The company does not serve or provide services to customers who are residents of the US, Canada, Iran, The Democratic People's Republic of Korea, Yemen and FATF blacklisted countries.
Making transactions on financial markets with marginal financial instruments opens up wide possibilities and allows investors who are willing to take risks to earn high profits, carrying a potentially high risk of losses at the same time. Therefore you should responsibly approach the issue of choosing the appropriate investment strategy, taking the available resources into account, before starting trading.
Use of the information: full or partial use of materials from this website must always be referenced to TeleTrade as the source of information. Use of the materials on the Internet must be accompanied by a hyperlink to teletrade.org. Automatic import of materials and information from this website is prohibited.
Please contact our PR department if you have any questions or need assistance at pr@teletrade.global.
transfers