- Analytics
- News and Tools
- Market News
- NZD/JPY Price Analysis: Bulls don’t give up and continue climbing, might be time for a correction
NZD/JPY Price Analysis: Bulls don’t give up and continue climbing, might be time for a correction
- The daily RSI shows strong buying momentum for the NZD/JPY, moving deep in positive territory.
- Parallelly, the daily MACD indicates green bars on a rising tendency, suggesting growing buying traction.
- A possible market correction may be imminent, as the daily RSI reaches near-overbought conditions.
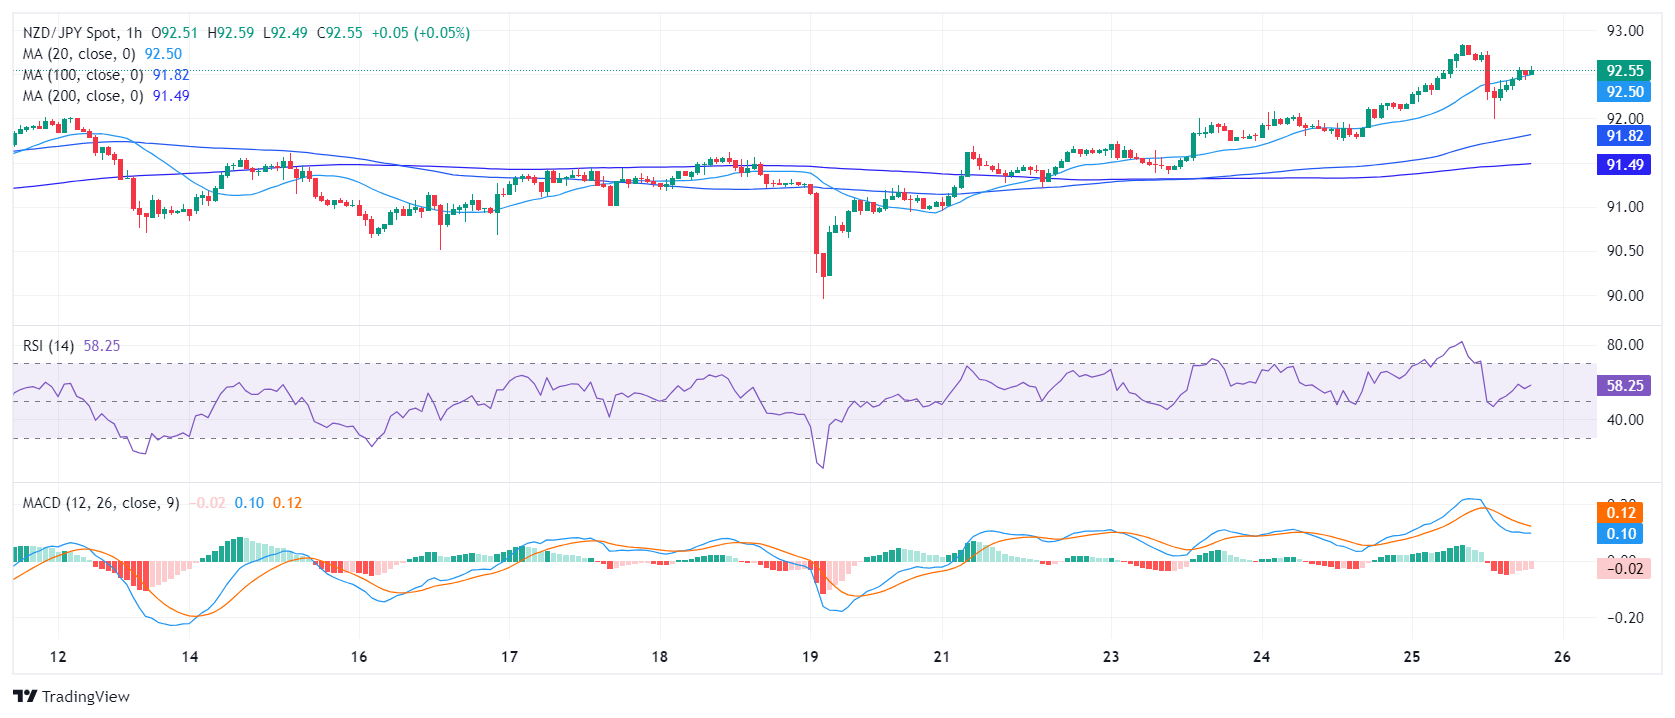
- A slight decline in the hourly indicators signals a pause in buyers' at least for Thursday’s session.
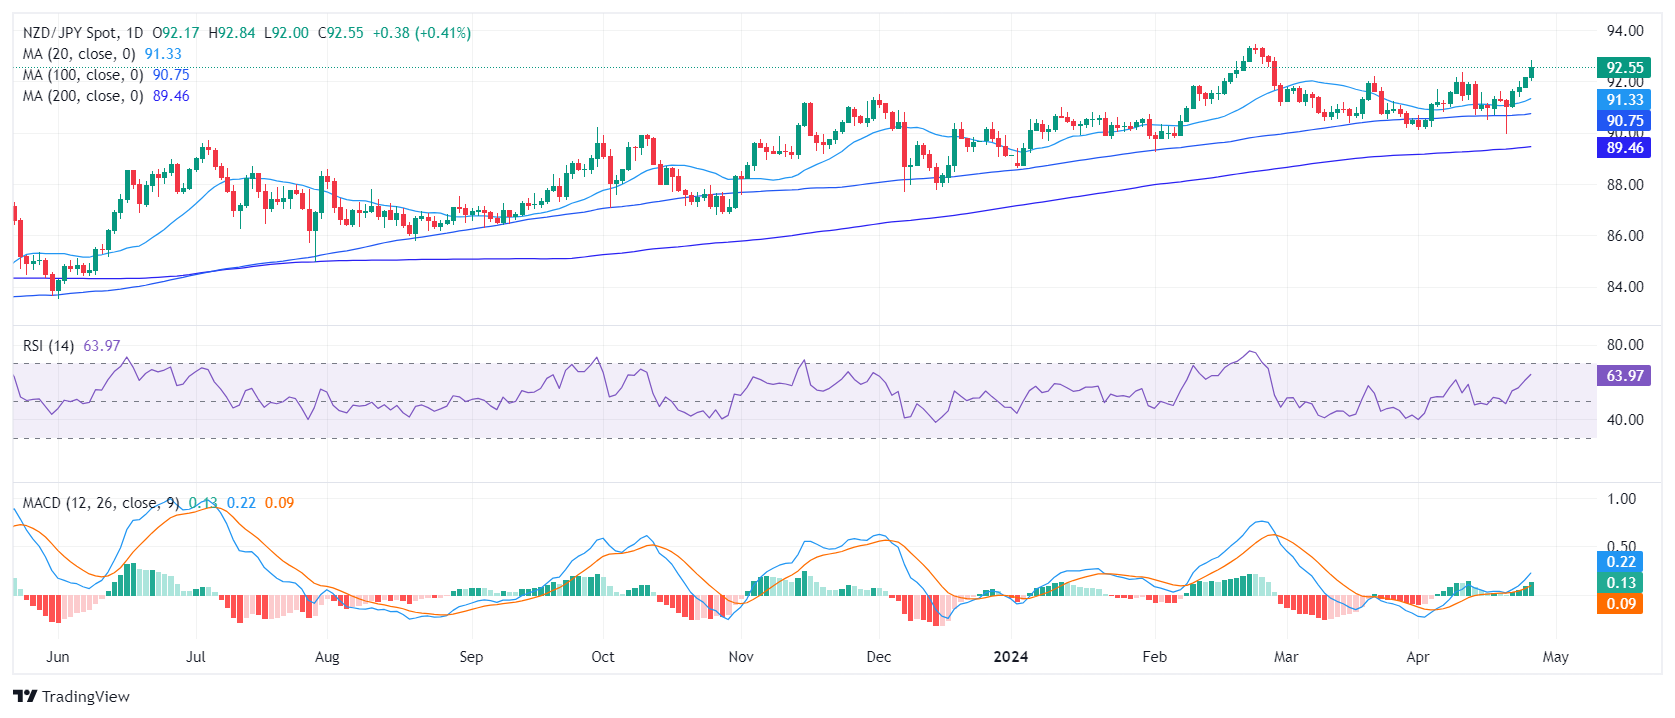
The NZD/JPY pair has shown a bullish performance, upheld by strong buying momentum over past trading sessions. Although it stands at 92.55, a high since February, signs of a potential market shift are emerging as indicators are near overbought territory.
Based on the daily chart, the Relative Strength Index (RSI) indicates increasing bullish momentum, having moved from a negative territory into positive conditions during the previous session and it resides near the 70 threshold. Concurrently, the Moving Average Convergence Divergence (MACD) shows rising green bars, indicating a developing positive momentum. Nonetheless, the RSI nearing overbought conditions provides a warning about the potential for market correction.
NZD/JPY daily chart
On the hourly chart, the RSI moved steadily upwards from a negative to a positive trend. However, recent RSI levels are slightly lower as they seem to be correcting overbought conditions noted earlier in the session.
NZD/JPY hourly chart
 In a broader context, the placement of the NZD/JPY relative to its Simple Moving Average (SMA), the cross pair is trading above its 20, 100, and 200-day SMA, suggestive of an upward trajectory. This positioning supports both short-term buy opportunities and a favorable long-term outlook, affirming a sustained long-term bullishness for the NZD/JPY.


© 2000-2026. All rights reserved.
This site is managed by Teletrade D.J. LLC 2351 LLC 2022 (Euro House, Richmond Hill Road, Kingstown, VC0100, St. Vincent and the Grenadines).
The information on this website is for informational purposes only and does not constitute any investment advice.
The company does not serve or provide services to customers who are residents of the US, Canada, Iran, The Democratic People's Republic of Korea, Yemen and FATF blacklisted countries.
Making transactions on financial markets with marginal financial instruments opens up wide possibilities and allows investors who are willing to take risks to earn high profits, carrying a potentially high risk of losses at the same time. Therefore you should responsibly approach the issue of choosing the appropriate investment strategy, taking the available resources into account, before starting trading.
Use of the information: full or partial use of materials from this website must always be referenced to TeleTrade as the source of information. Use of the materials on the Internet must be accompanied by a hyperlink to teletrade.org. Automatic import of materials and information from this website is prohibited.
Please contact our PR department if you have any questions or need assistance at pr@teletrade.global.
transfers