- Analytics
- News and Tools
- Market News
- Silver Price Analysis: XAG/USD dips amid strong US Dollar, warmer inflation
Silver Price Analysis: XAG/USD dips amid strong US Dollar, warmer inflation
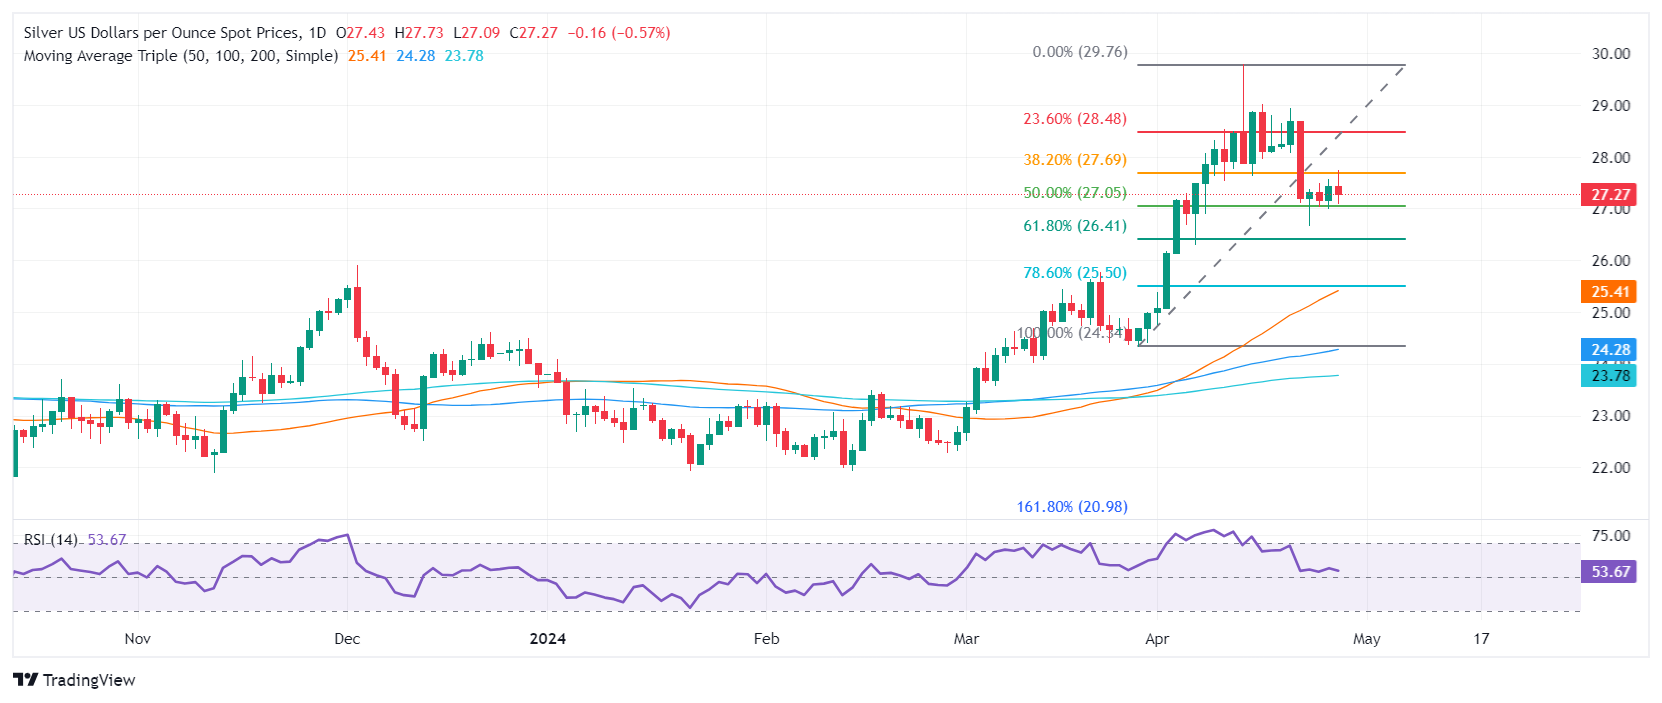
- Silver falls pulling back from a daily high of $27.73.
- Technical analysis indicates the uptrend is intact with key support at the $27.05 level, marked by the 50% Fibonacci retracement.
- If silver surpasses the $28.00 resistance, potential targets are $28.48 and possibly year highs near $29.76.
- Conversely, breaking below $27.05 could lead to $26.41 and further declines.
Silver's price dropped 0.79% after hitting a daily high of $27.73, as another inflation report in the United States showed warmer-than-expected inflation. The grey metal failed to capitalize on the fall in US Treasury yields, courtesy of a stronger US Dollar. At the time of writing, the XAG/USD trades at $27.21.
XAG/USD Price Analysis: Technical outlook
Despite retracing, the XAG/USD uptrend is intact, with dips viewed as opportunities for buyers to keep Silver's bid. During the last four trading days, Silver sellers had remained unable to push prices below the 50% Fibonacci retracement at $27.05, of the Fib drawn from the swing low at $24.34 to the latest high at $29.76.
For a bullish resumption, once traders surpass the $28.00 figure, that would pave the way for further upside. The first resistance would be the 23.6% Fib retracement at $28.48, followed by the $29.00 mark. The next supply area would be the year-to-date (YTD) high at $29.76.
On the flip side, bears could find some relief if XAG/USD slides below the 50% Fib retracement at $27.05, followed by the 61.8% retracement at $26.41. A subsequent dip is seen below that level, exposing the confluence of the 50-day moving average (DMA) and the 78.6% Fib retracement at $25.50.
XAG/USD Price Action – Daily Chart


© 2000-2026. All rights reserved.
This site is managed by Teletrade D.J. LLC 2351 LLC 2022 (Euro House, Richmond Hill Road, Kingstown, VC0100, St. Vincent and the Grenadines).
The information on this website is for informational purposes only and does not constitute any investment advice.
The company does not serve or provide services to customers who are residents of the US, Canada, Iran, The Democratic People's Republic of Korea, Yemen and FATF blacklisted countries.
Making transactions on financial markets with marginal financial instruments opens up wide possibilities and allows investors who are willing to take risks to earn high profits, carrying a potentially high risk of losses at the same time. Therefore you should responsibly approach the issue of choosing the appropriate investment strategy, taking the available resources into account, before starting trading.
Use of the information: full or partial use of materials from this website must always be referenced to TeleTrade as the source of information. Use of the materials on the Internet must be accompanied by a hyperlink to teletrade.org. Automatic import of materials and information from this website is prohibited.
Please contact our PR department if you have any questions or need assistance at pr@teletrade.global.
transfers