- Analytics
- News and Tools
- Market News
- GBP/USD Price Analysis: Climbs above 1.2500, with bulls targeting 200-DMA
GBP/USD Price Analysis: Climbs above 1.2500, with bulls targeting 200-DMA
- GBP/USD rises, rebounding from 1.2474 amid rumors impacting the US Dollar.
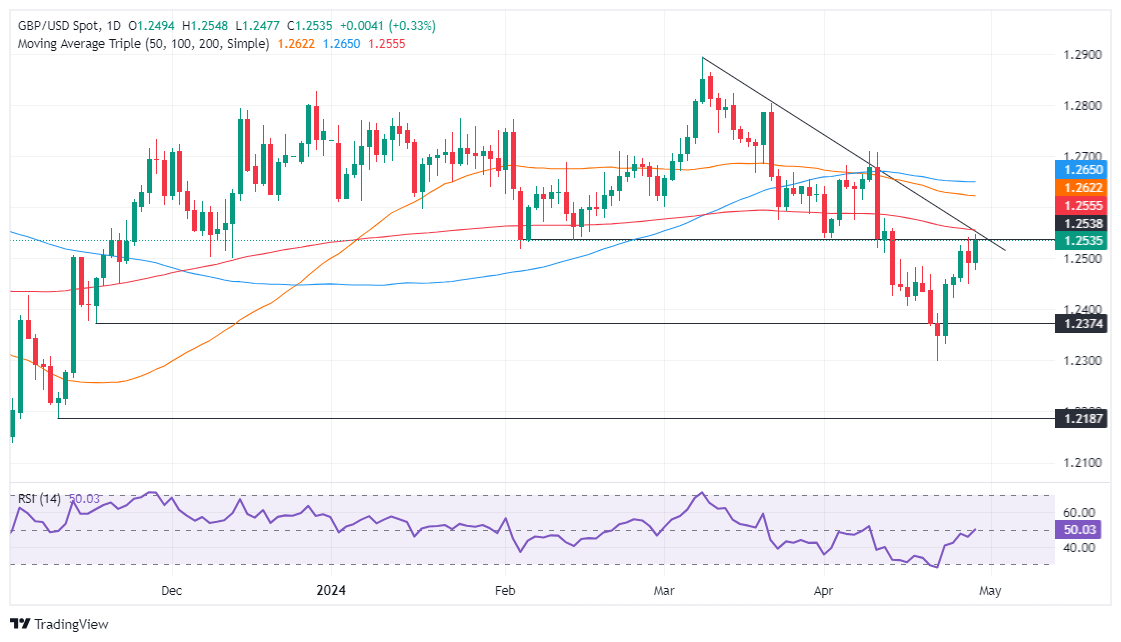
- Currently, GBP/USD tests the 200-day moving average at 1.2555, showing a neutral to slight bearish outlook.
- Breaking above the 200-DMA may target 1.2600, with potential further gains to 1.2621 and 1.2645.
- Failure to exceed the 200-DMA could prompt a retest of the 1.2500 support.
The Pound Sterling advanced sharply against the US Dollar in early trading during Monday’s North American session after hitting a daily low of 1.2474. Rumors of an intervention by Japanese authorities to propel the Japanese Yen (JPY) weighed on the Greenback, which is tumbling against most G8 FX currencies. Therefore, the GBP/USD trades at 1.2534, gaining 0.36%.
GBP/USD Price Analysis: Technical outlook
From a technical standpoint, the GBP/USD is neutral-biased, though tilted to the downside. It remains below the key 200-day moving average (DMA) at 1.2555, which delineates an asset's bullishness or bearishness. However, buyers are gathering momentum as the Relative Strength Index (RSI) punches above the 50-midline level.
With that context, if buyers achieve a daily close above the 200-DMA, that will expose the 1.2600 figure. Further upside is seen past the 50-DMA at 1.2621, followed by the 100-DMA at 1.2645. Once those levels are surpassed, the 1.2700 mark is up next.
Conversely, failure at the 200-DMA adds pressure on Sterling, which could drag the GBP/USD exchange rate beneath the 1.2500 mark. A breach of the latter will expose the April 24 low at 1.2422, followed by the April 22 low at 1.2299.
GBP/USD Price Action – Daily Chart


© 2000-2026. All rights reserved.
This site is managed by Teletrade D.J. LLC 2351 LLC 2022 (Euro House, Richmond Hill Road, Kingstown, VC0100, St. Vincent and the Grenadines).
The information on this website is for informational purposes only and does not constitute any investment advice.
The company does not serve or provide services to customers who are residents of the US, Canada, Iran, The Democratic People's Republic of Korea, Yemen and FATF blacklisted countries.
Making transactions on financial markets with marginal financial instruments opens up wide possibilities and allows investors who are willing to take risks to earn high profits, carrying a potentially high risk of losses at the same time. Therefore you should responsibly approach the issue of choosing the appropriate investment strategy, taking the available resources into account, before starting trading.
Use of the information: full or partial use of materials from this website must always be referenced to TeleTrade as the source of information. Use of the materials on the Internet must be accompanied by a hyperlink to teletrade.org. Automatic import of materials and information from this website is prohibited.
Please contact our PR department if you have any questions or need assistance at pr@teletrade.global.
transfers