- Analytics
- News and Tools
- Market News
- Silver Price Analysis: XAG/USD dips slightly, remains bullish above $27.00
Silver Price Analysis: XAG/USD dips slightly, remains bullish above $27.00
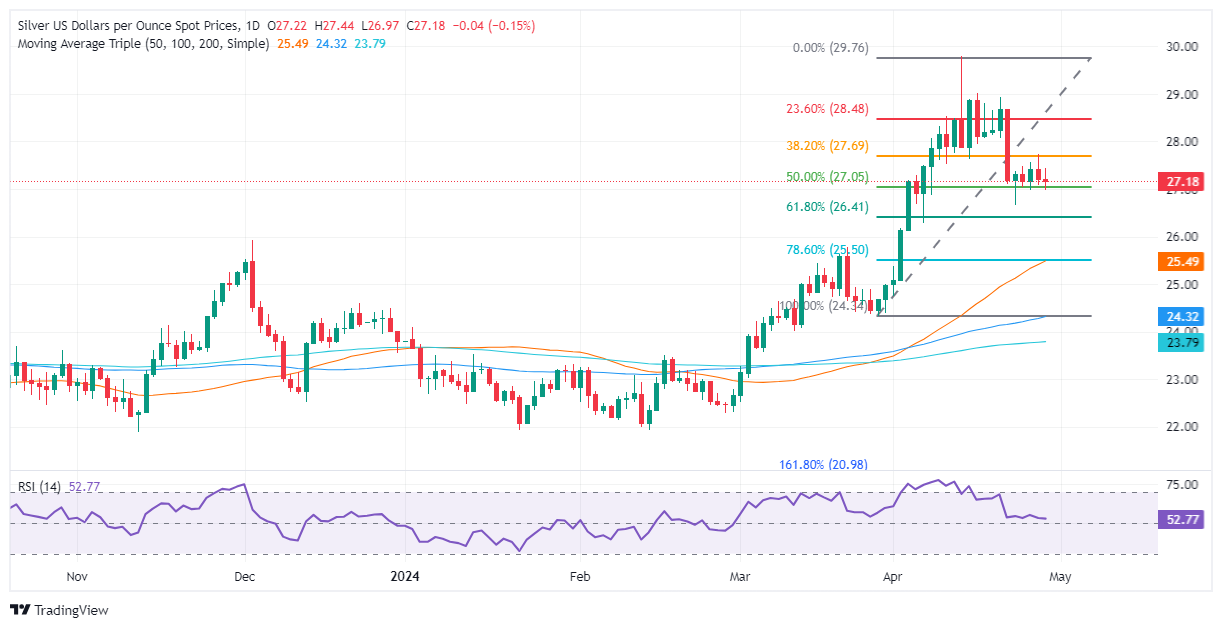
- Silver retreats from a high of $27.43 while interacting with key Fibonacci retracement levels.
- XAG/USD consolidates within the $27.05 to $27.70 Fibonacci range.
- A break above $27.70 could open the path to higher resistances at $28.00 and possibly extend towards the $29.00 mark and the annual high at $29.76.
- Should it fall below $27.05, Silver might target further supports at $26.41 and the crucial $25.50 level.
Silver's price edged down late during Monday’s North American session. It lost some 0.10% after reaching a daily high of $27.43 hit during the North American session. At the time of writing, XAG/USD trades at $27.12.
XAG/USD Price Analysis: Technical outlook
The XAG/USD daily chart suggests the grey metal is consolidating between 50% and 38.2% Fibonacci retracement, within the $27.05-$27.70 area of the Fib drawn from the swing low at $24.34 to the latest high at $29.76.
For a bullish continuation, traders need to reclaim the top of the abovementioned range at $27.70 so they can threaten to breach the $28.00 milestone. Once cleared, the next resistance would be the 23.6% Fib retracement at $28.48, followed by the $29.00 mark. The next supply area would be the year-to-date (YTD) high at $29.76.
On the flip side, bears could find some relief if XAG/USD slides below the 50% Fib retracement at $27.05, followed by the 61.8% retracement at $26.41. A subsequent dip is seen below that level, exposing the confluence of the 50-day moving average (DMA) and the 78.6% Fib retracement at $25.50.
XAG/USD Price Action – Daily Chart


© 2000-2026. All rights reserved.
This site is managed by Teletrade D.J. LLC 2351 LLC 2022 (Euro House, Richmond Hill Road, Kingstown, VC0100, St. Vincent and the Grenadines).
The information on this website is for informational purposes only and does not constitute any investment advice.
The company does not serve or provide services to customers who are residents of the US, Canada, Iran, The Democratic People's Republic of Korea, Yemen and FATF blacklisted countries.
Making transactions on financial markets with marginal financial instruments opens up wide possibilities and allows investors who are willing to take risks to earn high profits, carrying a potentially high risk of losses at the same time. Therefore you should responsibly approach the issue of choosing the appropriate investment strategy, taking the available resources into account, before starting trading.
Use of the information: full or partial use of materials from this website must always be referenced to TeleTrade as the source of information. Use of the materials on the Internet must be accompanied by a hyperlink to teletrade.org. Automatic import of materials and information from this website is prohibited.
Please contact our PR department if you have any questions or need assistance at pr@teletrade.global.
transfers