- Analytics
- News and Tools
- Market News
- USD/CAD Price Analysis: Hovers near 1.3700 within the ascending channel
USD/CAD Price Analysis: Hovers near 1.3700 within the ascending channel
- USD/CAD could gain ground as technical analysis indicates a recovery of bullish sentiment.
- A break above 1.3800 could lead the pair to revisit its five-month high of 1.3846.
- A breach below the channel’s lower boundary around 1.3630 could weaken the bullish sentiment.
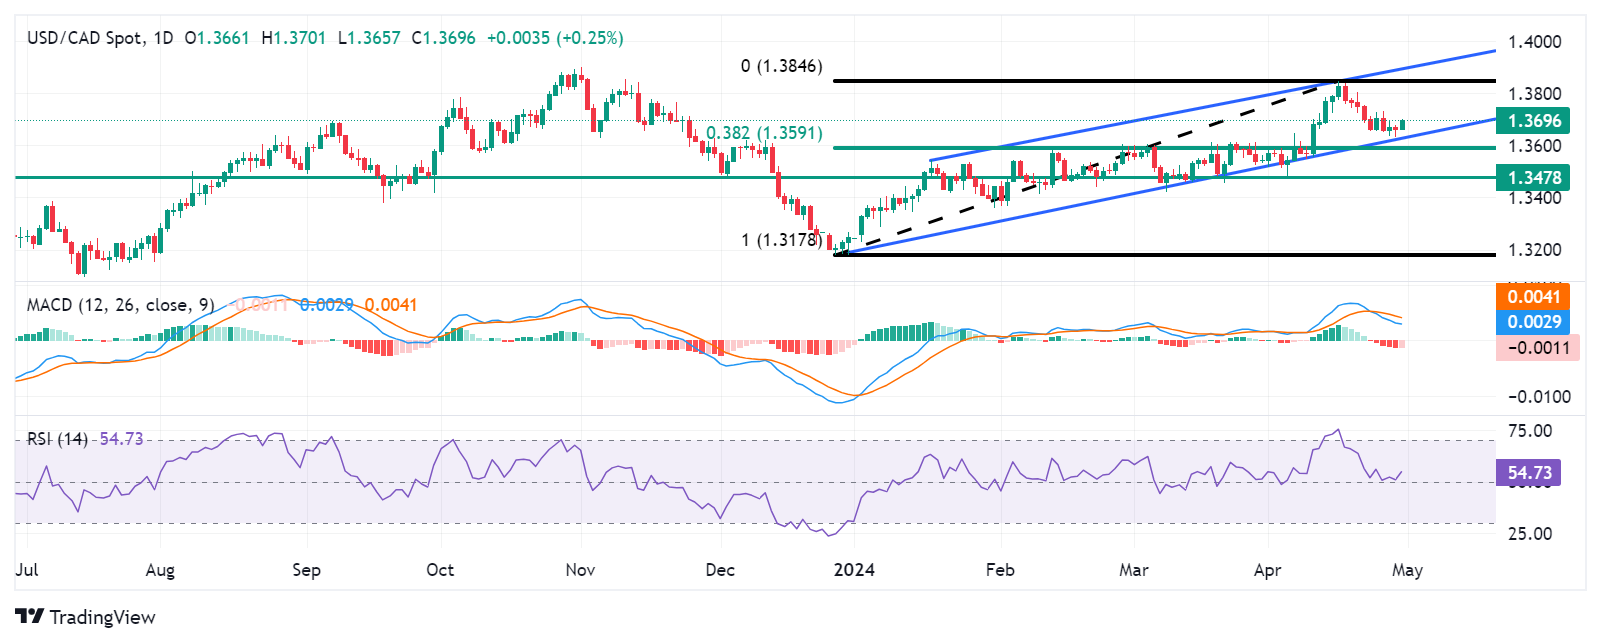
USD/CAD consolidates within the ascending channel on the daily chart, with the 14-day Relative Strength Index (RSI) positioned above 50, indicating a recovery of bullish sentiment. The pair edges higher to near 1.3700 during the European session on Tuesday.
Moreover, the Moving Average Convergence Divergence (MACD) line is above the centerline, signaling bullish momentum, although it remains below the signal line. Traders may look for confirmation from the MACD, a lagging indicator, to ascertain the direction of the trend.
The USD/CAD pair may encounter resistance near the psychological level of 1.3800. A breakthrough above this level could pave the way for the pair to revisit its five-month high of 1.3846, followed by the upper boundary of the ascending channel and the psychological barrier of 1.3900.
On the downside, the USD/CAD pair might test the lower boundary of the channel around the 1.3630 level. A breach below this level could exert downward pressure on the pair, leading it toward the region around the psychological support at 1.3600 and the 38.2% Fibonacci retracement level of 1.3591, plotted between the levels of 1.3178 and 1.3846.
The next significant support level lies at 1.3478, should the USD/CAD pair experience further depreciation, followed by December’s low at 1.3178.
USD/CAD: Daily Chart


© 2000-2026. All rights reserved.
This site is managed by Teletrade D.J. LLC 2351 LLC 2022 (Euro House, Richmond Hill Road, Kingstown, VC0100, St. Vincent and the Grenadines).
The information on this website is for informational purposes only and does not constitute any investment advice.
The company does not serve or provide services to customers who are residents of the US, Canada, Iran, The Democratic People's Republic of Korea, Yemen and FATF blacklisted countries.
Making transactions on financial markets with marginal financial instruments opens up wide possibilities and allows investors who are willing to take risks to earn high profits, carrying a potentially high risk of losses at the same time. Therefore you should responsibly approach the issue of choosing the appropriate investment strategy, taking the available resources into account, before starting trading.
Use of the information: full or partial use of materials from this website must always be referenced to TeleTrade as the source of information. Use of the materials on the Internet must be accompanied by a hyperlink to teletrade.org. Automatic import of materials and information from this website is prohibited.
Please contact our PR department if you have any questions or need assistance at pr@teletrade.global.
transfers