- Analytics
- News and Tools
- Market News
- NZD/JPY Price Analysis: Buyers step back to consolidate, sellers gain ground
NZD/JPY Price Analysis: Buyers step back to consolidate, sellers gain ground
- The daily RSI for the NZD/JPY shows a decreasing trend, hinting at a growing bearish bias.
- On the hourly chart, both RSI and MACD reflect a growing bearish tendency, supporting the daily chart's sentiment.
- Any movements that leave the pair above its 20-day SMA won’t challenge the bullish outlook.
The NZD/JPY pair is down by 0.45% on Tuesday, trading at 92.99. Despite some bearish undertones, the NZD/JPY maintains a long-term bullish trend above its principal Simple Moving Averages (SMAs). There is potential for short-term momentum shifts, as investors are stepping back to take profits after propelling the pair to highs since 2015 on Monday.
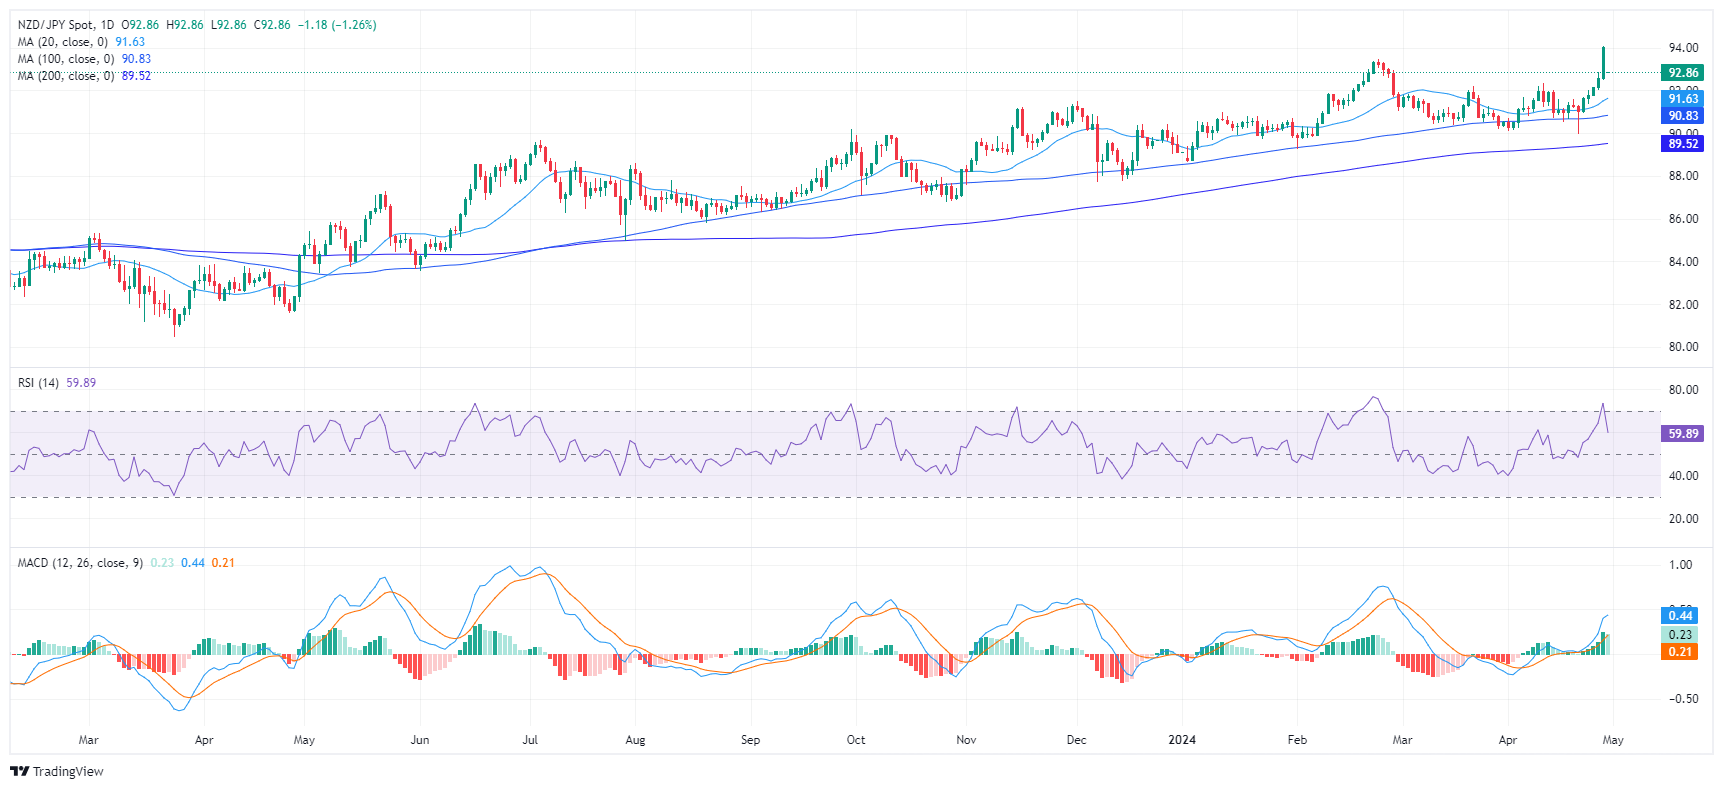
On the daily chart, the Relative Strength Index (RSI) for NZD/JPY has decreased over the previous sessions. The index moved from overbought terrain to below 70 indicating a possible reversal or slowdown in the buyer’s traction.
NZD/JPY daily chart
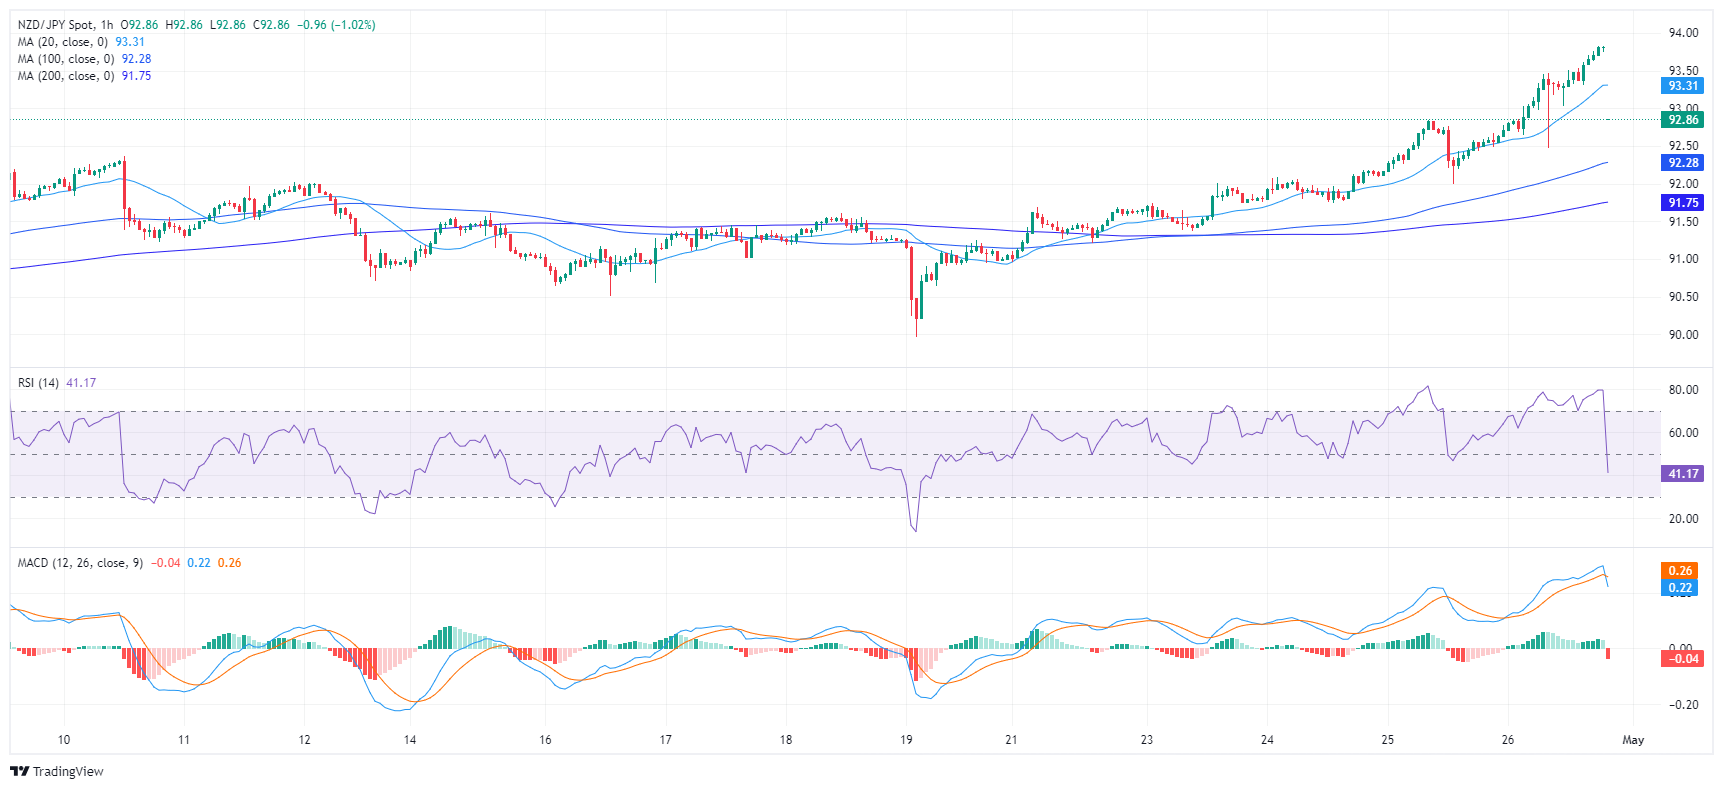
Moving to an intraday basis, the hourly chart presents a similar scenario. The RSI plunged into negative territory. Simultaneously, the Moving Average Convergence Divergence (MACD) printed a red bars signaling a rising negative momentum. This indicates that investors continued taking profits on Tuesday and that the sellers commanded the trades during the session.
NZD/JPY hourly chart
From a broader perspective, NZD/JPY remains bullish despite the downside as it remains above its Simple Moving Averages (SMA) of 20,100, and 200-day periods. However, if the bears manage to gather additional momentum they might reclaim the 20-day SMA which may worsen the outlook for the pair in case of being lost.


© 2000-2026. All rights reserved.
This site is managed by Teletrade D.J. LLC 2351 LLC 2022 (Euro House, Richmond Hill Road, Kingstown, VC0100, St. Vincent and the Grenadines).
The information on this website is for informational purposes only and does not constitute any investment advice.
The company does not serve or provide services to customers who are residents of the US, Canada, Iran, The Democratic People's Republic of Korea, Yemen and FATF blacklisted countries.
Making transactions on financial markets with marginal financial instruments opens up wide possibilities and allows investors who are willing to take risks to earn high profits, carrying a potentially high risk of losses at the same time. Therefore you should responsibly approach the issue of choosing the appropriate investment strategy, taking the available resources into account, before starting trading.
Use of the information: full or partial use of materials from this website must always be referenced to TeleTrade as the source of information. Use of the materials on the Internet must be accompanied by a hyperlink to teletrade.org. Automatic import of materials and information from this website is prohibited.
Please contact our PR department if you have any questions or need assistance at pr@teletrade.global.
transfers