- Analytics
- News and Tools
- Market News
- NZD/USD Price Analysis: Bears reign supreme, bulls nowhere to be found
NZD/USD Price Analysis: Bears reign supreme, bulls nowhere to be found
- The daily indicators of the NZD/USD daily chart confirm a steady bearish momentum.
- Hourly indicators signal oversold conditions which could lead to a mild upwards correction.
- The failure to regain the 20-day SMA worsens the outlook of the buyers.
The NZD/USD pair plunged to 0.5890 on Tuesday as bears hit the gas and bulls seem to have given up their momentum gained in the last session. Selling conditions are more extreme in the hourly charts as indicators signal oversold conditions which could lead to an upwards correction in the near tearm.
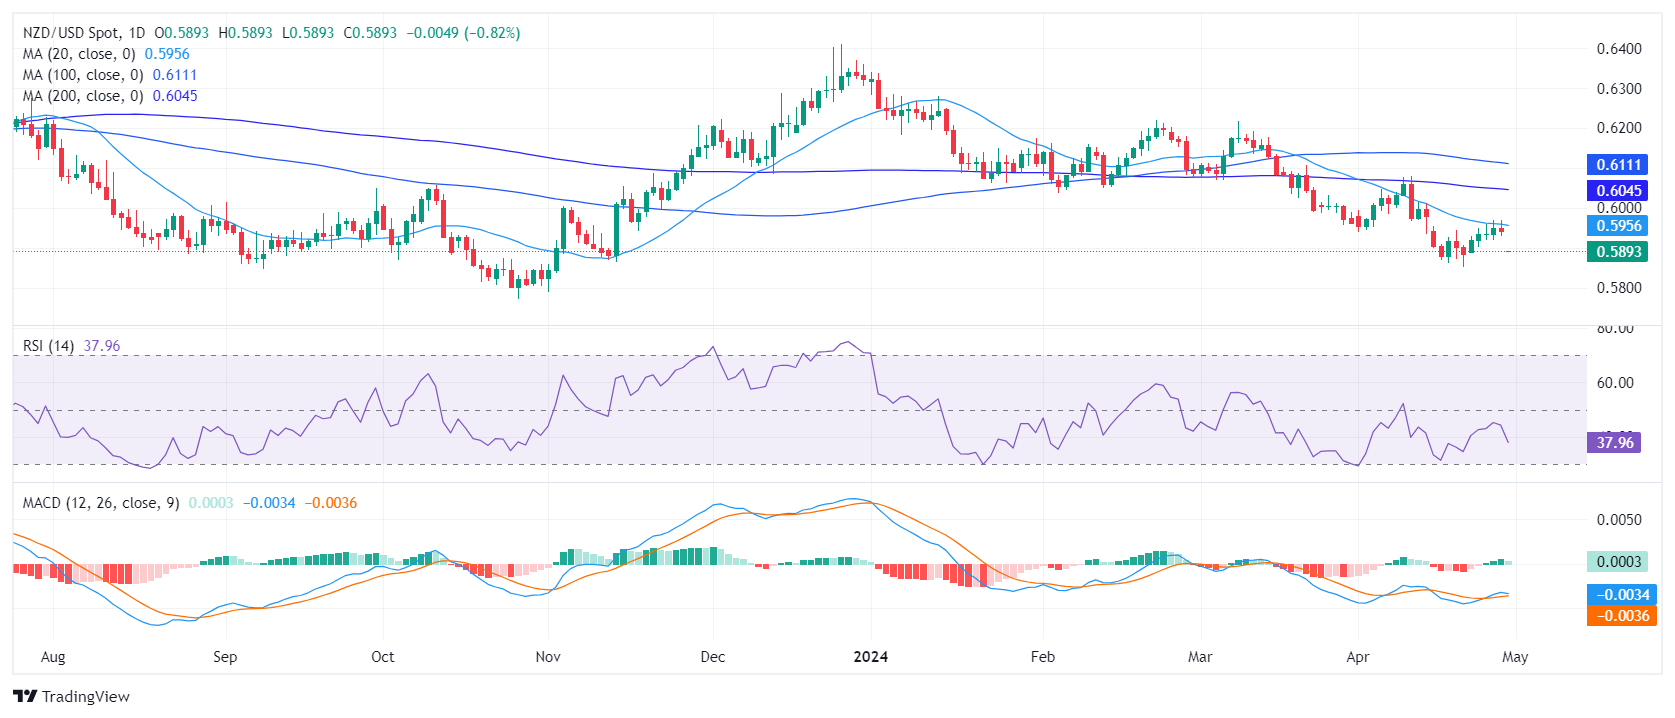
The daily Relative Strength Index (RSI) for the NZD/USD is in the negative territory. The most recent reading signals sellers are currently dominating the market, with a downward trend. Regarding the Moving Average Convergence Divergence (MACD), the decreasing green bars confirm this bearish momentum with the bullish impulse nowhere to be found.
NZD/USD daily chart
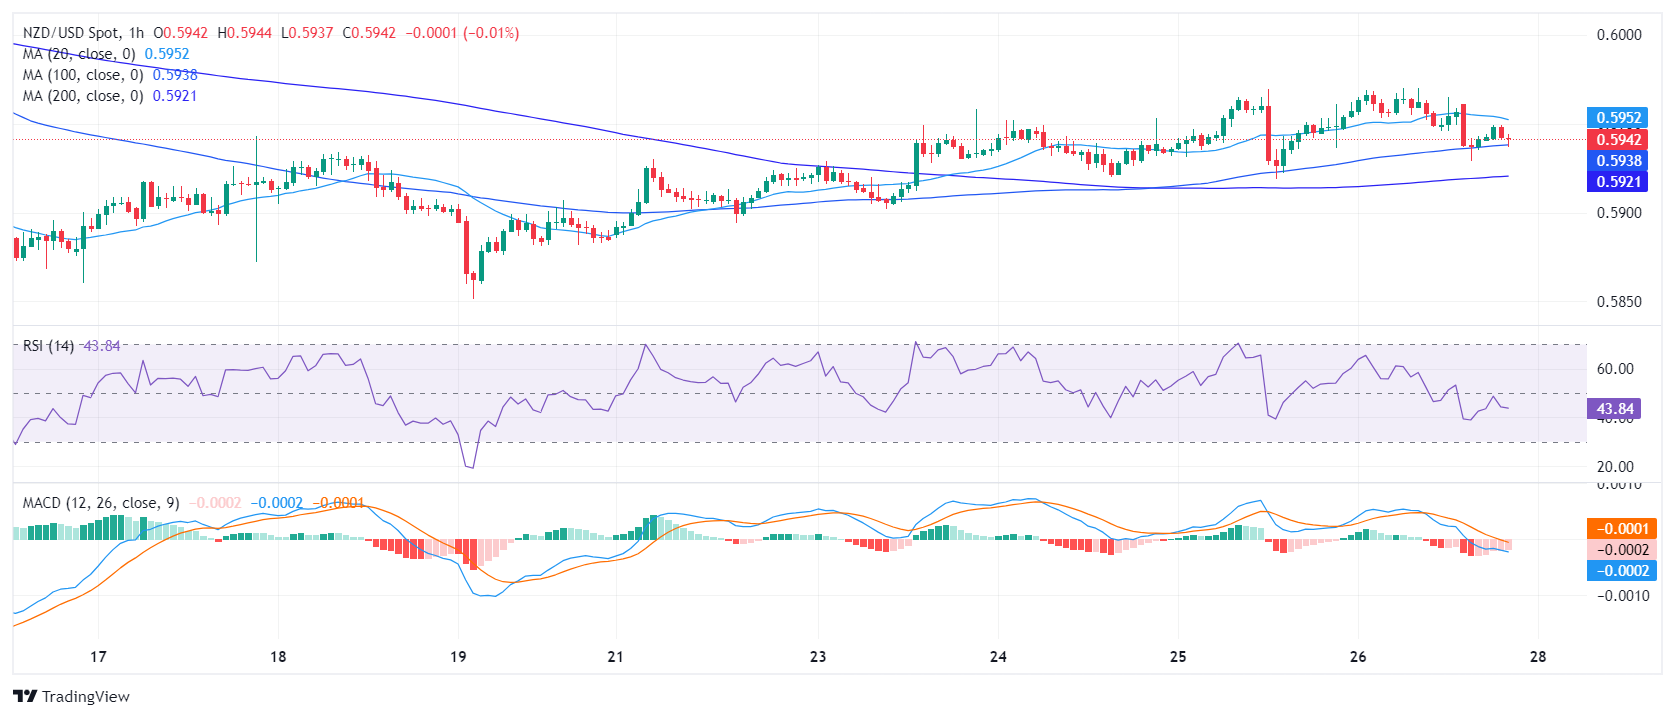
On the hourly chart, the RSI shows stronger oversold conditions in the most recent hours. However, the hourly MACD, indicated by flat red bars on the histogram, shows a flattening bearish momentum. Notably, despite the oversold condition, buyers have not yet stepped in with enough strength to shift the momentum toward the green zone but they might in the next hours.
NZD/USD hourly chart
Regarding the larger scope, the NZD/USD displays a bearish trend, evidenced by its position below the Simple Moving Averages (SMA) for the 20, 100, and 200-day periods. After getting rejected by the 20-day SMA multiple times in the last sessions, the outlook is confirmed to be bearish as the time of the buyers seems to be fading. In addition, after failing to conquer that crucial resistance, leaves the pair bound for additional downside. However, ahead of the Asian session, there could be a minor upward correction to consolidate the overextended downward movements seen on the hourly chart.


© 2000-2026. All rights reserved.
This site is managed by Teletrade D.J. LLC 2351 LLC 2022 (Euro House, Richmond Hill Road, Kingstown, VC0100, St. Vincent and the Grenadines).
The information on this website is for informational purposes only and does not constitute any investment advice.
The company does not serve or provide services to customers who are residents of the US, Canada, Iran, The Democratic People's Republic of Korea, Yemen and FATF blacklisted countries.
Making transactions on financial markets with marginal financial instruments opens up wide possibilities and allows investors who are willing to take risks to earn high profits, carrying a potentially high risk of losses at the same time. Therefore you should responsibly approach the issue of choosing the appropriate investment strategy, taking the available resources into account, before starting trading.
Use of the information: full or partial use of materials from this website must always be referenced to TeleTrade as the source of information. Use of the materials on the Internet must be accompanied by a hyperlink to teletrade.org. Automatic import of materials and information from this website is prohibited.
Please contact our PR department if you have any questions or need assistance at pr@teletrade.global.
transfers