- Analytics
- News and Tools
- Market News
- GBP/USD Price Analysis: Tumbles below crucial 1.2500 as bears move in
GBP/USD Price Analysis: Tumbles below crucial 1.2500 as bears move in
- GBP/USD drops 0.30%, US Dollar rises on positive US trade and labor data.
- The GBP/USD struggles below 200-DMA at 1.2550, trending down.
- RSI indicates bearish momentum; sellers control the market.
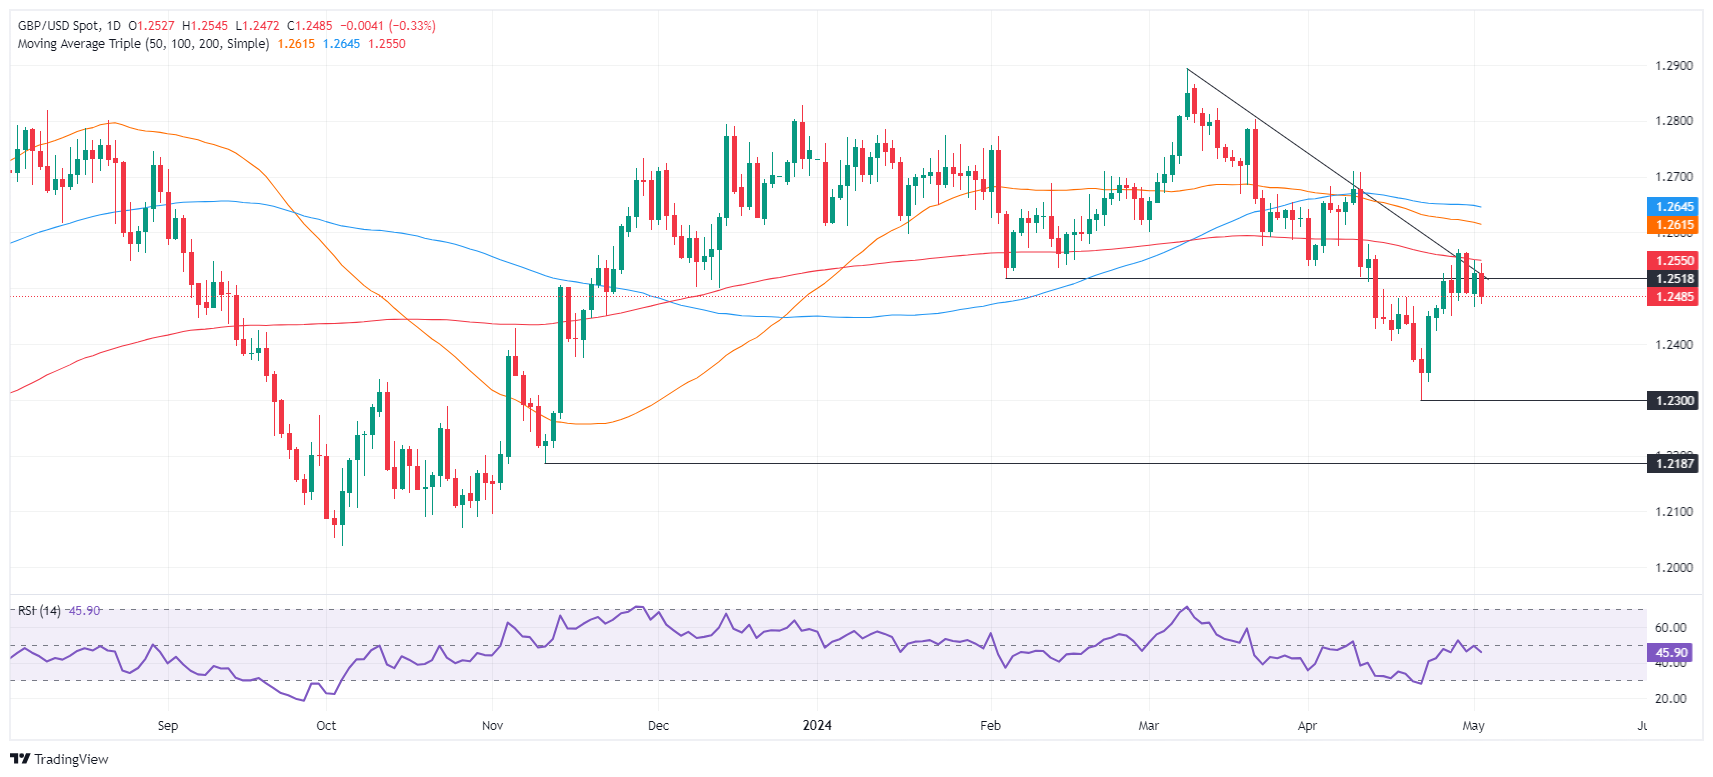
- Recovery above 1.2500 could retest 200-DMA, with resistance at 1.2569 and 50-DMA at 1.2613.
The Pound Sterling tumbled in early trading during the North American session, dropping below the 1.2500 figure amid renewed US Dollar strength. Data from the United States showed that the Balance of Trade deficit tightened while the labor market remained tight, as revealed by the Initial Jobless Claims report. The GBP/USD trades at 1.2488, down 0.30%.
GBP/USD Price Analysis: Technical outlook
From a technical standpoint, the GBP/USD is showing a neutral to downward bias. This is a result of buyers failing to breach the significant resistance at the 200-day moving average (DMA) at 1.2550. This failure has further intensified the major’s drop below the 1.2500 figure, potentially paving the way for a test of the latest cycle low seen at 1.2299, the April 22 low.
Momentum points to a continuation of the downtrend, as the Relative Strength Index (RSI) turned bearish on April 30. As of writing, it aims downward, meaning sellers remain in charge.
On the other hand, if buyers reclaim 1.2500, they must reclaim the 200-DMA ahead of testing the April 29 high at 1.2569. Once cleared, the next stop would be the 1.2600 mark, followed by the 50-DMA at 1.2613. Further gains are seen above the 100-DMA at 1.2644.
GBP/USD Price Action – Daily Chart


© 2000-2026. All rights reserved.
This site is managed by Teletrade D.J. LLC 2351 LLC 2022 (Euro House, Richmond Hill Road, Kingstown, VC0100, St. Vincent and the Grenadines).
The information on this website is for informational purposes only and does not constitute any investment advice.
The company does not serve or provide services to customers who are residents of the US, Canada, Iran, The Democratic People's Republic of Korea, Yemen and FATF blacklisted countries.
Making transactions on financial markets with marginal financial instruments opens up wide possibilities and allows investors who are willing to take risks to earn high profits, carrying a potentially high risk of losses at the same time. Therefore you should responsibly approach the issue of choosing the appropriate investment strategy, taking the available resources into account, before starting trading.
Use of the information: full or partial use of materials from this website must always be referenced to TeleTrade as the source of information. Use of the materials on the Internet must be accompanied by a hyperlink to teletrade.org. Automatic import of materials and information from this website is prohibited.
Please contact our PR department if you have any questions or need assistance at pr@teletrade.global.
transfers