- Analytics
- News and Tools
- Market News
- NZD/USD Price Analysis: Short-term uptrend hinted, buyers might take some profits
NZD/USD Price Analysis: Short-term uptrend hinted, buyers might take some profits
- The daily RSI shows minor buying traction, further validation is needed.
- The hourly chart reveals growing buying momentum with RSI hitting overbought terrain.
- Buyers finally recovered the 20-day SMA, which brightens the outlook for the short term.
The NZD/USD rose to 0.5961, displaying a rally of 0.56% and jumping above the key short-term 20-day Simple Moving Average (SMA) on Thursday which now indicates a potential bullish bias. However, the broader trend remains bearish. With the intense increase in buying traction on an hourly scale, buyers might take some profits ahead of the Asian session.
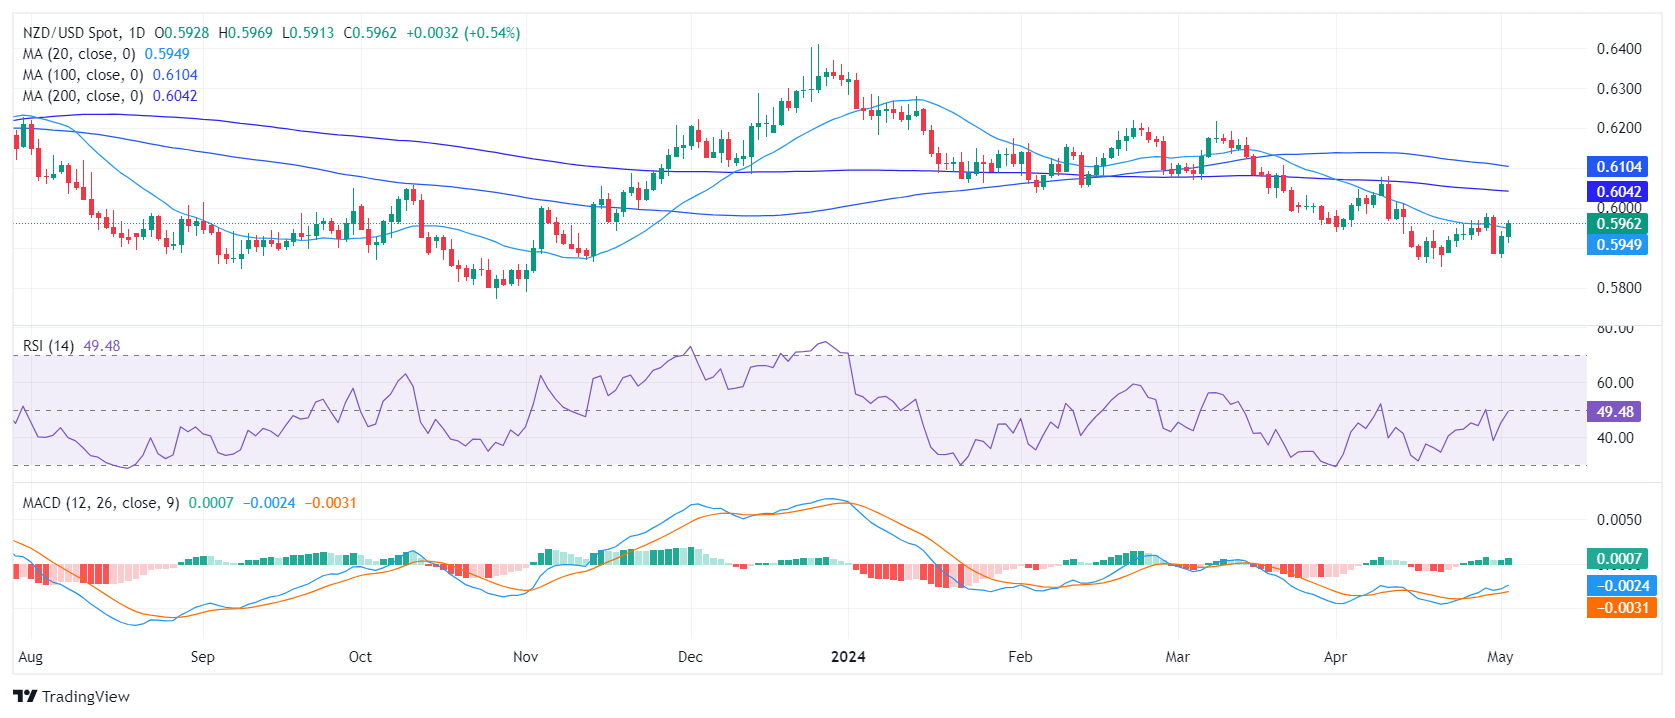
On the daily chart, the Relative Strength Index (RSI) stands just above negative territory threshold, hinting at a slight uptrend. However, this inconclusive signal requires further validation to be considered a bullish flag.
NZD/USD daily chart
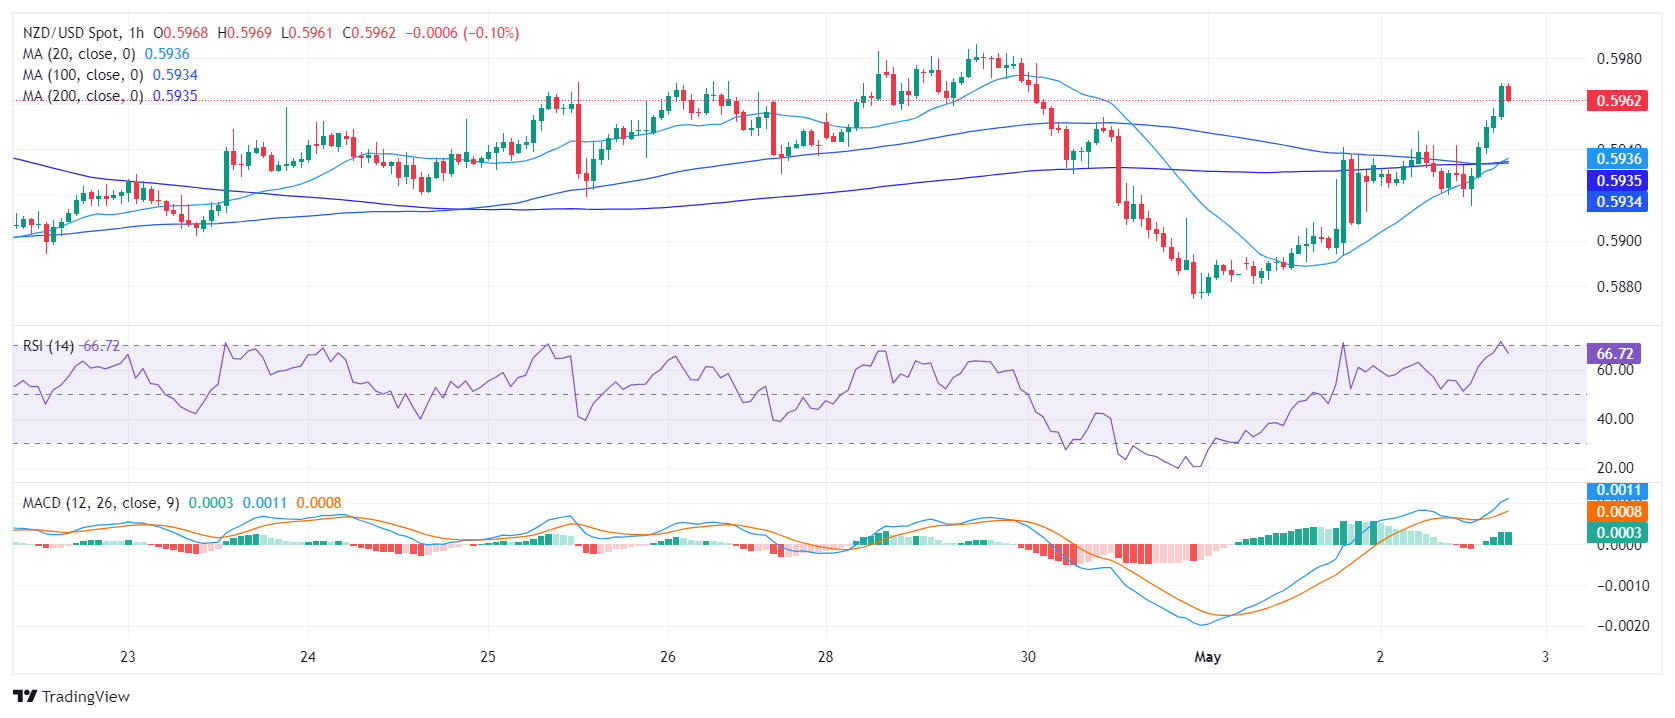
On the hourly chart, the RSI is at 66 slightly down after hitting the overbought threshold. This indicates a stronger short-term buying momentum but that the pair may start to consolidate ahead of Friday’s session. Furthermore, the Moving Average Convergence Divergence (MACD) presents green bars, showing positive momentum.
NZD/USD hourly chart
Considering broader market movements, the NZD/USD’s jump above the 20-day Simple Moving Average (SMA), signify a potential short-term upward trend. However, the pair still lingers below the 100 and 200-day SMA, implying sustained selling pressure and a bearish market bias long-term. That being said, bulls are making arguments to be considered seriously and will start to set their sight at the 100-day SMA at 0.6100.


© 2000-2026. All rights reserved.
This site is managed by Teletrade D.J. LLC 2351 LLC 2022 (Euro House, Richmond Hill Road, Kingstown, VC0100, St. Vincent and the Grenadines).
The information on this website is for informational purposes only and does not constitute any investment advice.
The company does not serve or provide services to customers who are residents of the US, Canada, Iran, The Democratic People's Republic of Korea, Yemen and FATF blacklisted countries.
Making transactions on financial markets with marginal financial instruments opens up wide possibilities and allows investors who are willing to take risks to earn high profits, carrying a potentially high risk of losses at the same time. Therefore you should responsibly approach the issue of choosing the appropriate investment strategy, taking the available resources into account, before starting trading.
Use of the information: full or partial use of materials from this website must always be referenced to TeleTrade as the source of information. Use of the materials on the Internet must be accompanied by a hyperlink to teletrade.org. Automatic import of materials and information from this website is prohibited.
Please contact our PR department if you have any questions or need assistance at pr@teletrade.global.
transfers