- Analytics
- News and Tools
- Market News
- NZD/USD Price Analysis: Bearish momentum escalates, buyers struggle to hold ground
NZD/USD Price Analysis: Bearish momentum escalates, buyers struggle to hold ground
- The NZD/USD exhibits a bearish trend with growing selling pressure, accentuated by the stiff resistance at the 0.6040 level.
- Indicators are flattening on the daily chart as bulls are running out of steam.
The NZD/USD stands at 0.6005 seeing mild losses in Tuesday’s session. Market movements highlight strong bearish momentum following consecutive losing sessions. The overall trend reveals strengthening selling pressure, with the NZD/USD facing considerable resistance at the 0.6040-50 level. This suggests a potential continuation of the downward trend as sellers assert their market dominance and bulls struggle to gain further ground.
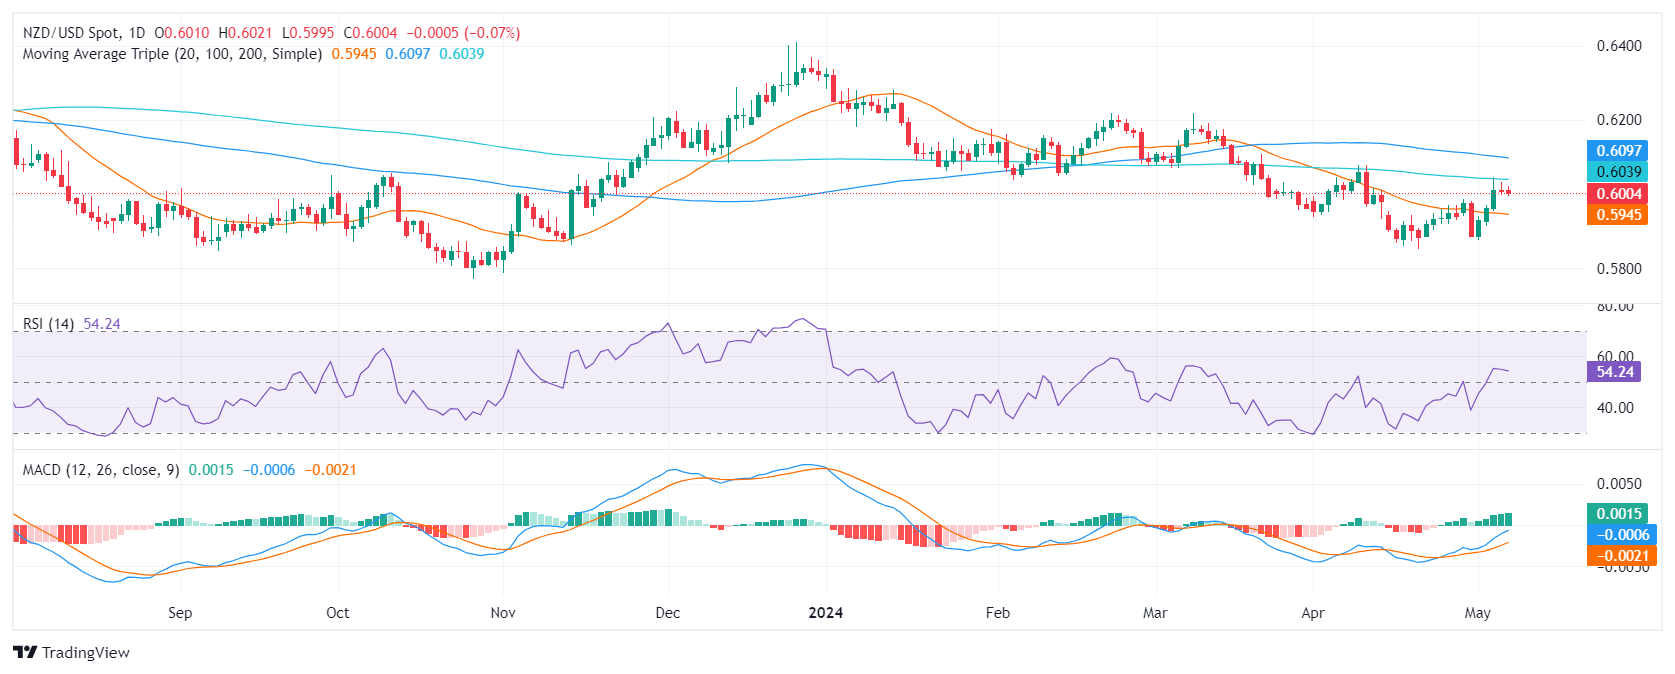
On the daily chart, the Relative Strength Index (RSI) for NZD/USD exhibits a recovery trend shifting from negative to positive territory. This trajectory indicates a gradual increase in buying interest but seems to have flattened. However, the Moving Average Convergence Divergence (MACD) histogram remains flat, reflecting stabilized momentum that does not favor either buyers or sellers dominantly.
NZD/USD daily chart
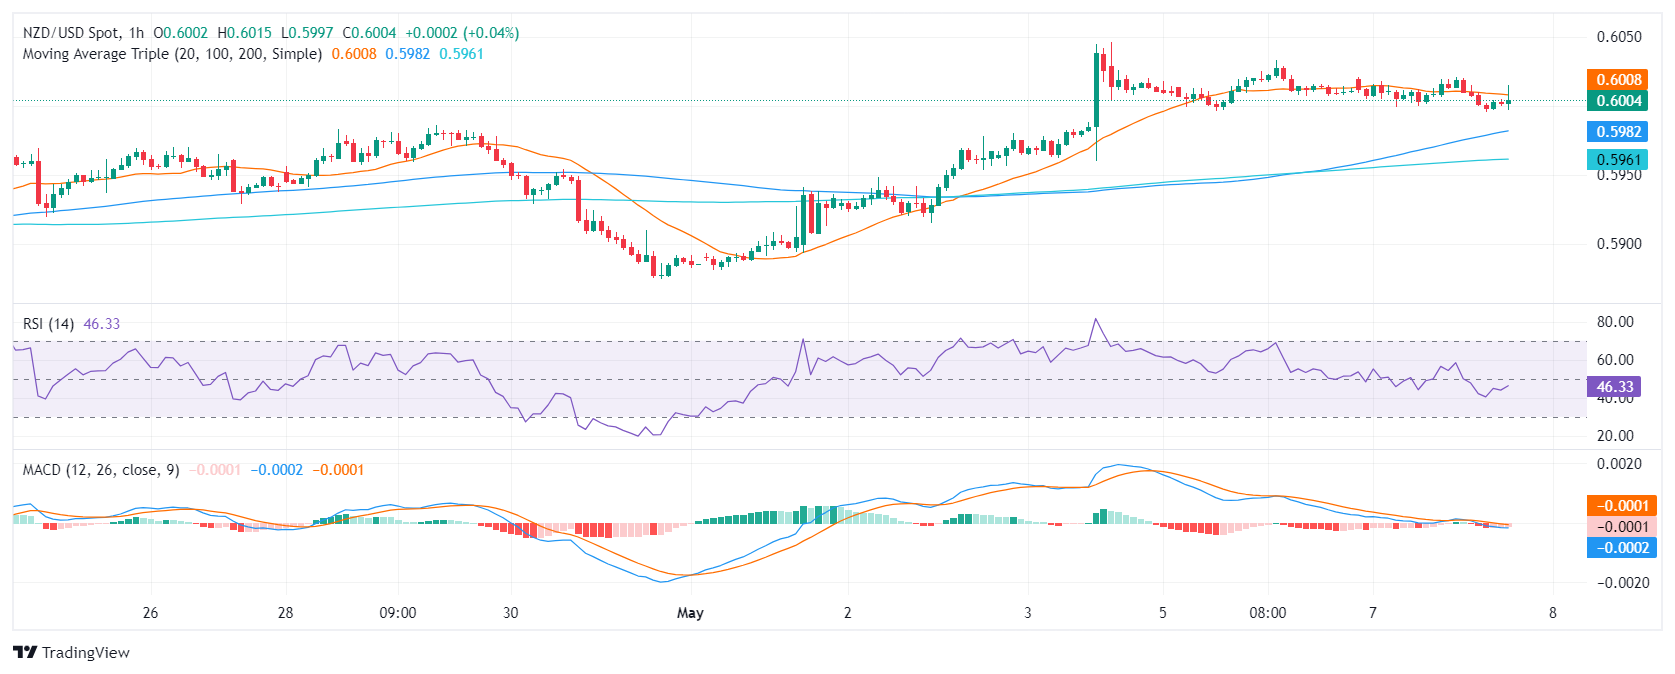
Shifting attention to the hourly chart, the NZD/USD pair presents a different narrative. The RSI flutters around in negative territory, showing sellers have a short-term advantage. Notably, the hourly MACD histogram presents flat red bars indicative of negative momentum persisting throughout the session.
NZD/USD hourly chart
In the grand scope, the mounting seller dominance is underscored by the NZD/USD's struggle to pierce the 200-day Simple Moving Average (SMA) at the 0.6040 level. This signifies a crucial resistance point for the pair. If the inability to break through persists, it could certainly reinforce the bearish trajectory in the next sessions. However, as long as the bulls hold above the 20-day SMA, the short-term outlook will remain tilted with some green.


© 2000-2026. All rights reserved.
This site is managed by Teletrade D.J. LLC 2351 LLC 2022 (Euro House, Richmond Hill Road, Kingstown, VC0100, St. Vincent and the Grenadines).
The information on this website is for informational purposes only and does not constitute any investment advice.
The company does not serve or provide services to customers who are residents of the US, Canada, Iran, The Democratic People's Republic of Korea, Yemen and FATF blacklisted countries.
Making transactions on financial markets with marginal financial instruments opens up wide possibilities and allows investors who are willing to take risks to earn high profits, carrying a potentially high risk of losses at the same time. Therefore you should responsibly approach the issue of choosing the appropriate investment strategy, taking the available resources into account, before starting trading.
Use of the information: full or partial use of materials from this website must always be referenced to TeleTrade as the source of information. Use of the materials on the Internet must be accompanied by a hyperlink to teletrade.org. Automatic import of materials and information from this website is prohibited.
Please contact our PR department if you have any questions or need assistance at pr@teletrade.global.
transfers