- Analytics
- News and Tools
- Market News
- EUR/JPY Price Analysis: Bulls maintain the reign and step over the bears
EUR/JPY Price Analysis: Bulls maintain the reign and step over the bears
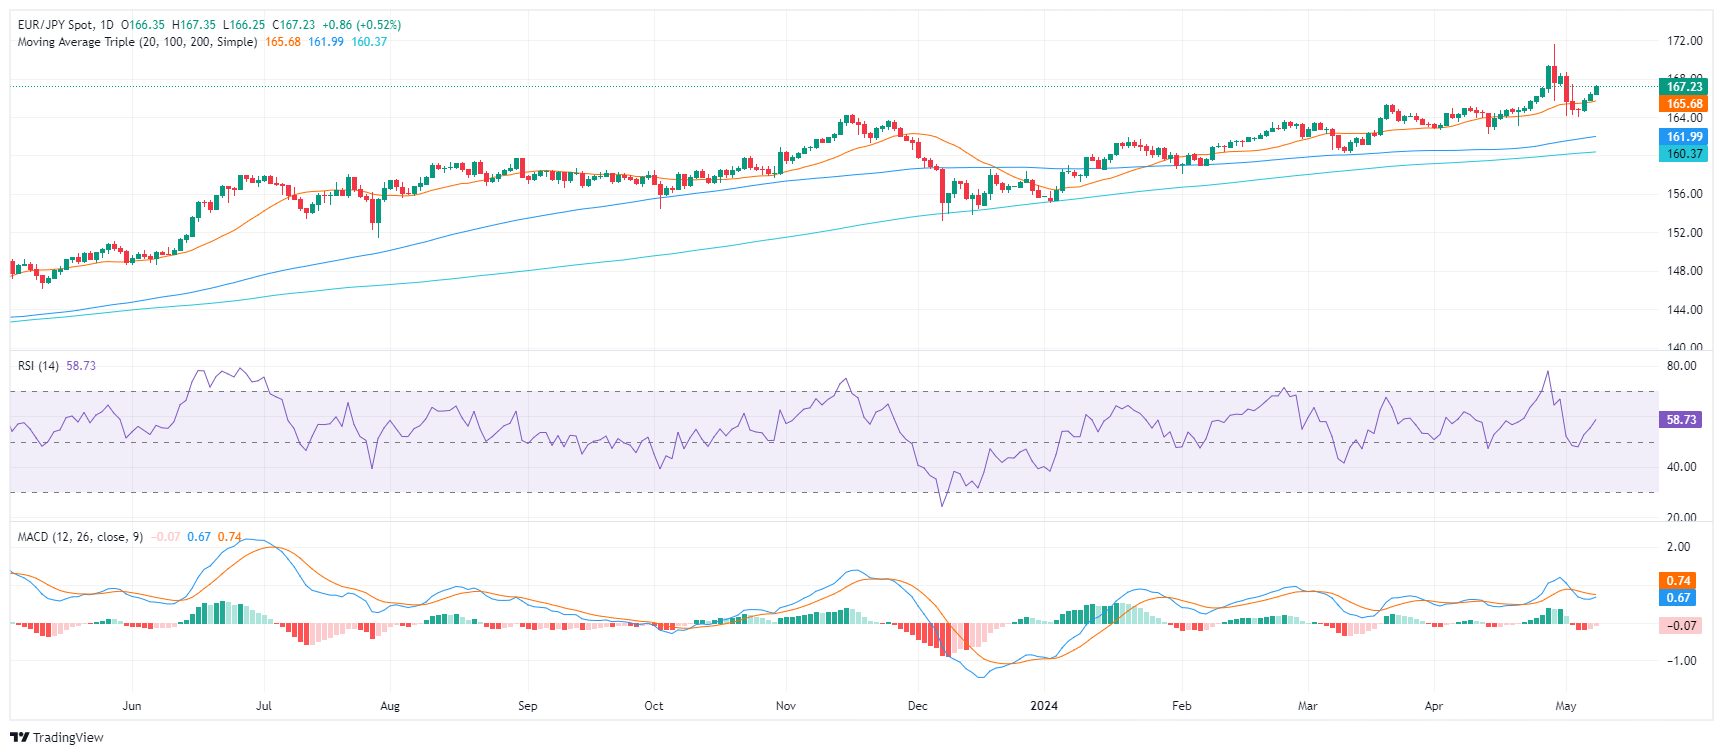
- Indicators on the daily chart show a consistent rise in bullish momentum.
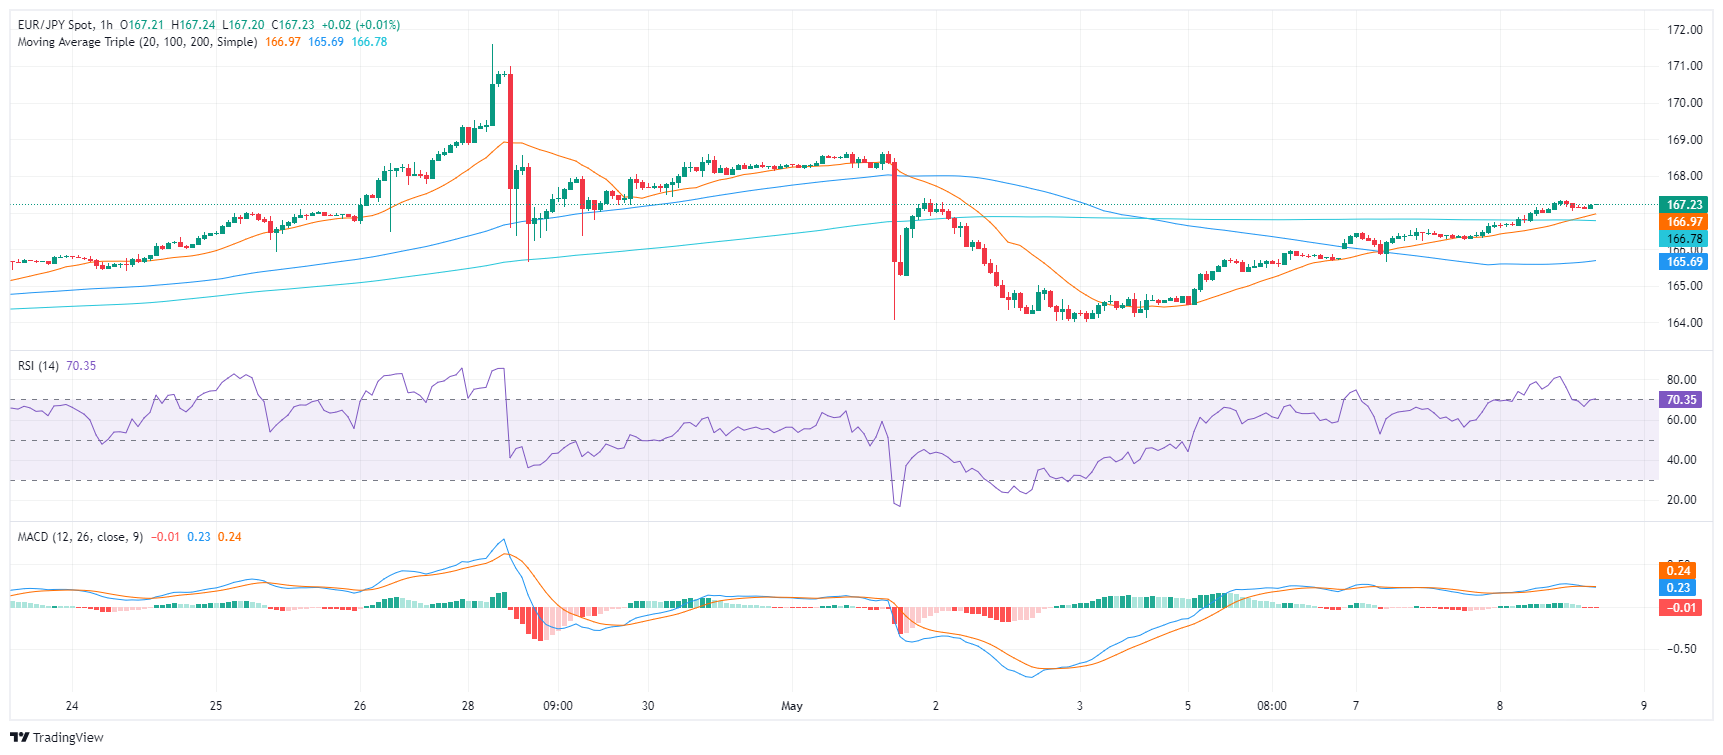
- On the hourly chart, the RSI reflects a more volatile picture with general positivity, yet the MACD shows a lack of sustained buying traction.
The EUR/JPY pair continues to exhibit strong momentum, displaying gains of 0.55% on Wednesday. With buyers maintaining dominance, the pair remains steadfast above its key Simple Moving Averages (SMAs) in both the short and long term, indicating the potential for a further upward move. The latest downward movements may have been only corrective as bears lacked the conviction to hold the pair below the 20-day SMA and buyers recovered ground.
On the daily chart, the Relative Strength Index (RSI) reveals a positive trend. The most recent value of 58 suggests that buyers have been dominating the market while the Moving Average Convergence Divergence (MACD) histogram shows green bars, indicating a consistent rise in positive momentum.
EUR/JPY daily chart
Shifting the focus to the hourly RSI, a more volatile picture is displayed. Values have fluctuated, generally remaining positive, with the latest reading at 69 near the overbought terrain. Whereas, the hourly MACD has registered flat red bars, indicating a lack of positive momentum in recent hours as investors seems to be taking profits.
EUR/JPY hourly chart
Reflecting on the broad spectrum, the EUR/JPY is currently positioned above its Simple Moving Average (SMA) across the 20, 100, and 200-days. This indicates a strong upward momentum in both the short-term and long-term periods.
In conclusion, the daily and hourly technical indicators and a notable position above the SMA suggest an overall bullish outlook for the pair. However, the contrast in the hourly MACD with the daily trends urges traders to exercise caution as buyers may take their foot off the gas ahead of the Asian session which would pave the way for some downside.


© 2000-2026. All rights reserved.
This site is managed by Teletrade D.J. LLC 2351 LLC 2022 (Euro House, Richmond Hill Road, Kingstown, VC0100, St. Vincent and the Grenadines).
The information on this website is for informational purposes only and does not constitute any investment advice.
The company does not serve or provide services to customers who are residents of the US, Canada, Iran, The Democratic People's Republic of Korea, Yemen and FATF blacklisted countries.
Making transactions on financial markets with marginal financial instruments opens up wide possibilities and allows investors who are willing to take risks to earn high profits, carrying a potentially high risk of losses at the same time. Therefore you should responsibly approach the issue of choosing the appropriate investment strategy, taking the available resources into account, before starting trading.
Use of the information: full or partial use of materials from this website must always be referenced to TeleTrade as the source of information. Use of the materials on the Internet must be accompanied by a hyperlink to teletrade.org. Automatic import of materials and information from this website is prohibited.
Please contact our PR department if you have any questions or need assistance at pr@teletrade.global.
transfers