- Analytics
- News and Tools
- Market News
- NZD/USD Price Analysis: Bulls stuck at 0.6000 as momentum lightens
NZD/USD Price Analysis: Bulls stuck at 0.6000 as momentum lightens
- Indicators on the daily chart shows decelerating bullish momentum.
- The RSI on the hourly chart indicates fluctuating buying and selling pressures, despite its position in the positive zone.
- For bulls to avoid losses, they must defend the key 20-day SMA.
The NZD/USD pair maintains a strong bearish bias despite recent upward movements as buyers seem to have stalled at around 0.6000 and struggle to gain further ground while momentum wanes.
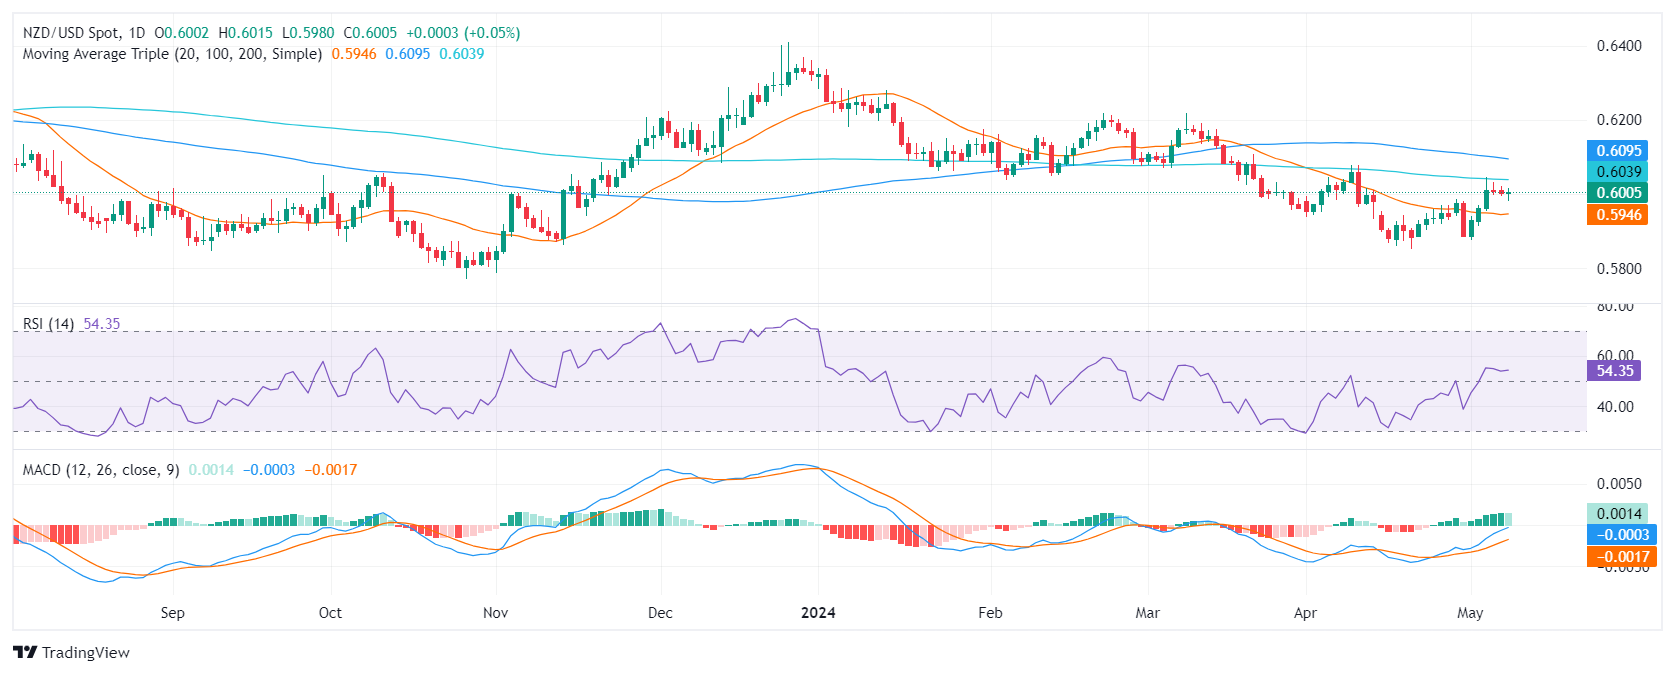
On the daily chart, technical indicators suggest a decelerating positive momentum for the pair while the prevailing downtrend persists. The Relative Strength Index (RSI) shows a positive trend after a slow ascend from the oversold region. However, the Moving Average Convergence Divergence (MACD) histogram reveals a transition towards diminishing green bars, indicating a decelerating bullish momentum.
NZD/USD daily chart
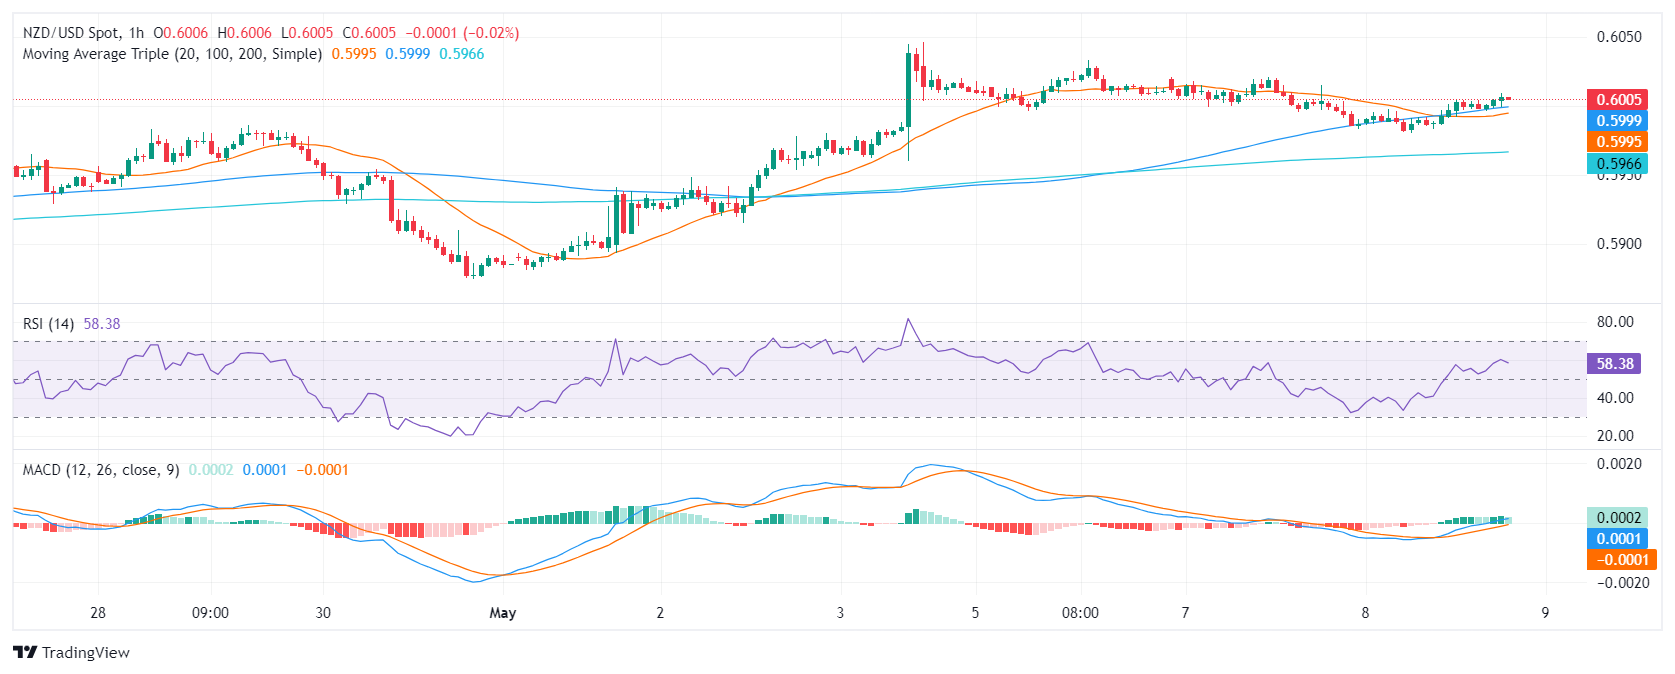
Contrastingly, the hourly RSI sits at 54. Although this is still in the positive territory, it is marginally edging lower. The past few hours have witnessed noticeable fluctuations, signaling varied buying and selling pressures. The hourly chart's MACD registers a decrease in green bars, implying receding positive momentum.
NZD/USD hourly chart
Broadening the perspective further reveals that the NZD/USD is caught in a downtrend as it lies beneath the 100 and 200-day Simple Moving Averages (SMA). That being said, its position above the 20-day average still gives some light to the bulls as it hints at a short-term positive outlook. In summary, the technical indicators of the NZD/USD pair suggest a slowing positive momentum on both the daily and hourly charts, while the prevailing downtrend continues.


© 2000-2026. All rights reserved.
This site is managed by Teletrade D.J. LLC 2351 LLC 2022 (Euro House, Richmond Hill Road, Kingstown, VC0100, St. Vincent and the Grenadines).
The information on this website is for informational purposes only and does not constitute any investment advice.
The company does not serve or provide services to customers who are residents of the US, Canada, Iran, The Democratic People's Republic of Korea, Yemen and FATF blacklisted countries.
Making transactions on financial markets with marginal financial instruments opens up wide possibilities and allows investors who are willing to take risks to earn high profits, carrying a potentially high risk of losses at the same time. Therefore you should responsibly approach the issue of choosing the appropriate investment strategy, taking the available resources into account, before starting trading.
Use of the information: full or partial use of materials from this website must always be referenced to TeleTrade as the source of information. Use of the materials on the Internet must be accompanied by a hyperlink to teletrade.org. Automatic import of materials and information from this website is prohibited.
Please contact our PR department if you have any questions or need assistance at pr@teletrade.global.
transfers