- Analytics
- News and Tools
- Market News
- NZD/USD Price Analysis: Buyers gather momentum and challenge the 200-day SMA
NZD/USD Price Analysis: Buyers gather momentum and challenge the 200-day SMA
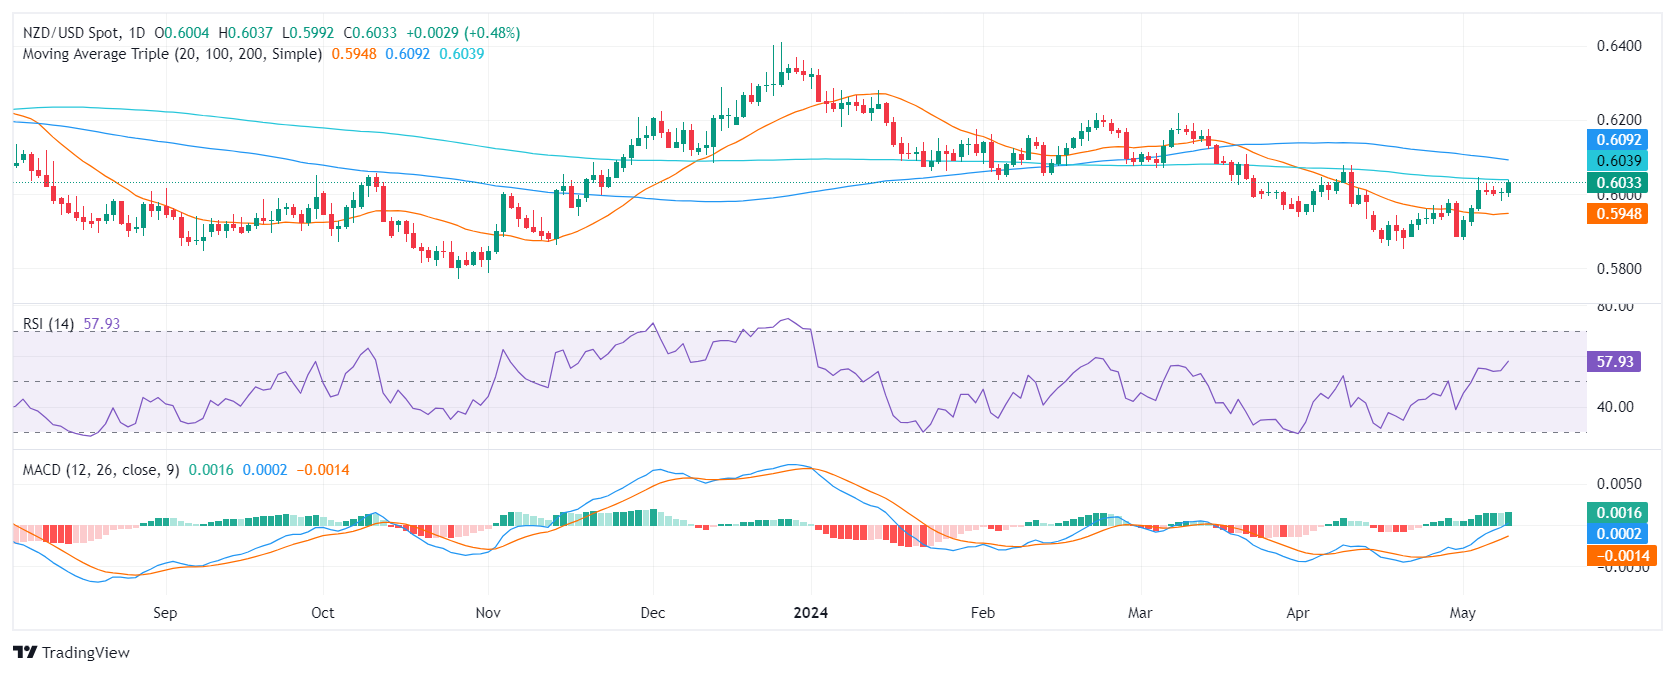
- The daily RSI for the NZD/USD reveals strong buying momentum, underpinned by rising MACD green bars.
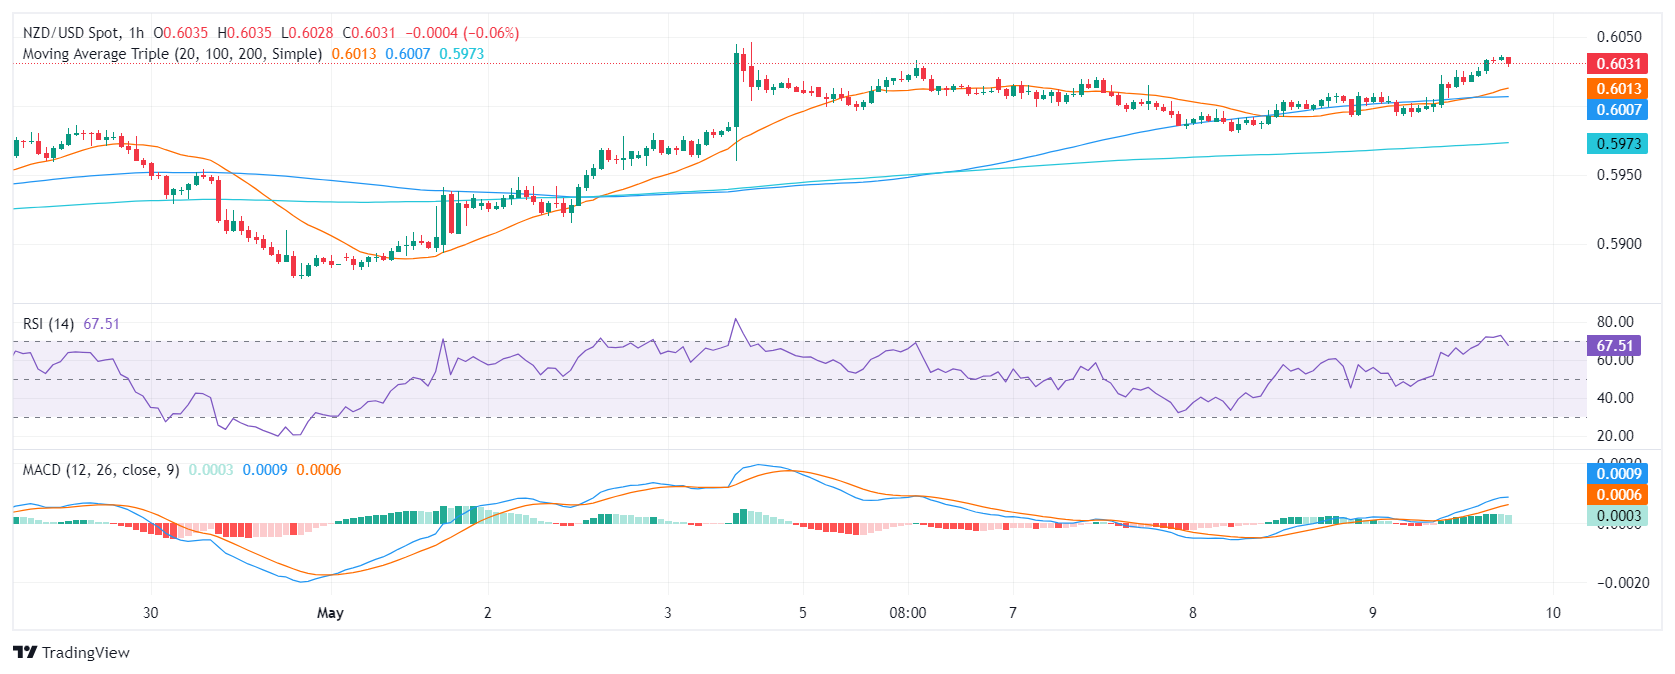
- Despite slightly weakening green bars on the hourly MACD, the RSI indicates steadfast buying traction near 70.
- If buyers regain the 200-day SMA, the outlook will turn positive for the pair.
The NZD/USD pair is showcasing a strong performance, rising to 0.6032 on Thursday. Despite this, an observed stagnation in hourly advances warrants attention for any short-term shift as indicators reach overbought conditions and buyers might take profits.
On the daily chart, the Relative Strength Index (RSI) shows positive momentum. Its latest reading is in positive territory. This, along with the rising green bars of the Moving Average Convergence Divergence (MACD), indicates a market predominately dominated by buyers.
NZD/USD daily chart
Turning attention to the hourly chart, the RSI still indicates strong buyer domination, hovering around 66. However, the MACD shows decreasing green bars, which could indicate slightly weaker bullish momentum compared to the daily chart. Traders shouldn’t take off the table a slight technical correction ahead of the Asian session.
NZD/USD hourly chart
Regarding the Simple Moving Averages (SMA) the pair holds above the 20-day SMA but remains below the 100 and 200-day. However, buyers are anticipated to challenge the 200-day SMA at the critical level of 0.6040 which if surpassed, could usher in stronger bullish prospects for the NZD/USD. On the contrary, sellers might step in again if the pair lacks the strength to reconquer the mentioned resistance.


© 2000-2026. All rights reserved.
This site is managed by Teletrade D.J. LLC 2351 LLC 2022 (Euro House, Richmond Hill Road, Kingstown, VC0100, St. Vincent and the Grenadines).
The information on this website is for informational purposes only and does not constitute any investment advice.
The company does not serve or provide services to customers who are residents of the US, Canada, Iran, The Democratic People's Republic of Korea, Yemen and FATF blacklisted countries.
Making transactions on financial markets with marginal financial instruments opens up wide possibilities and allows investors who are willing to take risks to earn high profits, carrying a potentially high risk of losses at the same time. Therefore you should responsibly approach the issue of choosing the appropriate investment strategy, taking the available resources into account, before starting trading.
Use of the information: full or partial use of materials from this website must always be referenced to TeleTrade as the source of information. Use of the materials on the Internet must be accompanied by a hyperlink to teletrade.org. Automatic import of materials and information from this website is prohibited.
Please contact our PR department if you have any questions or need assistance at pr@teletrade.global.
transfers