- Analytics
- News and Tools
- Market News
- EUR/USD Price Analysis: The crucial resistance level will emerge at the 1.0790–1.0800 region
EUR/USD Price Analysis: The crucial resistance level will emerge at the 1.0790–1.0800 region
- EUR/USD weakens to 1.0775 on the firmer USD on Friday.
- The pair keeps the bearish vibe below the key EMA on the daily timeframe.
- The key resistance level will emerge in the 1.0790–1.0800 zone; the first downside target is located at 1.0724.
The EUR/USD pair trades on a softer note near 1.0775 during the early European hours on Friday. The downtick of the major pair is supported by the renewed US Dollar (USD) demand amid hawkish comments from Federal Reserve (Fed) officials. Later on Friday, the US Michigan Consumer Sentiment Index for May will be released, which is projected to drop from 77.2 in April to 76.0 in May.
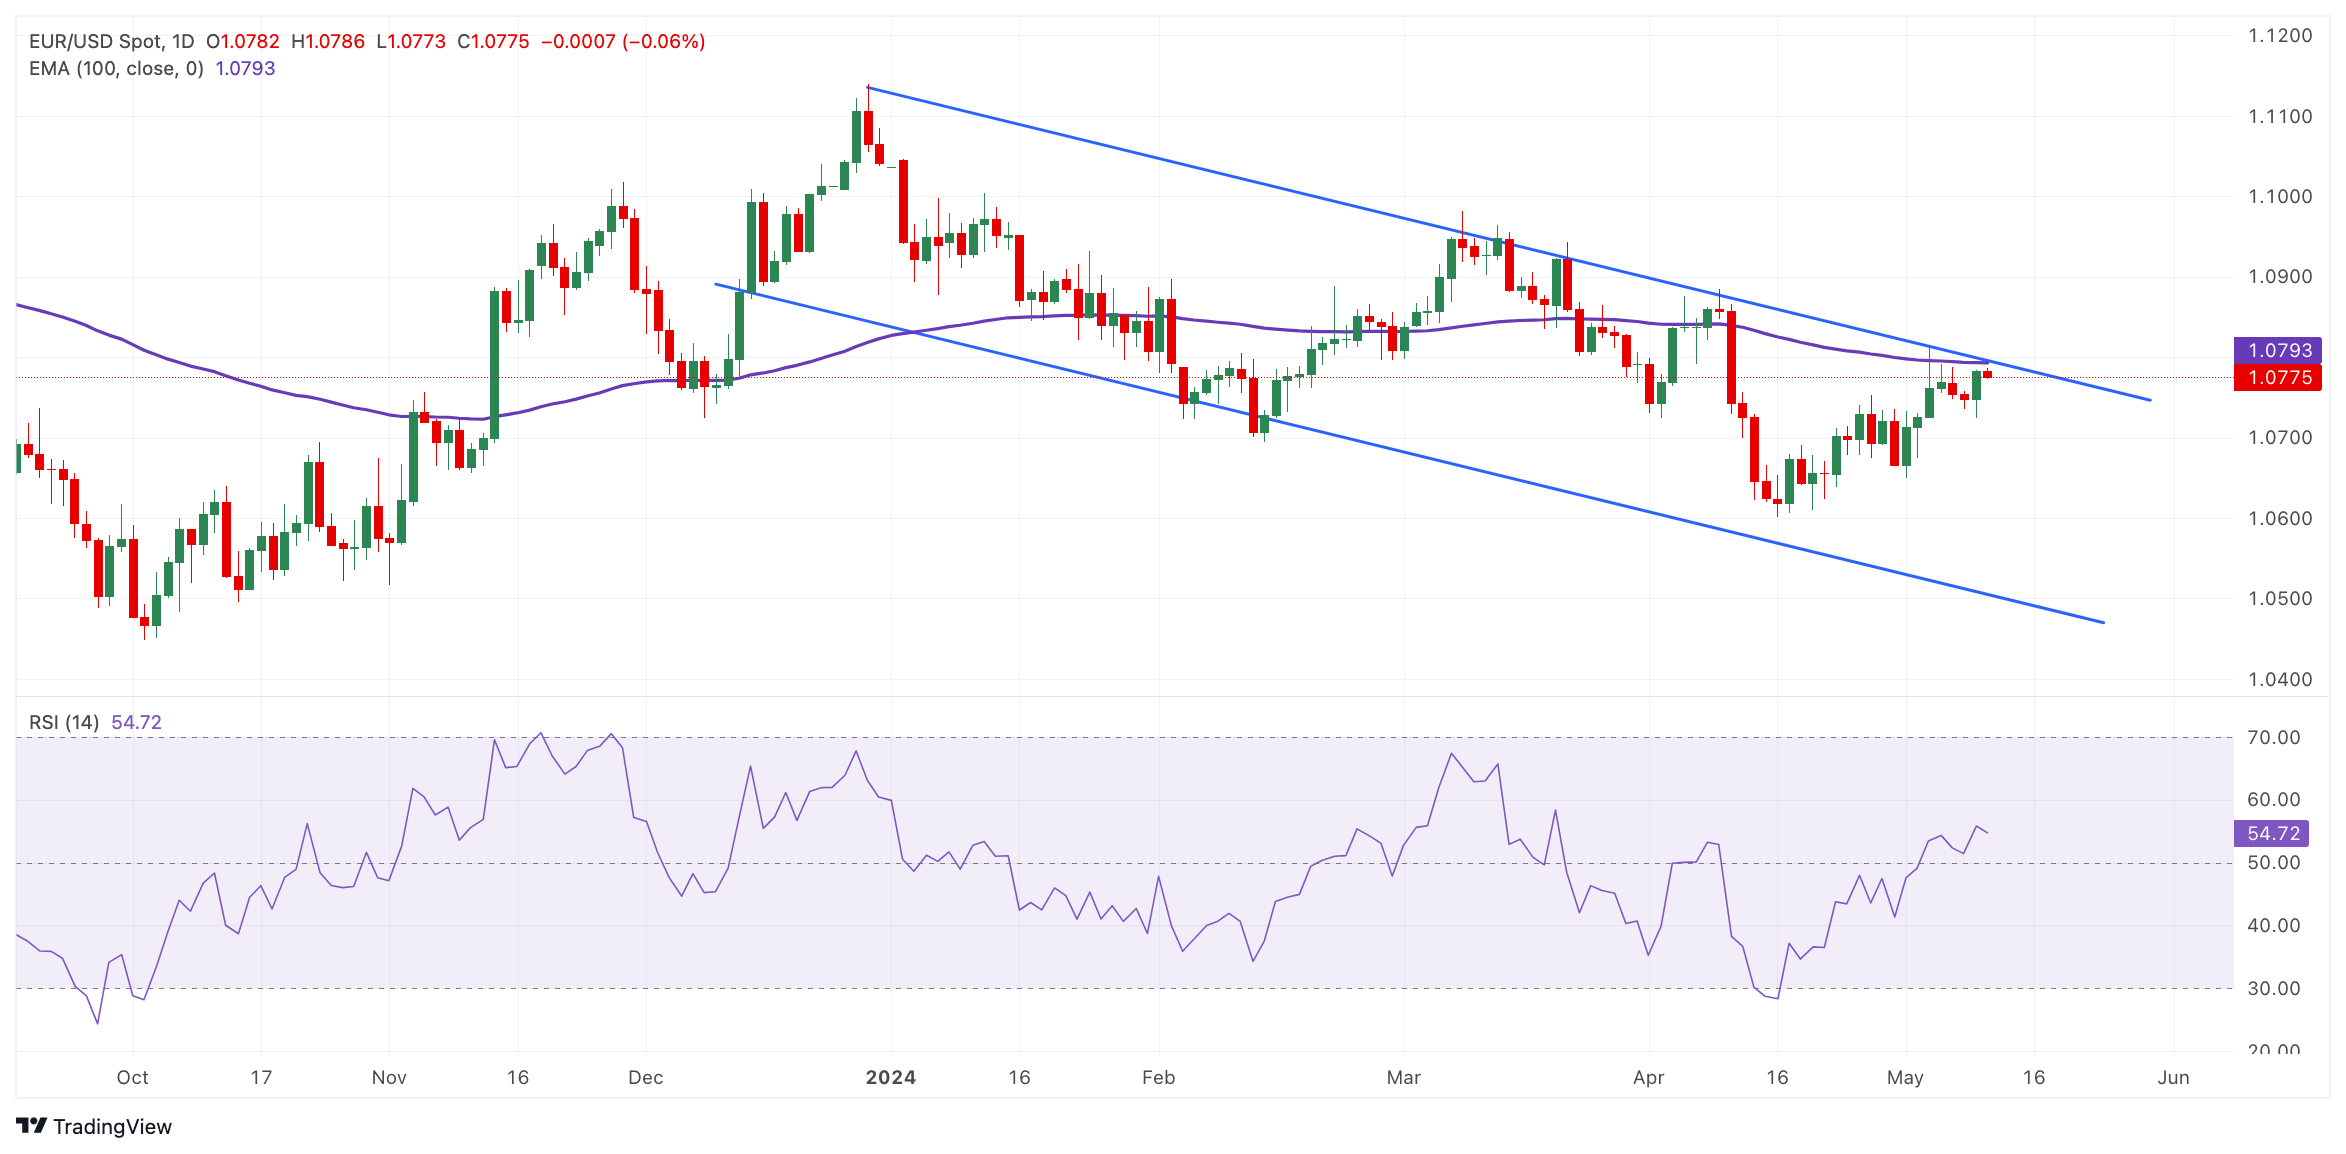
According to the daily chart, EUR/USD has traded within a descending trend channel since mid-December 2023. The bearish outlook of the major pair remains intact, as it is below the key 100-period Exponential Moving Average (EMA). However, the 14-day Relative Strength Index (RSI) stands in bullish territory around 55, indicating that further upside cannot be ruled out.
The key resistance level for EUR/USD will emerge at the 1.0790–1.0800 region, portraying the 100-day EMA and the upper boundary of the descending trend channel. The next upside barrier is seen near a high of April 9 at 1.0885. The additional upside filter to watch is a high of March 21 at 1.0943, followed by March 8 at 1.0981, and finally the 1.1000 psychological level.
On the downside, the first downside target is located near a low of May 9 at 1.0724. Extended losses for EUR/USD expose the pair to a low of May 2 at 1.0650, en route to a low of April 16 at 1.0600. A break below this level will see a drop to the lower limit of the descending trend channel at 1.0500.
EUR/USD daily chart


© 2000-2026. All rights reserved.
This site is managed by Teletrade D.J. LLC 2351 LLC 2022 (Euro House, Richmond Hill Road, Kingstown, VC0100, St. Vincent and the Grenadines).
The information on this website is for informational purposes only and does not constitute any investment advice.
The company does not serve or provide services to customers who are residents of the US, Canada, Iran, The Democratic People's Republic of Korea, Yemen and FATF blacklisted countries.
Making transactions on financial markets with marginal financial instruments opens up wide possibilities and allows investors who are willing to take risks to earn high profits, carrying a potentially high risk of losses at the same time. Therefore you should responsibly approach the issue of choosing the appropriate investment strategy, taking the available resources into account, before starting trading.
Use of the information: full or partial use of materials from this website must always be referenced to TeleTrade as the source of information. Use of the materials on the Internet must be accompanied by a hyperlink to teletrade.org. Automatic import of materials and information from this website is prohibited.
Please contact our PR department if you have any questions or need assistance at pr@teletrade.global.
transfers