- Analytics
- News and Tools
- Market News
- Silver Price Forecast: XAG/USD faces pressure near $32.70 with US NFP in focus
Silver Price Forecast: XAG/USD faces pressure near $32.70 with US NFP in focus
- Silver price struggles around $32.70 ahead of the US NFP data for February.
- The US employment data will influence market speculation for the Fed’s monetary policy outlook.
- The Silver price remains supported by global trade war tensions.
Silver price (XAG/USD) faces selling pressure near $32.70 in European trading hours on Friday. The white metal trades cautiously ahead of the United States (US) Nonfarm Payrolls (NFP) data for February, which will be published at 13:30 GMT.
The US NFP data will significantly influence market expectations for the Federal Reserve’s (Fed) monetary policy outlook. Upbeat labor market data would boost market speculation that the Fed will keep interest rates steady in the current range of 4.25%-4.50% for longer. On the contrary, soft numbers would weaken them.
Technically, a restrictive interest rate stance from the Fed bodes poorly for precious metals, such as Silver.
The US NFP report is expected to show that the employers hired 160K workers, higher than 143K recorded in January. The Unemployment Rate is seen steady at 4%. Investors will also focus on the Average Hourly Earnings data, a key measure of wage growth, which is estimated to have grown steadily by 4.1% year-on-year.
Ahead of the US NFP data, the US Dollar Index (DXY), which tracks the Greenback’s value against six major currencies, posts a fresh four-month low near 103.60. 10-year US Treasury yields drops to near 4.27%.
Meanwhile, global trade war tensions continue to offer support to the Silver price. On Thursday, US President Donald Trump confirmed tariff exemptions on products compliant with the United States-Mexico-Canada Agreement (USMCA) till April 2. Trump imposed 25% tariffs on imports from Canada and Mexico on Tuesday.
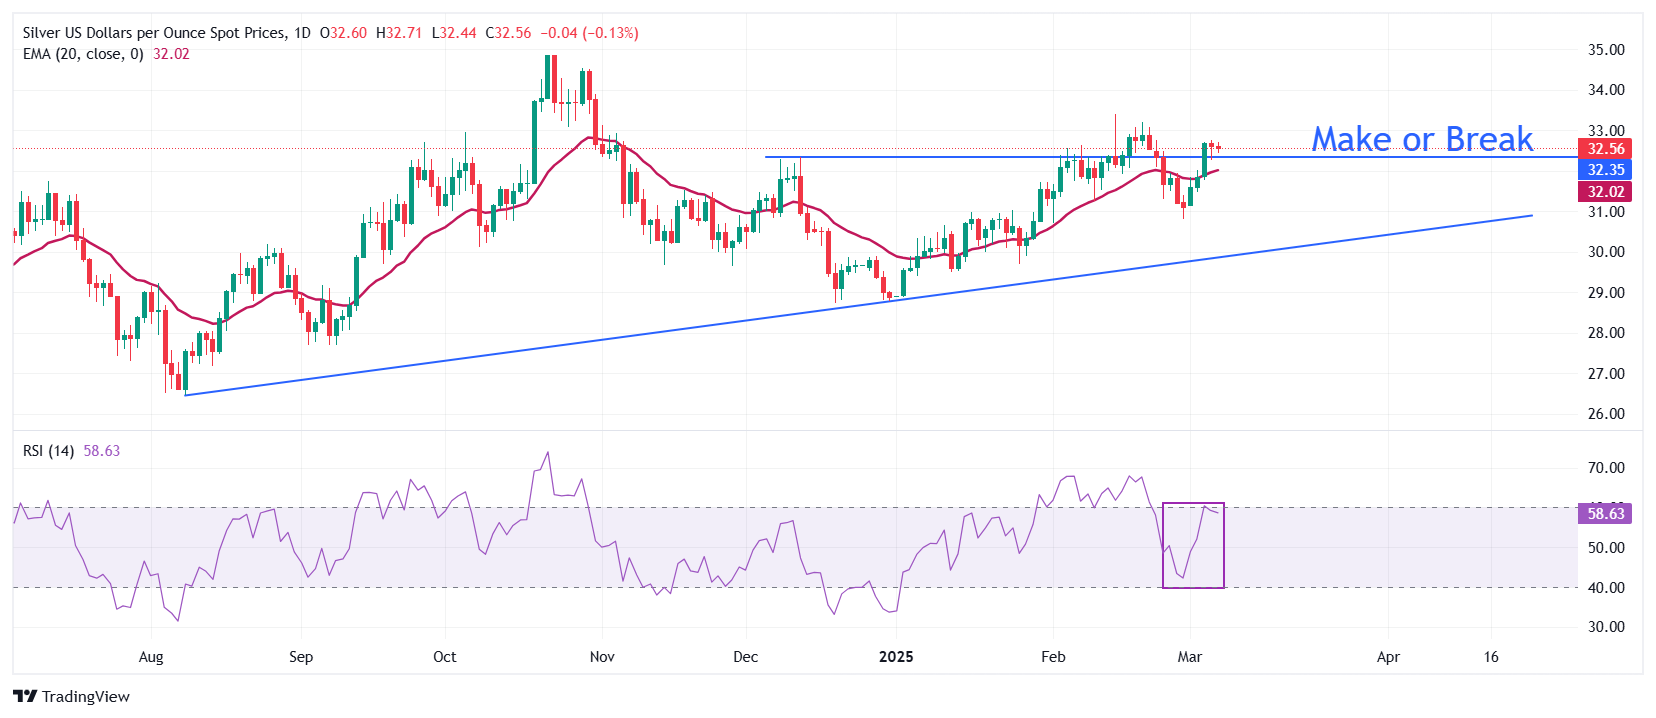
Silver technical analysis
Silver price strives to hold the key resistance of $32.40 plotted from the December 12 high. The asset trades above the 20-day Exponential Moving Average (EMA), which trades around $32.00, suggesting that the near-term trend is bullish.
The 14-day Relative Strength Index (RSI) oscillates inside the 40.00-60.00 range, suggesting a sideways trend.
Looking down, the upward-sloping trendline from the August 8 low of $26.45 will act as key support for the Silver price around $30.00. While, the February 14 high of $33.40 will be the key barrier.
Silver daily chart
Silver FAQs
Silver is a precious metal highly traded among investors. It has been historically used as a store of value and a medium of exchange. Although less popular than Gold, traders may turn to Silver to diversify their investment portfolio, for its intrinsic value or as a potential hedge during high-inflation periods. Investors can buy physical Silver, in coins or in bars, or trade it through vehicles such as Exchange Traded Funds, which track its price on international markets.
Silver prices can move due to a wide range of factors. Geopolitical instability or fears of a deep recession can make Silver price escalate due to its safe-haven status, although to a lesser extent than Gold's. As a yieldless asset, Silver tends to rise with lower interest rates. Its moves also depend on how the US Dollar (USD) behaves as the asset is priced in dollars (XAG/USD). A strong Dollar tends to keep the price of Silver at bay, whereas a weaker Dollar is likely to propel prices up. Other factors such as investment demand, mining supply – Silver is much more abundant than Gold – and recycling rates can also affect prices.
Silver is widely used in industry, particularly in sectors such as electronics or solar energy, as it has one of the highest electric conductivity of all metals – more than Copper and Gold. A surge in demand can increase prices, while a decline tends to lower them. Dynamics in the US, Chinese and Indian economies can also contribute to price swings: for the US and particularly China, their big industrial sectors use Silver in various processes; in India, consumers’ demand for the precious metal for jewellery also plays a key role in setting prices.
Silver prices tend to follow Gold's moves. When Gold prices rise, Silver typically follows suit, as their status as safe-haven assets is similar. The Gold/Silver ratio, which shows the number of ounces of Silver needed to equal the value of one ounce of Gold, may help to determine the relative valuation between both metals. Some investors may consider a high ratio as an indicator that Silver is undervalued, or Gold is overvalued. On the contrary, a low ratio might suggest that Gold is undervalued relative to Silver.


© 2000-2026. All rights reserved.
This site is managed by Teletrade D.J. LLC 2351 LLC 2022 (Euro House, Richmond Hill Road, Kingstown, VC0100, St. Vincent and the Grenadines).
The information on this website is for informational purposes only and does not constitute any investment advice.
The company does not serve or provide services to customers who are residents of the US, Canada, Iran, The Democratic People's Republic of Korea, Yemen and FATF blacklisted countries.
Making transactions on financial markets with marginal financial instruments opens up wide possibilities and allows investors who are willing to take risks to earn high profits, carrying a potentially high risk of losses at the same time. Therefore you should responsibly approach the issue of choosing the appropriate investment strategy, taking the available resources into account, before starting trading.
Use of the information: full or partial use of materials from this website must always be referenced to TeleTrade as the source of information. Use of the materials on the Internet must be accompanied by a hyperlink to teletrade.org. Automatic import of materials and information from this website is prohibited.
Please contact our PR department if you have any questions or need assistance at pr@teletrade.global.
transfers