- Analytics
- News and Tools
- Market News
- EUR/USD Price Analysis: Rises above 1.0850 while remaining in overbought territory
EUR/USD Price Analysis: Rises above 1.0850 while remaining in overbought territory
- EUR/USD moves below an ascending channel pattern, suggesting a bearish momentum shift.
- The 14-day RSI holding above the 70 mark signals a potential downward correction.
- The pair may find its primary support at the nine-day EMA of 1.0716 level,
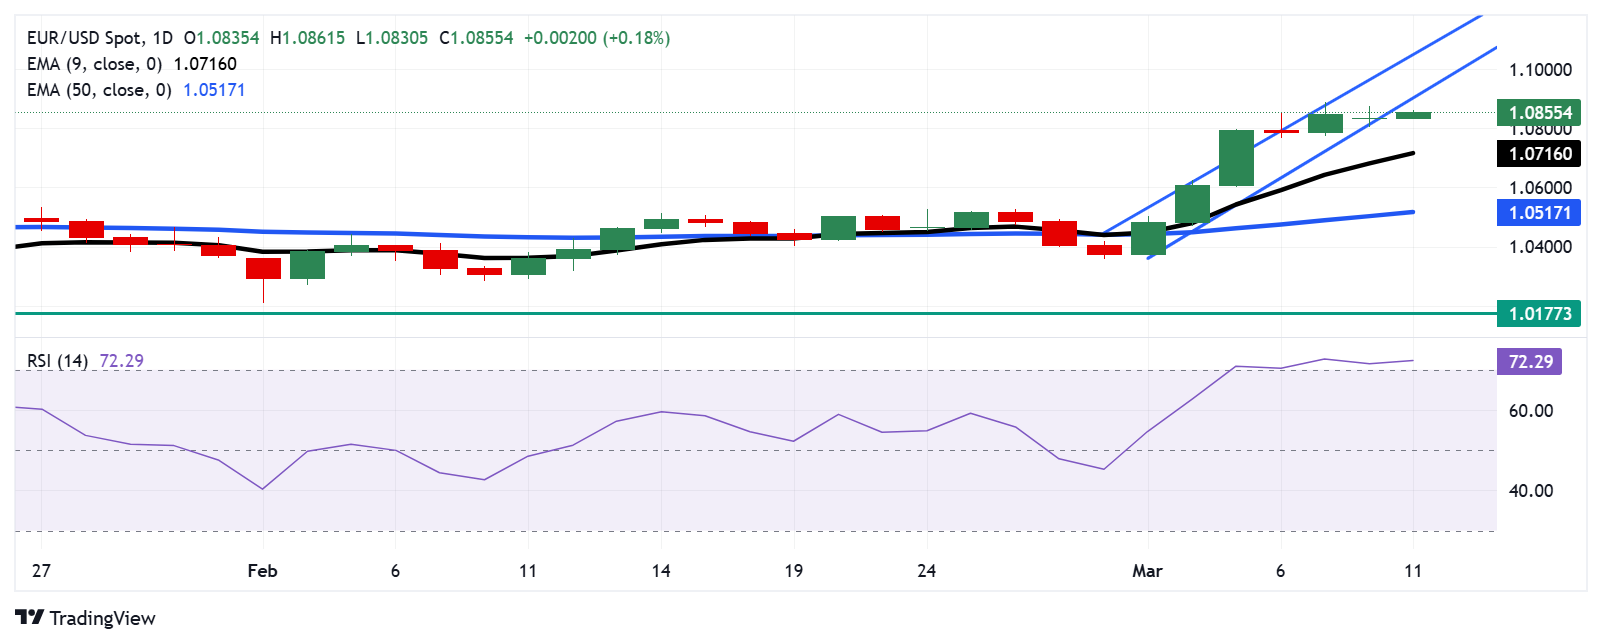
The EUR/USD pair gains ground for the third successive session, trading around 1.0860 during the Asian hours on Tuesday. A technical examination of the daily chart indicates a bearish breakout as the pair breaks below an ascending channel pattern, suggesting a shift in momentum from buyers to sellers.
Additionally, the 14-day Relative Strength Index (RSI), a key momentum indicator, is positioned slightly above 70, indicating an overbought situation and downward correction for the EUR/USD pair. However, the pair remains above both the nine-day and 14-day Exponential Moving Averages (EMAs), reinforcing strong short-term momentum.
A successful return to the ascending channel could reinforce the bullish bias and support the EUR/USD pair to explore the region around the upper boundary of the ascending channel at the 1.1050 level.
On the downside, the EUR/USD pair could find the primary support at the nine-day EMA of 1.0716 level, followed by the 50-day EMA at 1.0517 level. A break below this level would weaken the short-term price momentum and put downward pressure on the pair to navigate the area around the 1.0177 level—the lowest since November 2022, last recorded on January 1.
EUR/USD: Daily Chart
Euro PRICE Today
The table below shows the percentage change of Euro (EUR) against listed major currencies today. Euro was the strongest against the New Zealand Dollar.
| USD | EUR | GBP | JPY | CAD | AUD | NZD | CHF | |
|---|---|---|---|---|---|---|---|---|
| USD | -0.17% | -0.12% | -0.19% | -0.06% | 0.04% | 0.08% | -0.22% | |
| EUR | 0.17% | 0.07% | 0.02% | 0.12% | 0.22% | 0.26% | -0.04% | |
| GBP | 0.12% | -0.07% | -0.06% | 0.05% | 0.16% | 0.20% | -0.09% | |
| JPY | 0.19% | -0.02% | 0.06% | 0.13% | 0.23% | 0.27% | -0.02% | |
| CAD | 0.06% | -0.12% | -0.05% | -0.13% | 0.11% | 0.14% | -0.15% | |
| AUD | -0.04% | -0.22% | -0.16% | -0.23% | -0.11% | 0.05% | -0.25% | |
| NZD | -0.08% | -0.26% | -0.20% | -0.27% | -0.14% | -0.05% | -0.29% | |
| CHF | 0.22% | 0.04% | 0.09% | 0.02% | 0.15% | 0.25% | 0.29% |
The heat map shows percentage changes of major currencies against each other. The base currency is picked from the left column, while the quote currency is picked from the top row. For example, if you pick the Euro from the left column and move along the horizontal line to the US Dollar, the percentage change displayed in the box will represent EUR (base)/USD (quote).


© 2000-2026. All rights reserved.
This site is managed by Teletrade D.J. LLC 2351 LLC 2022 (Euro House, Richmond Hill Road, Kingstown, VC0100, St. Vincent and the Grenadines).
The information on this website is for informational purposes only and does not constitute any investment advice.
The company does not serve or provide services to customers who are residents of the US, Canada, Iran, The Democratic People's Republic of Korea, Yemen and FATF blacklisted countries.
Making transactions on financial markets with marginal financial instruments opens up wide possibilities and allows investors who are willing to take risks to earn high profits, carrying a potentially high risk of losses at the same time. Therefore you should responsibly approach the issue of choosing the appropriate investment strategy, taking the available resources into account, before starting trading.
Use of the information: full or partial use of materials from this website must always be referenced to TeleTrade as the source of information. Use of the materials on the Internet must be accompanied by a hyperlink to teletrade.org. Automatic import of materials and information from this website is prohibited.
Please contact our PR department if you have any questions or need assistance at pr@teletrade.global.
transfers