- Analytics
- News and Tools
- Market News
- USD/JPY Price Forecast: Stalls below 150.00 as Yen recovers from earlier losses
USD/JPY Price Forecast: Stalls below 150.00 as Yen recovers from earlier losses
- USD/JPY ends flat at 149.38, erasing a 0.54% loss as safe-haven flows boost the Yen late in the session.
- ‘Gravestone doji’ pattern forms, signaling momentum shift to the downside, with first support at 149.00.
- A break above 150.00 could trigger gains toward 150.67, but RSI flattening suggests limited upside potential.
The USD/jPY finished Tuesday’s session with anemic gains of 0.04%. The session was characterized by overall Japanese Yen (JPY) weakness until its safe-haven status boosted the Yen to trim earlier losses of 0.54%. As Wednesday’s Asian session begins, the pair trades at 149,38, virtually unchanged.
USD/JPY Price Forecast: Technical outlook
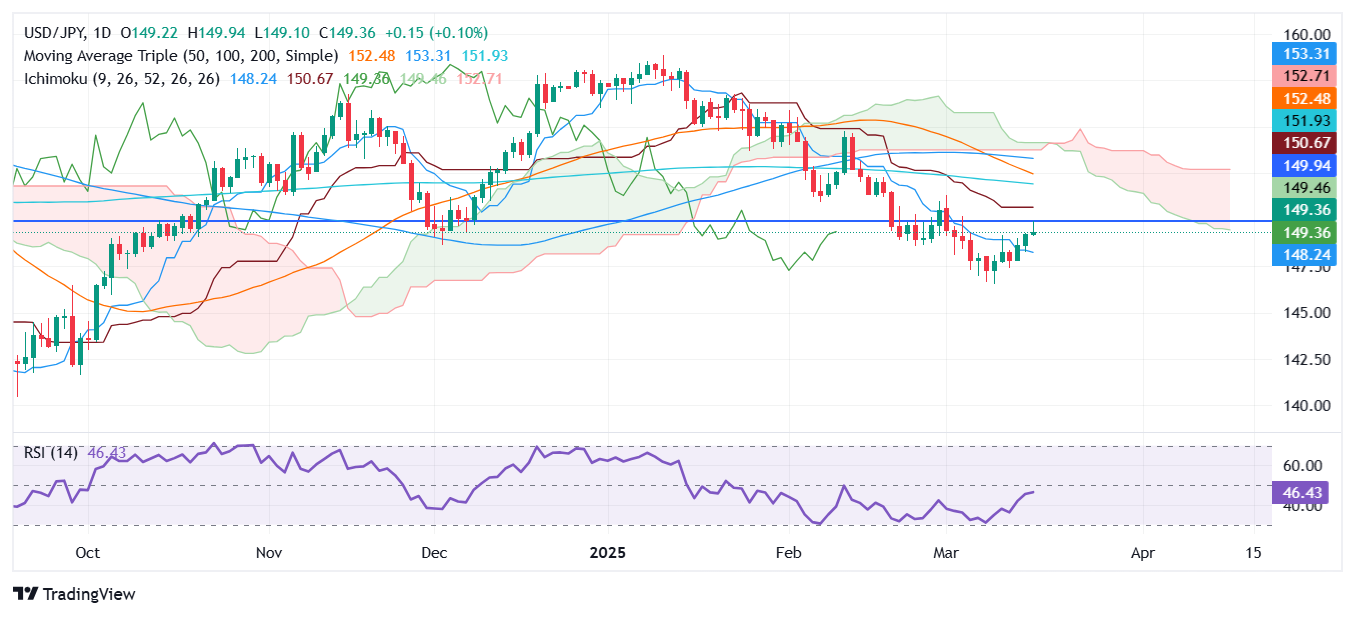
The USD/JPY rallied over 2.32% since bottoming around March 11 low of 146.54 and hit a high of 149.93 on March 18 before pulling back to current spot prices. Sellers moved late in yesterday’s session, helping to overcome earlier buying pressure. Therefore a ‘gravestone doji’ formed, hinting that momentum has shifted to the downside.
The Relative Strength Index (RSI) aims slightly up, but the slope flattened somewhat, which could indicate a bearish continuation.
The USD/JPY first support would be the 149.00 figure. A breach of the latter will expose the Tenkan-sen at 148.20, closely followed by the March 14 low of 147.76. Conversely, if buyers push the pair above 150.00, this will expose the Kijun-sen at 150.67 before testing the 200-day Simple Moving Average (SMA) at 151.91.
USD/JPY Price Chart – Daily
Japanese Yen PRICE This week
The table below shows the percentage change of Japanese Yen (JPY) against listed major currencies this week. Japanese Yen was the strongest against the US Dollar.
| USD | EUR | GBP | JPY | CAD | AUD | NZD | CHF | |
|---|---|---|---|---|---|---|---|---|
| USD | -0.58% | -0.48% | 0.42% | -0.58% | -0.44% | -1.23% | -0.90% | |
| EUR | 0.58% | -0.02% | 0.59% | 0.00% | 0.00% | -0.67% | -0.35% | |
| GBP | 0.48% | 0.02% | 0.93% | -0.20% | 0.00% | -0.67% | -0.41% | |
| JPY | -0.42% | -0.59% | -0.93% | -0.99% | -1.07% | -1.59% | -1.48% | |
| CAD | 0.58% | -0.00% | 0.20% | 0.99% | -0.06% | -0.65% | -0.87% | |
| AUD | 0.44% | -0.00% | -0.00% | 1.07% | 0.06% | -0.64% | -0.34% | |
| NZD | 1.23% | 0.67% | 0.67% | 1.59% | 0.65% | 0.64% | 0.32% | |
| CHF | 0.90% | 0.35% | 0.41% | 1.48% | 0.87% | 0.34% | -0.32% |
The heat map shows percentage changes of major currencies against each other. The base currency is picked from the left column, while the quote currency is picked from the top row. For example, if you pick the Japanese Yen from the left column and move along the horizontal line to the US Dollar, the percentage change displayed in the box will represent JPY (base)/USD (quote).


© 2000-2026. All rights reserved.
This site is managed by Teletrade D.J. LLC 2351 LLC 2022 (Euro House, Richmond Hill Road, Kingstown, VC0100, St. Vincent and the Grenadines).
The information on this website is for informational purposes only and does not constitute any investment advice.
The company does not serve or provide services to customers who are residents of the US, Canada, Iran, The Democratic People's Republic of Korea, Yemen and FATF blacklisted countries.
Making transactions on financial markets with marginal financial instruments opens up wide possibilities and allows investors who are willing to take risks to earn high profits, carrying a potentially high risk of losses at the same time. Therefore you should responsibly approach the issue of choosing the appropriate investment strategy, taking the available resources into account, before starting trading.
Use of the information: full or partial use of materials from this website must always be referenced to TeleTrade as the source of information. Use of the materials on the Internet must be accompanied by a hyperlink to teletrade.org. Automatic import of materials and information from this website is prohibited.
Please contact our PR department if you have any questions or need assistance at pr@teletrade.global.
transfers