- Analytics
- News and Tools
- Market News
CFD Markets News and Forecasts — 05-10-2021
| Time | Country | Event | Period | Previous value | Forecast |
|---|---|---|---|---|---|
| 01:00 (GMT) | New Zealand | RBNZ Interest Rate Decision | 0.25% | 0.5% | |
| 06:00 (GMT) | Germany | Factory Orders s.a. (MoM) | August | 3.4% | -2.1% |
| 08:30 (GMT) | United Kingdom | PMI Construction | September | 55.2 | 54 |
| 09:00 (GMT) | Eurozone | Retail Sales (MoM) | August | -2.3% | 0.8% |
| 09:00 (GMT) | Eurozone | Retail Sales (YoY) | August | 3.1% | 0.4% |
| 12:15 (GMT) | U.S. | ADP Employment Report | September | 374 | 475 |
| 13:00 (GMT) | U.S. | FOMC Member Bostic Speaks | |||
| 14:30 (GMT) | U.S. | Crude Oil Inventories | October | 4.578 | -0.3 |
| 15:30 (GMT) | U.S. | FOMC Member Bostic Speaks | |||
| 21:30 (GMT) | Australia | AIG Services Index | September | 45.6 |
eFXdata reports that analysts at Danske Research offer their outlook for EUR/USD.
"Since markets shifted from focusing on the unknowns of COVID to the global policy reaction - in the early summer of 2020; 'Europe' as an investment theme has seen a revival. With it, there has been no shortage of calls for EUR/USD to 1.30, of pieces written on a regime shift having happened in fiscal policy, oversubscription to social bonds and much more. However, narratives change. Right now, it seems more like rising interest rates amid a cyclical slowdown and rising energy prices is the perfect storm for a capital flow reversal."
"We have seen such reversals on several occasions and the repricing is always quite swift. If this is indeed the case, then it will be many years before analysts again contemplate a revival of Europe as a theme, or 1.30 in EUR/USD. Stagflation, rapid cyclical slowdown, rising interest rates and a correction in valuations may prove to be a very negative capital shock to the euro area and its asset prices."
"We target 1.13 in spot EUR/USD in the next year but if stagflation, cyclical slowdown and rising rates become dominant themes, then there seem to be clear downside to such estimate."
The
Institute for Supply Management (ISM) reported on Tuesday that its
non-manufacturing index (NMI) came in at 61.9 in September, which was 0.2
percentage point higher than an unrevised August’s reading of 61.7 percent. The latest reading pointed to the
growth in the services sector for the 16th straight month.
Economists
forecast the index to decrease to 60.0 last month. A reading above 50 signals
expansion, while a reading below 50 indicates contraction.
Of
the 18 services industries, 17 reported gains last month, the ISM said, even
though challenges with labor resources, logistics, and materials continued affecting
the continuity of supply.
According
to the report, the ISM’s non-manufacturing Production measure rose 2.2
percentage points to 62.3 percent from the August reading and its New Orders
gauge edged up 0.3 percentage point to 63.5 percent. At the same time, the
Employment indicator went down 0.7 percentage point to 53.0 percent, while the Supplier
Deliveries index fell 0.8 percentage point to 68.8 percent and the Inventories
indicator also decreased 0.8 percentage point to 46.1 percent. On the price
front, the Prices index increased 2.1 percentage points to 77.5 percent.
Commenting
on the data, the Chair of the ISM Services Business Survey Committee, Anthony
Nieves, noted, “The past relationship between the Services PMI and the overall
economy indicates that the Services PM for September (61.9 percent) corresponds
to a 4.5-percent increase in real gross domestic product (GDP) on an annualized
basis."
The latest report by IHS Markit revealed on Tuesday the seasonally adjusted final IHS Markit U.S. Services Business Activity Index (PMI) came in at 54.9 in September, down from 55.1 in August but slightly above the earlier released “flash” estimate of 54.4. The latest reading pointed to the slowest growth in business activity across the U.S. service sector since December 2020.
Economists had forecast the index to stay unrevised at 54.4.
According
to the report, output growth decelerated amid the slowest rise in new business for 13
months and labour shortages. Total sales were weighed down by the spread of
COVID-19 and a faster decrease in new export orders. At the same time, pressure
on capacity was reflected in the steepest increase in backlogs of work since
data collection began almost 12 years ago. Challenges expanding workforce
numbers reportedly exacerbated difficulties clearing incoming new business. On
the price front, cost pressures built for a second month running as input
prices grew at a sharp rate. Firms continued to pass on higher costs to
clients, but at the slowest pace for five months.
U.S. stock-index futures rose on Tuesday, as investors bought battered tech names, while economy-sensitive cyclical stocks were in favor ahead of the U.S. jobs report later in the week.
Global Stocks:
Index/commodity | Last | Today's Change, points | Today's Change, % |
Nikkei | 27,822.12 | -622.77 | -2.19% |
Hang Seng | 24,104.15 | +67.78 | +0.28% |
Shanghai | - | - | - |
S&P/ASX | 7,248.40 | -30.10 | -0.41% |
FTSE | 7,051.29 | +40.28 | +0.57% |
CAC | 6,528.01 | +50.35 | +0.78% |
DAX | 15,091.17 | +54.62 | +0.36% |
Crude oil | $78.86 | +1.60% | |
Gold | $1,758.90 | -0.49% |
(company / ticker / price / change ($/%) / volume)
3M Co | MMM | 176.75 | 0.71(0.40%) | 853 |
ALCOA INC. | AA | 49.7 | 0.52(1.06%) | 15328 |
ALTRIA GROUP INC. | MO | 46.61 | 0.11(0.24%) | 10267 |
Amazon.com Inc., NASDAQ | AMZN | 3,207.00 | 17.22(0.54%) | 25494 |
American Express Co | AXP | 174.01 | 1.35(0.78%) | 4202 |
AMERICAN INTERNATIONAL GROUP | AIG | 56.22 | 0.40(0.72%) | 4049 |
Apple Inc. | AAPL | 139.66 | 0.52(0.37%) | 699924 |
AT&T Inc | T | 27.33 | 0.08(0.29%) | 97574 |
Boeing Co | BA | 224.7 | 0.91(0.41%) | 32579 |
Caterpillar Inc | CAT | 194.4 | 1.27(0.66%) | 2830 |
Chevron Corp | CVX | 106 | 1.28(1.22%) | 31428 |
Cisco Systems Inc | CSCO | 54.32 | 0.09(0.17%) | 18267 |
Citigroup Inc., NYSE | C | 72.01 | 0.72(1.01%) | 32350 |
Exxon Mobil Corp | XOM | 62.45 | 0.73(1.18%) | 264779 |
Facebook, Inc. | FB | 329 | 2.77(0.85%) | 528397 |
FedEx Corporation, NYSE | FDX | 218.4 | 0.53(0.24%) | 17247 |
Ford Motor Co. | F | 14.44 | 0.09(0.63%) | 411675 |
Freeport-McMoRan Copper & Gold Inc., NYSE | FCX | 32.7 | -0.01(-0.03%) | 42438 |
General Electric Co | GE | 105.4 | 0.50(0.48%) | 4675 |
General Motors Company, NYSE | GM | 54.62 | 0.64(1.19%) | 114928 |
Goldman Sachs | GS | 376.89 | 2.74(0.73%) | 17203 |
Intel Corp | INTC | 53.71 | 0.24(0.45%) | 54236 |
International Business Machines Co... | IBM | 145.24 | 1.13(0.78%) | 11710 |
International Paper Company | IP | 53.83 | 0.88(1.66%) | 153 |
Johnson & Johnson | JNJ | 159.91 | 0.69(0.43%) | 8098 |
JPMorgan Chase and Co | JPM | 167.47 | 0.52(0.31%) | 34801 |
Merck & Co Inc | MRK | 82.75 | -0.35(-0.42%) | 292814 |
Microsoft Corp | MSFT | 284.38 | 1.27(0.45%) | 117394 |
Nike | NKE | 148.06 | 0.92(0.63%) | 25649 |
Pfizer Inc | PFE | 42.36 | -0.06(-0.14%) | 68105 |
Starbucks Corporation, NASDAQ | SBUX | 111.3 | -0.16(-0.14%) | 22646 |
Tesla Motors, Inc., NASDAQ | TSLA | 786.41 | 4.88(0.62%) | 202981 |
The Coca-Cola Co | KO | 53.17 | 0.18(0.34%) | 24310 |
Twitter, Inc., NYSE | TWTR | 58.95 | 0.56(0.96%) | 64563 |
UnitedHealth Group Inc | UNH | 391.58 | 4.57(1.18%) | 687 |
Verizon Communications Inc | VZ | 54.66 | 0.16(0.29%) | 19178 |
Visa | V | 225.55 | 0.82(0.36%) | 3795 |
Wal-Mart Stores Inc | WMT | 136.12 | 0.39(0.29%) | 8014 |
Walt Disney Co | DIS | 174.32 | 0.86(0.50%) | 8612 |
Yandex N.V., NASDAQ | YNDX | 76.26 | 1.26(1.68%) | 20069 |
Statistics
Canada announced on Tuesday that Canada recorded a trade surplus of CAD1.94
billion in August, compared with a revised CAD0.74-billion surplus in July
(originally a CAD0.78-billion surplus).
Economists
had forecast a surplus of CAD0.43 billion.
According
to the report, Canada’s exports went up 0.8 percent m-o-m to a record CAD54.44 billion
in August, as 6 of 11 product sections posted gains with energy products (+5.1
percent m-o-m) rising the most. Excluding this product section, exports decreased
0.4 percent m-o-m. Meanwhile, imports declined 1.4 percent m-o-m to CAD52.51
billion in August, with imports of motor vehicles and parts (-11.1 percent
m-o-m) accounting for most of the monthly change in total imports.
Dow (DOW) initiated with a Neutral at Redburn
NIKE (NKE) initiated with an Outperform at Wedbush; target $170
Procter & Gamble (PG) resumed with a Buy at BofA Securities; target $160
Facebook (FB) downgraded to Hold from Buy at DZ Bank; target $350
The
U.S. Commerce Department reported on Tuesday that the U.S. goods and services
trade deficit widened to $73.3 billion in August from a revised $70.3 billion
in the previous month (originally a gap of $70.0 billion). This was the largest
trade deficit on record.
Economists
had expected a deficit of $70.5 billion.
According
to the report, the August increase in the goods and services deficit reflected an advance in the goods
deficit of $1.6 billion to $89.4 billion and a decline in the services surplus of $1.4
billion to $16.2 billion.
In
August, exports of goods and services from the U.S. rose 0.5 percent m-o-m to
$213.7 billion, while imports jumped 1.4 percent m-o-m to $287.0 billion, as the
global COVID-19 pandemic and the economic recovery continued to impact
international trade.
Year-to-date,
the goods and services deficit climbed 33.7 percent from the same period in
2020. Exports soared 17.5 percent, while imports surged 21.2 percent.
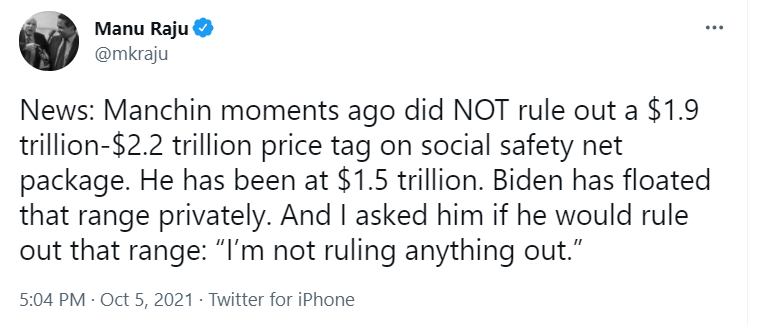
- Says she does regard October 18 as deadline for debt ceiling
- Supports bipartisan action to raise debt ceiling
- It is up to speaker Pelosi and majority leader Schumer on how to get debt ceiling raised
- It would be "catastrophic" if government couldn't pay its bills
- Asked if Fed chair Powell should be reappointed, says that is up to president Biden
| Time | Country | Event | Period | Previous value | Forecast | Actual |
|---|---|---|---|---|---|---|
| 06:45 | France | Industrial Production, m/m | August | 0.5% | 0.3% | 1% |
| 07:50 | France | Services PMI | September | 56.3 | 56 | 56.2 |
| 07:55 | Germany | Services PMI | September | 60.8 | 56 | 56.2 |
| 08:00 | Eurozone | Services PMI | September | 59 | 56.3 | 56.4 |
| 08:30 | United Kingdom | Purchasing Manager Index Services | September | 55.0 | 54.6 | 55.4 |
| 09:00 | Eurozone | Producer Price Index, MoM | August | 2.5% | 1.3% | 1.1% |
| 09:00 | Eurozone | Producer Price Index (YoY) | August | 12.4% | 13.5% | 13.4% |
GBP rose against other major currencies in the European session on Tuesday, as the prospect of interest rate hikes by the UK’s central bank was back in investors' focus.
At the September meeting, the Bank of England’s (BoE) policymakers indicated that rate hikes were not imminent, but the recent developments on the price front had “strengthened the case” for “some modest tightening of monetary policy” over the next few years, “although considerable uncertainties remain”. In addition, they dropped previous guidance that they did not intend to tighten monetary policy at least until there was clear evidence that significant progress was being made in eliminating spare capacity and achieving the 2% inflation target sustainably.
Growing inflation expectations weighted on investors’ sentiment last week, causing a steep sell-off in risk-sensitive sterling.
FXStreet reports that Benjamin Wong, Strategist at DBS Bank, suggests that a bearish triangle is possibly in play, which could lead the cable to test the 1.3163/58 support zone.
“The two prior resistances turn support pods at 1.3514 and 1.3482 have been tested with the recent low posted at 1.3412, as a hint of weakness. This should keep the near-term bearish triangle as a viable theme to trade, as long as GBP does not sustain gains over the 100-week moving average at 1.3866 and major resistance at 1.3914.”
“The triangle can eye a probe towards the 38.2% Fibonacci retracement of the 1.1412-1.4248 range grip (at 1.3158), which covers the covid flash lows and its highest recovery point. In the same price zone, we have in sight strong support offered by the 200-week moving average of 1.3163.”
FXStreet reports that strategists at Société Générale expect copper to recoup some ground towards the $9755/9820 resistance zone.
“Holding above last week's low of $8880, it could attempt a rebound towards a multi-month trend line near $9580 with next hurdle at projections of $9755/9820. Overcoming this will be crucial for next leg of uptrend.”
“Only a break below $8740 would denote an extended down move.”
PepsiCo (PEP) reported Q3 FY 2021 earnings of $1.79 per share (versus $1.66 per share in Q3 FY 2020), beating analysts’ consensus estimate of $1.73 per share.
The company’s quarterly revenues amounted to $20.189 bln (+11.6% y/y), beating analysts’ consensus estimate of $19.392 bln.
The company also raised FY 2021 guidance of organic revenues growth to 8% y/y (from previous guidance of +6% y/y) and reaffirmed FY 2021 EPS guidance of at least +12% y/y to $6.20 (versus analysts’ consensus estimate of $6.24).
PEP fell to $150.01 (-0.13%) in pre-market trading.

FXStreet reports that economists at Citibank expect that the world's most popular currency pair - EUR/USD - to edge lower due to three factors.
“We turn slightly bearish on EUR/USD as – US-EU real yields are high There is likely more upside than downside risk, Chinese growth concerns and the negative terms of trade impact of high gas and oil prices.”
“Major support lies between 1.1495 amd 1.1412-1.1422 but we think EUR/USD may not reach such lows.”
FXStreet reports that UOB Group’s FX Strategists suggest that USD/CNH faces sustainable losses on a breach of 6.4240 in the next weeks.
24-hour view: “USD traded between 6.4415 and 6.4584 yesterday, narrower than our expected range of 6.4300/6.4600. The underlying tone has firmed somewhat and USD could edge higher to 6.4630. The next resistance at 6.4700 is unlikely to come into the picture. Support is at 6.4460 followed by 6.4400.”
Next 1-3 weeks: “... USD subsequently rebounded but as long as 6.4800 is intact, the risk of USD closing below 6.4240 is intact. A break of 6.4800 would indicate that USD could trade sideways within a broad range for a period of time.”
FXStreet reports that analysts at Natixis said that the UK is now "overheating", with an acceleration in wages and unit labour costs and strong pressure on the labour market.
“Like other countries, the UK is affected by the rise in commodity prices, especially in energy prices, as the COVID-19 crisis ends. But Brexit has also given rise to: Supply problems; A decline in the number of workers from the EU. This has created pressure on the labour market, with persistently severe hiring difficulties for companies and declining employment.”
“The figures for wages, productivity and unit labour costs are difficult to interpret given the shock of the second quarter of 2020 and the repercussions of this shock in the second quarter of 2021 when calculating YoY changes. But we can measure the trend in developments by correcting the 2021 figure for the decline in 2020. When we then look at changes in: Wages; Unit labour costs; we see an acceleration in 2021.”
According to the report from the Society of Motor Manufacturers and Traders (SMMT), the UK new car market has recorded its weakest September since 1998 ahead of the introduction of the two-plate system in 1999.
Some 215,312 cars were registered in the month, a -34.4% fall on September 2020, when pandemic restrictions were significantly curtailing economic activity. September is typically the second busiest month of the year for the industry, but with the ongoing shortage of semiconductors impacting vehicle availability, the 2021 performance was down some -44.7% on the pre-pandemic ten-year average.
However, September was the best month ever for new battery electric vehicle (BEV) uptake. With a market share of 15.2%, 32,721 BEVs joined the road in the month, reflecting the wide range of models now available and growing consumer appetite. Indeed, the September performance was just over 5,000 shy of the total number registered during the whole of 2019.
Looking at market segmentation, private demand was down -25.3% with 120,560 new registrations in the month, but a bigger fall was recorded in large fleets, which declined by -43.1% to 90,445 units. As a result of the month’s disappointing performance, registrations year to date are now only 5.9% ahead of 2020 figures, and -29.4% down on the pre-pandemic decade-long average.
According to the report from Eurostat, in August 2021, industrial producer prices rose by 1.1% in both the euro area and the EU, compared with July 2021. Economists had expected a 1.3% increase in the euro area. In July 2021, prices increased by 2.5% in both the euro area and the EU. In August 2021, compared with August 2020, industrial producer prices increased by 13.4% in the euro area and by 13.5% in the EU.
Industrial producer prices in the euro area in August 2021, compared with July 2021, increased by 2.0% in the energy sector, by 1.4% for intermediate goods, by 0.5% for capital goods, by 0.3% for durable consumer goods and by 0.2% for non-durable consumer goods. Prices in total industry excluding energy increased by 0.7%. In the EU, industrial producer prices increased by 2.1% in the energy sector, by 1.4% for intermediate goods, by 0.5% for capital goods and for durable consumer goods and by 0.3% for non-durable consumer goods. Prices in total industry excluding energy increased by 0.8%.
According to the report from IHS Markit/CIPS, September data indicated another strong recovery in UK service sector activity, but severe supply constraints contributed to escalating inflationary pressures and the slowest rise in new orders since the end of the winter lockdown. Rapid rises in fuel, energy and staff costs were passed on to customers in September. The rate of prices charged inflation accelerated sharply since August and was the fastest since the survey began in 1996.
The headline seasonally adjusted UK Services PMI Business Activity Index registered 55.4 in September, up slightly from August's six month low (55.0) and well inside expansion territory. Although the latest reading signalled a solid increase in overall business activity, the rate of expansion was still much weaker than the peak seen in May (62.9). Around 34% of the survey panel reported an increase in output during September, while only 13% signalled a reduction.
Higher levels of activity were mostly attributed to robust confidence among clients and favourable business conditions due to the end of pandemic restrictions. However, those noting a fall in activity often commented on supply chain disruptions and shortages of staff, especially in the hospitality sector.
New order growth weakened for the fourth month running in September. The latest increase in new business volumes was the slowest since order books returned to expansion in March. Staff shortages, supply issues and the end of the stamp duty holiday were among the most commonly cited reasons for softer demand.
Finally, latest data indicated that business optimism eased slightly since August. However, the majority of panel members (57%) expect a rise in output during the year ahead, while only 8% forecast a fall.
According to the report from IHS Markit, euro area economic growth moderated for a second month running in September, marking a further retreat from the 15-year peak recorded in July as shortages of inputs impeded both manufacturing and service sector output. There were also softer rates of expansion in both new orders and employment, while businesses’ output expectations were the least optimistic since February. Meanwhile, inflationary trends moved higher in September, with input prices rising at the joint-fastest rate on record (since July 1998). Output prices subsequently rose at a pace which was only surpassed by those seen in June and July.
After accounting for seasonal factors, the Eurozone PMI Composite Output Index fell to 56.2 in September, down from 59.0 in August and the lowest reading since April. Although indicative of a strong expansion in business activity, it marked a considerable slowdown from the expansions seen between June and August, which were among the fastest in 23 years of data collection.
At the sector level, data showed services activity growing at a faster rate than manufacturing production for the first time since the COVID 19 pandemic started in early-2020, reflecting the latter’s sensitivity to ongoing supply-related issues. Regardless, rates of growth were considerably slower than in August in both sectors.
FXStreet reports that strategists at TD Securities said that OPEC+ status-quo production hike may be fodder for $100 Brent Crude Oil.
“OPEC+ plans to increase output by 400k b/d per month for November, resulting in surging energy supply risk in the near-term as OPEC infers less of a knock-on impact from the natural gas shortage for oil and petroleum product demand than the market's assessment.”
“Delta-variant risks have proved benign, while growing departure levels suggest air traffic will continue to support jet fuel demand across both APAC and the US. With demand for fuel rising, crude and petroleum product markets, particularly Brent, heating oil and fuel oils, are likely to get tighter and prices higher. Should this trend continue, specs may be eyeing $100/b crude as the next big level.”
| Time | Country | Event | Period | Previous value | Forecast | Actual |
|---|---|---|---|---|---|---|
| 00:30 | Australia | ANZ Job Advertisements (MoM) | September | -2.7% | 0.7% | -2.8% |
| 00:30 | Australia | Trade Balance | August | 12.650 | 10.3 | 15.077 |
| 01:30 | Australia | Retail Sales, M/M | August | -2.7% | -1.7% | -1.7% |
| 03:30 | Australia | Announcement of the RBA decision on the discount rate | 0.1% | 0.1% | 0.1% | |
| 06:45 | France | Industrial Production, m/m | August | 0.5% | 0.3% | 1% |
During today's Asian trading, the US dollar strengthened against the euro and the yen after weakening at the end of the previous session.
The ICE index, which tracks the dynamics of the dollar against six currencies (euro, swiss franc, yen, canadian dollar, pound sterling and swedish krona), rose 0.2%.
The focus of the market this week will be data on the US labor market, which will be released on Friday. Experts on average expect an increase in the number of jobs by 488 thousand.
Employment growth rates will be sufficient for the Federal Reserve System to begin winding down the asset purchase program this year, experts say.
MUFG analysts earlier raised the forecast of the dollar against the euro at the end of this year to $1.15 from the previously expected $1.2 due to the expected curtailment of the asset purchase program by the Federal Reserve. In addition, the dollar will be supported by its status as a "safe haven" currency, which is especially important in the context of deteriorating prospects for the global economy against the background of deepening supply chain problems.
Oanda experts also consider the near-term prospects of the dollar favorable. The demand for the US currency as a safe haven asset is supported by the increasing tensions between the US and China, as well as the risks associated with the possible consequences of the debt problems of the Chinese developer China Evergrande for the economy.
According to the report from INSEE, in August 2021, output went up again in the manufacturing industry (+1.1%, after +0.7%), as well as in the whole industry (+1.0%, after +0.5%). Economists had expected a 0.3% increase in the whole industry. Compared to February 2020 (the last month before the first general lockdown), output remained in decline in the manufacturing industry (–4.5%), as well as in the whole industry (–3.9%).
In August 2021, output bounced back in “other manufacturing” (+2.4% after –0.4%), in the manufacture of machinery and equipment goods (+1.8% after –0.3%), in mining and quarrying, energy, water supply (+0.5% after –1.0%) and in the manufacture of coke and refined petroleum (+3.2% after –7.4%). However it fell back in the manufacture of food products and beverages (–1.6% after +1.7%) and in the manufacture of transport equipment (–1.6% after +7.0%).
Cumulative output over the last three months was higher than that of the same months of 2020 in the manufacturing industry (+5.1%), as well as in the whole industry (+4.9%).
Over this one-year period, output increased strongly in all manufacturing activities: in “other manufacturing” (+6.1%), in the manufacture of machinery and equipment goods (+6.0%), in mining and quarrying, energy, water supply (+3.8%), in the manufacture of food products and beverages (+3.4%), in the manufacture of transport equipment (+1.9%) and in the manufacture of coke and refined petroleum products (+7.9%).
Reuters reports that new economy minister Daishiro Yamagiwa said that Japan's government will take all necessary measures to support the economy, which has been hit hard by the coronavirus pandemic.
Yamagiwa told reporters at his first news conference he is determined to conduct economic and fiscal policy in a bold manner.
"We will manage economic and financial policy in a flexible manner without hesitation," he said, calling for discussions about the country's economic growth strategy and reducing income inequality.
Kishida has pledged to compile a stimulus package worth tens of trillions of yen, which would be a move which may help firm up growth in the world's third-largest economy.
Also on Tuesday, new chief cabinet secretary Hirokazu Matsuno said the government is watching oil prices as rises would hurt corporate profits and increase the burden on households.
CNBC reports that U.S. Trade Representative Katherine Tai slammed China’s unfair trade practices and vowed to protect U.S. economic interests.
“Our objective is not to inflame trade tensions with China,” Tai said.
“But above all else, we must defend to the hilt our economic interests and that means taking all steps necessary to protect ourselves against the waves of damage inflicted over the years through unfair competition,” said Tai, the nation’s top trade official.
During her address, Tai confirmed a CNBC report last week saying that the Biden administration believed that Beijing has not complied with the phase one trade deal. The deal is slated to expire at the end of 2021.
Tai said that she was looking forward to leading the negotiations with the Chinese on behalf of the Biden administration, despite seemingly little appetite from Beijing to improve the bilateral relationship.
RTTNews reports that the policy board of the Reserve Bank of Australia decided to leave its cash rate unchanged at a record low of 0.10 percent. The board maintained the target of 10 basis points for the April 2024 Australian Government bond.
The board also voted to continue with the purchase of government securities at the rate of A$4 billion a week until at least mid February 2022.
The bank repeated that it will not increase the cash rate until actual inflation is sustainably within the 2 to 3 percent target range. The central scenario for the economy is that this condition will not be met before 2024.
EUR/USD
Resistance levels (open interest**, contracts)
$1.1708 (2212)
$1.1674 (715)
$1.1653 (644)
Price at time of writing this review: $1.1593
Support levels (open interest**, contracts):
$1.1545 (2014)
$1.1498 (6189)
$1.1449 (377)
Comments:
- Overall open interest on the CALL options and PUT options with the expiration date October, 8 is 81113 contracts (according to data from October, 4) with the maximum number of contracts with strike price $1,2200 (8606);
GBP/USD
$1.3759 (212)
$1.3719 (411)
$1.3685 (199)
Price at time of writing this review: $1.3589
Support levels (open interest**, contracts):
$1.3523 (632)
$1.3485 (1319)
$1.3441 (1259)
Comments:
- Overall open interest on the CALL options with the expiration date October, 8 is 13614 contracts, with the maximum number of contracts with strike price $1,4150 (2064);
- Overall open interest on the PUT options with the expiration date October, 8 is 19934 contracts, with the maximum number of contracts with strike price $1,3250 (1885);
- The ratio of PUT/CALL was 1.46 versus 1.64 from the previous trading day according to data from October, 4
* - The Chicago Mercantile Exchange bulletin (CME) is used for the calculation.
** - Open interest takes into account the total number of option contracts that are open at the moment.
| Raw materials | Closed | Change, % |
|---|---|---|
| Brent | 81.59 | 2.68 |
| Silver | 22.651 | 0.61 |
| Gold | 1769.148 | 0.48 |
| Palladium | 1895.27 | -0.81 |
| Time | Country | Event | Period | Previous value | Forecast |
|---|---|---|---|---|---|
| 00:30 (GMT) | Australia | ANZ Job Advertisements (MoM) | September | -2.5% | |
| 00:30 (GMT) | Australia | Trade Balance | August | 12.117 | 10.65 |
| 01:00 (GMT) | Australia | MI Inflation Gauge, m/m | September | 0.5% | |
| 01:30 (GMT) | Australia | Retail Sales, M/M | August | -2.7% | -1.7% |
| 03:30 (GMT) | Australia | Announcement of the RBA decision on the discount rate | 0.1% | 0.1% | |
| 06:45 (GMT) | France | Industrial Production, m/m | August | 0.3% | 0.4% |
| 07:50 (GMT) | France | Services PMI | September | 56.3 | 56 |
| 07:55 (GMT) | Germany | Services PMI | September | 60.8 | 56 |
| 08:00 (GMT) | Eurozone | Services PMI | September | 59 | 56.3 |
| 08:30 (GMT) | United Kingdom | Purchasing Manager Index Services | September | 55.0 | 54.6 |
| 09:00 (GMT) | Eurozone | Producer Price Index, MoM | August | 2.3% | 1.3% |
| 09:00 (GMT) | Eurozone | Producer Price Index (YoY) | August | 12.1% | 13.5% |
| 12:30 (GMT) | Canada | Trade balance, billions | August | 0.78 | 0.35 |
| 12:30 (GMT) | U.S. | International Trade, bln | August | -70 | -70.5 |
| 13:45 (GMT) | U.S. | Services PMI | September | 55.1 | 54.4 |
| 14:00 (GMT) | U.S. | ISM Non-Manufacturing | September | 61.7 | 60 |
| 15:00 (GMT) | Eurozone | ECB President Lagarde Speaks |
| Pare | Closed | Change, % |
|---|---|---|
| AUDUSD | 0.72864 | 0.39 |
| EURJPY | 128.799 | 0.19 |
| EURUSD | 1.16168 | 0.2 |
| GBPJPY | 150.888 | 0.45 |
| GBPUSD | 1.36058 | 0.48 |
| NZDUSD | 0.69638 | 0.53 |
| USDCAD | 1.2582 | -0.47 |
| USDCHF | 0.92399 | -0.53 |
| USDJPY | 110.885 | -0.04 |


© 2000-2026. All rights reserved.
This site is managed by Teletrade D.J. LLC 2351 LLC 2022 (Euro House, Richmond Hill Road, Kingstown, VC0100, St. Vincent and the Grenadines).
The information on this website is for informational purposes only and does not constitute any investment advice.
The company does not serve or provide services to customers who are residents of the US, Canada, Iran, The Democratic People's Republic of Korea, Yemen and FATF blacklisted countries.
Making transactions on financial markets with marginal financial instruments opens up wide possibilities and allows investors who are willing to take risks to earn high profits, carrying a potentially high risk of losses at the same time. Therefore you should responsibly approach the issue of choosing the appropriate investment strategy, taking the available resources into account, before starting trading.
Use of the information: full or partial use of materials from this website must always be referenced to TeleTrade as the source of information. Use of the materials on the Internet must be accompanied by a hyperlink to teletrade.org. Automatic import of materials and information from this website is prohibited.
Please contact our PR department if you have any questions or need assistance at pr@teletrade.global.
transfers