- Analytics
- News and Tools
- Market News
CFD Markets News and Forecasts — 15-01-2019
| Time | Country | Event | Period | Previous value | Forecast |
|---|---|---|---|---|---|
| 04:30 | Japan | Tertiary Industry Index | November | 1.9% | -0.5% |
| 07:00 | Germany | CPI, m/m | December | 0.1% | 0.1% |
| 07:00 | Germany | CPI, y/y | December | 2.3% | 1.7% |
| 09:15 | United Kingdom | BOE Gov Mark Carney Speaks | |||
| 09:30 | United Kingdom | Producer Price Index - Input (YoY) | December | 5.6% | 3.5% |
| 09:30 | United Kingdom | Producer Price Index - Input (MoM) | December | -2.3% | -1.6% |
| 09:30 | United Kingdom | Retail Price Index, m/m | December | 0% | 0.5% |
| 09:30 | United Kingdom | Producer Price Index - Output (YoY) | December | 3.1% | 2.9% |
| 09:30 | United Kingdom | Producer Price Index - Output (MoM) | December | 0.2% | 0.1% |
| 09:30 | United Kingdom | Retail prices, Y/Y | December | 3.2% | 2.8% |
| 09:30 | United Kingdom | HICP ex EFAT, Y/Y | December | 1.8% | 1.8% |
| 09:30 | United Kingdom | HICP, m/m | December | 0.2% | 0.2% |
| 09:30 | United Kingdom | HICP, Y/Y | December | 2.3% | 2.1% |
| 13:30 | U.S. | Import Price Index | December | -1.6% | -1.2% |
| 15:00 | U.S. | NAHB Housing Market Index | January | 56 | 56 |
| 15:30 | U.S. | Crude Oil Inventories | January | -1.680 | |
| 19:00 | U.S. | Fed's Beige Book | |||
| 21:00 | U.S. | Net Long-term TIC Flows | November | 31.3 | |
| 21:00 | U.S. | Total Net TIC Flows | November | 42 |
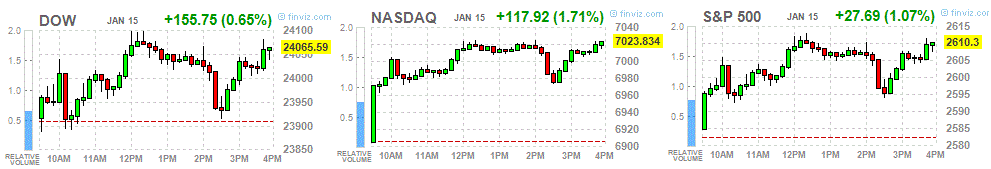
Major US stock indexes rose significantly on Tuesday, as hopes for further incentives for a slowing Chinese economy and a surge in Netflix shares helped investors offset the disappointing earnings from JPMorgan and Wells Fargo.
The US data was also in focus. As the report of the Ministry of Labor showed, the producer price index for final demand fell by 0.2% in December after rising by 0.1% in November. This led to an annual increase in producer price index in December by 2.5%. Economists predicted that industrial inflation will decline by 0.1% over the month and increase by 2.5% on an annualized basis. At the same time, the basic producer price index fell in December by 0.1% after rising by 0.3% in November. In annual terms, the baseline value of industrial inflation increased by 2.7%, as in November.
Quotes of oil jumped by about 3% against the background of OPEC and Russia reduced production, as well as signs of a decline in US oil reserves. The number of US rigs looking for new oil fell slightly to 873, in early 2019, and a Reuters survey found that US crude stocks probably declined last week.
Most of the components of DOW finished trading in positive territory (24 out of 30). The growth leader was UnitedHealth Group Incorporated (UNH, + 3.31%). Outsiders were 3M Company (MMM, -1.71%).
Almost all sectors of the S & P recorded an increase. The largest growth was shown by the health sector (+ 1.5%). Only the industrial goods sector decreased (-0.3%)
At the time of closing:
Dow 24,065.59 +155.75 +0.65%
S & P 500 2,610.30 +27.69 +1.07%
Nasdaq 100 7,023.83 +117.92 +1.71%
| Time | Country | Event | Period | Previous value | Forecast |
|---|---|---|---|---|---|
| 04:30 | Japan | Tertiary Industry Index | November | 1.9% | -0.5% |
| 07:00 | Germany | CPI, m/m | December | 0.1% | 0.1% |
| 07:00 | Germany | CPI, y/y | December | 2.3% | 1.7% |
| 09:15 | United Kingdom | BOE Gov Mark Carney Speaks | |||
| 09:30 | United Kingdom | Producer Price Index - Input (YoY) | December | 5.6% | 3.5% |
| 09:30 | United Kingdom | Producer Price Index - Input (MoM) | December | -2.3% | -1.6% |
| 09:30 | United Kingdom | Retail Price Index, m/m | December | 0% | 0.5% |
| 09:30 | United Kingdom | Producer Price Index - Output (YoY) | December | 3.1% | 2.9% |
| 09:30 | United Kingdom | Producer Price Index - Output (MoM) | December | 0.2% | 0.1% |
| 09:30 | United Kingdom | Retail prices, Y/Y | December | 3.2% | 2.8% |
| 09:30 | United Kingdom | HICP ex EFAT, Y/Y | December | 1.8% | 1.8% |
| 09:30 | United Kingdom | HICP, m/m | December | 0.2% | 0.2% |
| 09:30 | United Kingdom | HICP, Y/Y | December | 2.3% | 2.1% |
| 13:30 | U.S. | Import Price Index | December | -1.6% | -1.2% |
| 15:00 | U.S. | NAHB Housing Market Index | January | 56 | 56 |
| 15:30 | U.S. | Crude Oil Inventories | January | -1.680 | |
| 19:00 | U.S. | Fed's Beige Book | |||
| 21:00 | U.S. | Net Long-term TIC Flows | November | 31.3 | |
| 21:00 | U.S. | Total Net TIC Flows | November | 42 |
“The new attack by the ECB's supervisory authority on the Italian banking system and MPS once again shows that the banking union not only does not make our financial system more stable, but also causes instability,” Salvini said.
The far-right leader blamed the ECB for the exceptional decisions taken by the European Commission, adding that he raised a “fundamental question” about the bank’s perceived impartiality.
“Independence does not mean irresponsibility,” Salvini said, demanding greater transparency in decision making.
U.S. stock-index futures rose slightly on Tuesday, as disappointing quarterly results from JPMorgan (JPM; -2.3%) partly offset reports about China’s stimulus measures.
Global Stocks:
Index/commodity | Last | Today's Change, points | Today's Change, % |
Nikkei | 20,555.29 | +195.59 | +0.96% |
Hang Seng | 26,830.29 | +531.96 | +2.02% |
Shanghai | 2,570.34 | +34.58 | +1.36% |
S&P/ASX | 5,814.60 | +41.20 | +0.71% |
FTSE | 6,855.99 | +0.97 | +0.01% |
CAC | 4,765.56 | +2.81 | +0.06% |
DAX | 10,826.32 | -29.59 | -0.27% |
Crude | $51.23 | +1.43% | |
Gold | $1,291.70 | +0.03% |
The headline general business conditions index fell eight points to 3.9, its lowest level in well over a year. New orders increased at a slower pace than in recent months, while shipments continued to climb significantly. Delivery times were slightly shorter, and inventories declined. Labor market indicators pointed to a modest increase in employment and hours worked.
The prices paid index moved lower for a second consecutive month, indicating some slowing in input price increases, and the prices received index held steady. Looking ahead, firms were less optimistic about the six-month outlook than they were last month.
The Producer Price Index for final demand fell 0.2 percent in December, seasonally adjusted, the U.S. Bureau of Labor Statistics reported today. Final demand prices advanced 0.1 percent in November and 0.6 percent in October. On an unadjusted basis, the final demand index moved up 2.5 percent in 2018, the same as in 2017.
In December, 80 percent of the decrease in the final demand index is attributable to a 0.4-percent decline in prices for final demand goods. The index for final demand services edged down 0.1 percent.
The index for final demand less foods, energy, and trade services was unchanged in December following a 0.3-percent rise in November. In 2018, prices for final demand less foods, energy, and trade services advanced 2.8 percent following a 2.3-percent increase in 2017.
(company / ticker / price / change ($/%) / volume)
3M Co | MMM | 190 | -2.17(-1.13%) | 4546 |
ALCOA INC. | AA | 28.51 | -0.28(-0.97%) | 900 |
ALTRIA GROUP INC. | MO | 48.27 | 0.01(0.02%) | 463 |
Amazon.com Inc., NASDAQ | AMZN | 1,631.00 | 13.79(0.85%) | 49433 |
Apple Inc. | AAPL | 150.2 | 0.20(0.13%) | 130389 |
AT&T Inc | T | 30.45 | -0.17(-0.56%) | 30860 |
Boeing Co | BA | 351.61 | 1.25(0.36%) | 6252 |
Caterpillar Inc | CAT | 132.49 | 0.69(0.52%) | 423 |
Cisco Systems Inc | CSCO | 43.2 | -0.01(-0.02%) | 8310 |
Citigroup Inc., NYSE | C | 58.86 | -0.07(-0.12%) | 81678 |
Exxon Mobil Corp | XOM | 71.97 | 0.34(0.47%) | 3542 |
Facebook, Inc. | FB | 145.42 | 0.03(0.02%) | 67832 |
FedEx Corporation, NYSE | FDX | 171 | -0.55(-0.32%) | 115 |
Ford Motor Co. | F | 9.05 | 0.06(0.67%) | 117974 |
Freeport-McMoRan Copper & Gold Inc., NYSE | FCX | 11.91 | 0.36(3.12%) | 123383 |
General Motors Company, NYSE | GM | 37.84 | 0.18(0.48%) | 16845 |
Goldman Sachs | GS | 177 | -1.72(-0.96%) | 9041 |
Home Depot Inc | HD | 176.13 | -2.68(-1.50%) | 22824 |
Intel Corp | INTC | 48.37 | 0.02(0.04%) | 12872 |
International Business Machines Co... | IBM | 120.63 | 0.24(0.20%) | 3136 |
Johnson & Johnson | JNJ | 128.13 | -0.15(-0.12%) | 1130 |
JPMorgan Chase and Co | JPM | 98.22 | -2.72(-2.69%) | 495688 |
Merck & Co Inc | MRK | 73.5 | 0.13(0.18%) | 1515 |
Microsoft Corp | MSFT | 102.76 | 0.71(0.69%) | 74379 |
Pfizer Inc | PFE | 42.45 | 0.08(0.19%) | 580 |
Procter & Gamble Co | PG | 91.02 | -0.13(-0.14%) | 629 |
Tesla Motors, Inc., NASDAQ | TSLA | 336.6 | 2.20(0.66%) | 27227 |
The Coca-Cola Co | KO | 46.87 | -0.28(-0.59%) | 14532 |
Twitter, Inc., NYSE | TWTR | 32.5 | 0.13(0.40%) | 34923 |
United Technologies Corp | UTX | 110.73 | -0.12(-0.11%) | 151 |
UnitedHealth Group Inc | UNH | 242.55 | -5.51(-2.22%) | 66943 |
Verizon Communications Inc | VZ | 57.79 | -0.24(-0.41%) | 9525 |
Visa | V | 137.8 | 0.70(0.51%) | 6431 |
Walt Disney Co | DIS | 112.81 | 0.39(0.35%) | 947 |
Yandex N.V., NASDAQ | YNDX | 29.56 | 0.01(0.03%) | 750 |
American Intl (AIG) initiated with a Neutral at Compass Point; target $44
Citigroup (C) upgraded to Outperform from Market Perform at BMO Capital Markets
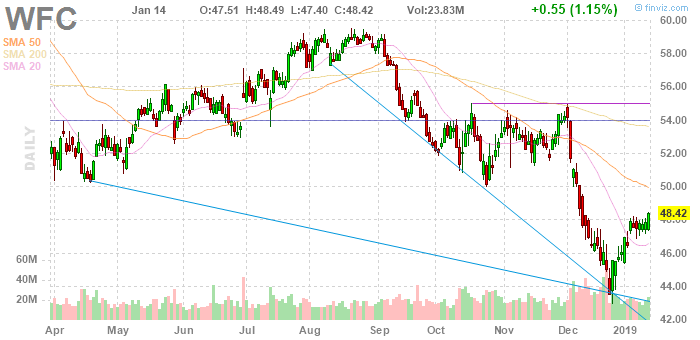
Wells Fargo (WFC) reported Q4 FY 2018 earnings of $1.21 per share (versus $1.16 in Q4 FY 2017), beating analysts’ consensus estimate of $1.18.
The company’s quarterly revenues amounted to $20.980 bln (-4.9% y/y), missing analysts’ consensus estimate of $21.803 bln.
WFC fell to $48.10 (-0.66%) in pre-market trading.
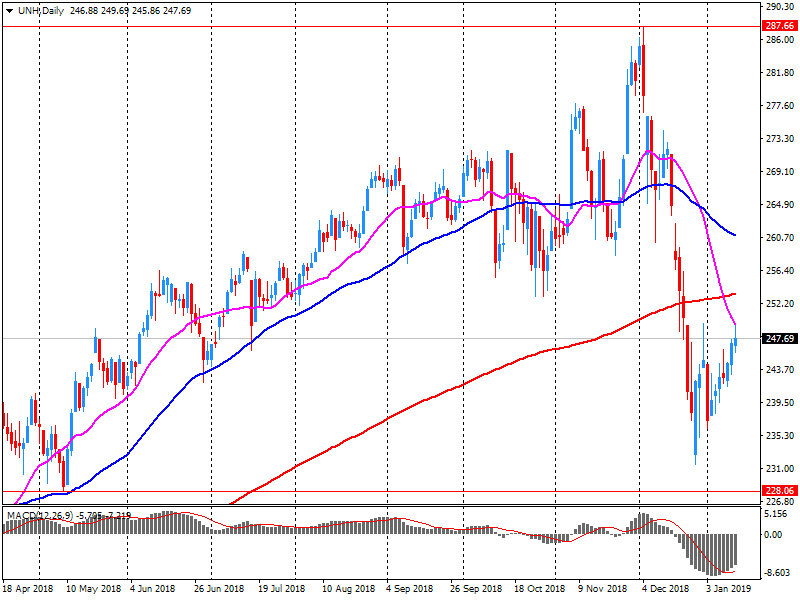
UnitedHealth (UNH) reported Q4 FY 2018 earnings of $3.28 per share (versus $2.44 in Q4 FY 2017), beating analysts’ consensus estimate of $3.22.
The company’s quarterly revenues amounted to $58.417 bln (+12.2% y/y), generally in-line with analysts’ consensus estimate of $58.011 bln.
The company also reaffirmed guidance for FY 2019, projecting EPS of $14.40-14.70 versus analysts’ consensus estimate of $14.64.
UNH fell to $243.60 (-1.80%) in pre-market trading.
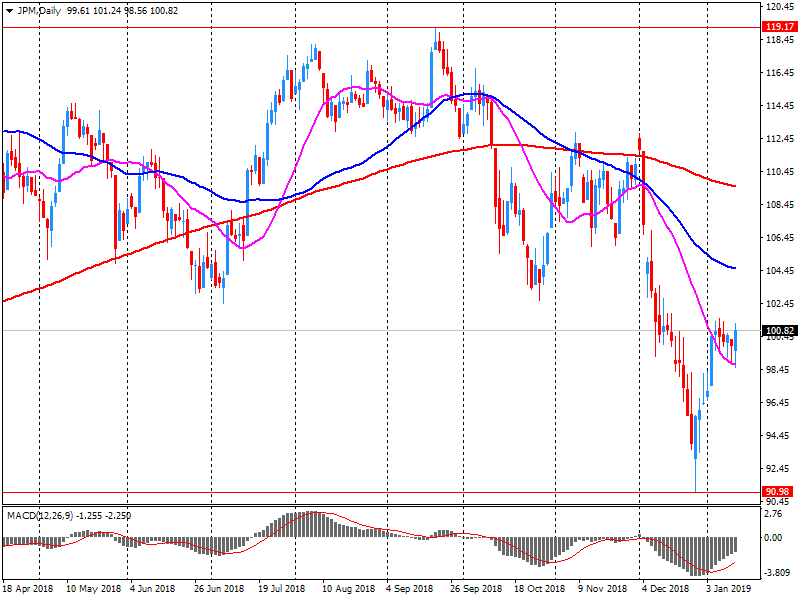
JPMorgan Chase (JPM) reported Q4 FY 2018 earnings of $1.98 per share (versus $1.76 in Q4 FY 2017), missing analysts’ consensus estimate of $2.19.
The company’s quarterly revenues amounted to $26.100 bln (+8.1% y/y), missing analysts’ consensus estimate of $26.688 bln.
JPM fell to $98.27 (-2.65%) in pre-market trading.
The first estimate for euro area (EA19) exports of goods to the rest of the world in November 2018 was €203.0 billion, an increase of 1.9% compared with November 2017 (€199.2 bn). Imports from the rest of the world stood at €184.0 bn, a rise of 4.7% compared with November 2017 (€175.7 bn). As a result, the euro area recorded a €19.0 bn surplus in trade in goods with the rest of the world in November 2018, compared with +€23.4 bn in November 2017. Intra-euro area trade rose to €170.5 bn in November 2018, up by 1.5% compared with November 2017.
EUR/USD
Resistance levels (open interest**, contracts)
$1.1596 (2286)
$1.1576 (1951)
$1.1561 (473)
Price at time of writing this review: $1.1472
Support levels (open interest**, contracts):
$1.1400 (2903)
$1.1365 (3993)
$1.1326 (4796)
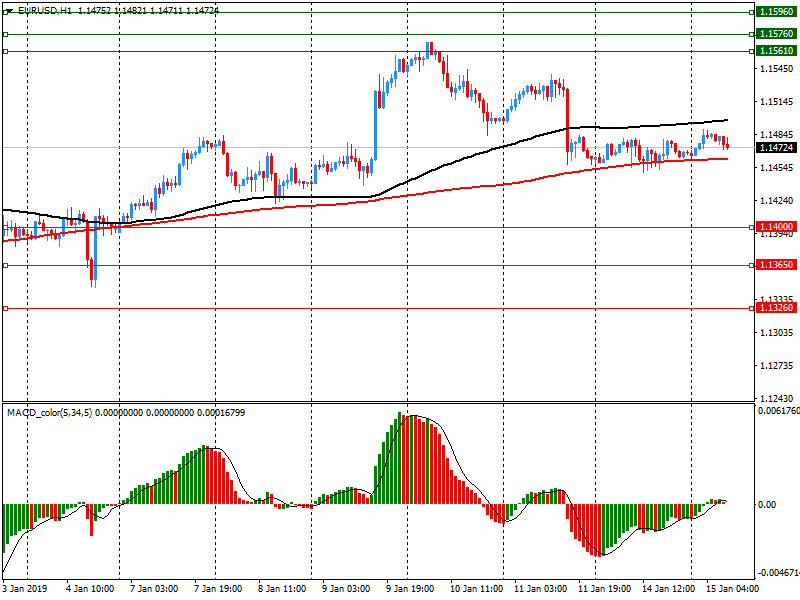
Comments:
- Overall open interest on the CALL options and PUT options with the expiration date February, 8 is 69067 contracts (according to data from January, 14) with the maximum number of contracts with strike price $1,1600 (5466);
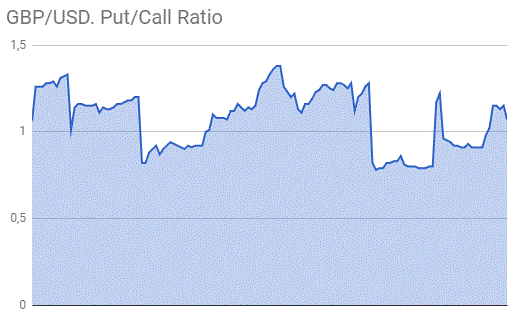
GBP/USD
Resistance levels (open interest**, contracts)
$1.3000 (547)
$1.2971 (180)
$1.2950 (147)
Price at time of writing this review: $1.2881
Support levels (open interest**, contracts):
$1.2770 (495)
$1.2748 (206)
$1.2725 (477)
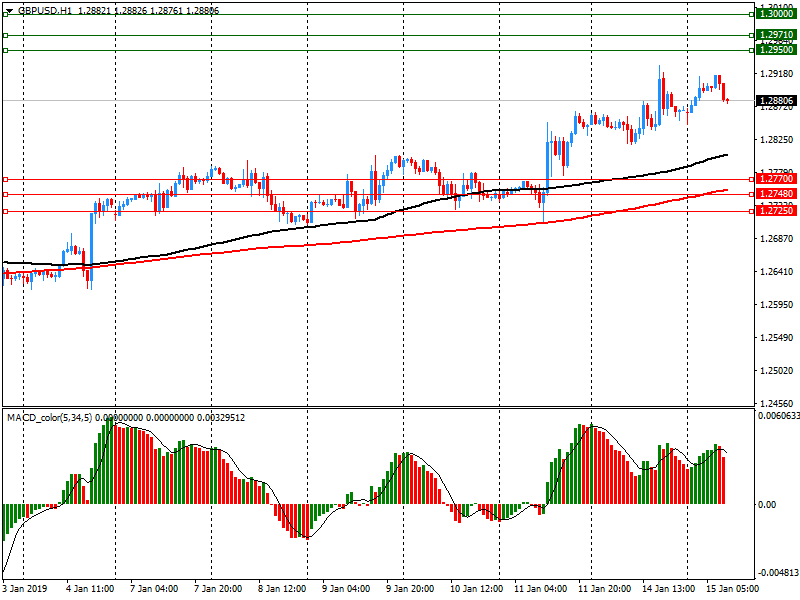
Comments:
- Overall open interest on the CALL options with the expiration date February, 8 is 22781 contracts, with the maximum number of contracts with strike price $1,3200 (1887);
- Overall open interest on the PUT options with the expiration date February, 8 is 24150 contracts, with the maximum number of contracts with strike price $1,2600 (1900);
- The ratio of PUT/CALL was 1.10 versus 1.08 from the previous trading day according to data from January, 14
* - The Chicago Mercantile Exchange bulletin (CME) is used for the calculation.
** - Open interest takes into account the total number of option contracts that are open at the moment.
In December 2018, the Consumer Prices Index (CPI) was stable over a month, after a 0.2% downturn in November. The sharp drop in energy prices (−2.4% after −0.7%) and the downturn in those of manufactured products (−0.2% after +0.1%) were indeed offset by a rebound in the prices of services (+0.4% after −0.3%) and food (+0.6% after −0.2%).
Seasonally adjusted, consumer prices edged down by 0.2% over a month, after a 0.1% downturn in November.
Year on year, consumer prices slowed down for the second consecutive month: +1.6% in December after +1.9% in November and +2.2% in October. This drop in inflation came from a year-on-year slowdown in energy, services and tobacco prices and a larger drop in manufactured product prices. Contrariwise, food prices accelerated.
Food prices fell 0.2 percent in December 2018. After seasonal adjustment, they rose 0.5 percent.
In December 2018 compared with November 2018:
fruit and vegetable prices fell 1.1 percent (down 0.6 percent after seasonal adjustment)
meat, poultry, and fish prices rose 0.2 percent
grocery food prices rose 0.1 percent (up 0.5 percent after seasonal adjustment)
non-alcoholic beverage prices fell 2.6 percent
restaurant meals and ready-to-eat food prices rose 0.2 percent.
Food prices increased 1.0 percent in the year ended December 2018.
In December 2018 compared with December 2017:
fruit and vegetable prices decreased 6.1 percent
meat, poultry, and fish prices increased 3.8 percent
grocery food prices increased 1.4 percent
non-alcoholic beverage prices decreased 0.2 percent
restaurant meals and ready-to-eat food prices increased 2.9 percent.
Theresa May's Brexit agreement has suffered its first official parliamentary defeat as peers registered their opposition to it by 321 votes to 152 with a majority of 169
| Raw materials | Closed | Change, % |
|---|---|---|
| Brent | 59.32 | -2.13 |
| WTI | 50.96 | -1.87 |
| Silver | 15.62 | 0.26 |
| Gold | 1291.332 | 0.26 |
| Palladium | 1320.54 | 0.05 |
| Index | Change, points | Closed | Change, % |
|---|---|---|---|
| Hang Seng | -368.94 | 26298.33 | -1.38 |
| KOSPI | -11.05 | 2064.52 | -0.53 |
| ASX 200 | -1.2 | 5773.4 | -0.02 |
| FTSE 100 | -63.16 | 6855.02 | -0.91 |
| DAX | -31.55 | 10855.91 | -0.29 |
| Dow Jones | -86.11 | 23909.84 | -0.36 |
| S&P 500 | -13.65 | 2582.61 | -0.53 |
| NASDAQ Composite | -65.56 | 6905.92 | -0.94 |
| Pare | Closed | Change, % |
|---|---|---|
| AUDUSD | 0.71957 | -0.11 |
| EURJPY | 124.04 | -0.3 |
| EURUSD | 1.14679 | 0.05 |
| GBPJPY | 139.165 | -0.2 |
| GBPUSD | 1.28668 | 0.15 |
| NZDUSD | 0.68205 | -0.1 |
| USDCAD | 1.32802 | 0.1 |
| USDCHF | 0.9808 | -0.3 |
| USDJPY | 108.155 | -0.35 |


© 2000-2026. All rights reserved.
This site is managed by Teletrade D.J. LLC 2351 LLC 2022 (Euro House, Richmond Hill Road, Kingstown, VC0100, St. Vincent and the Grenadines).
The information on this website is for informational purposes only and does not constitute any investment advice.
The company does not serve or provide services to customers who are residents of the US, Canada, Iran, The Democratic People's Republic of Korea, Yemen and FATF blacklisted countries.
Making transactions on financial markets with marginal financial instruments opens up wide possibilities and allows investors who are willing to take risks to earn high profits, carrying a potentially high risk of losses at the same time. Therefore you should responsibly approach the issue of choosing the appropriate investment strategy, taking the available resources into account, before starting trading.
Use of the information: full or partial use of materials from this website must always be referenced to TeleTrade as the source of information. Use of the materials on the Internet must be accompanied by a hyperlink to teletrade.org. Automatic import of materials and information from this website is prohibited.
Please contact our PR department if you have any questions or need assistance at pr@teletrade.global.
transfers