- Analytics
- News and Tools
- Market News
CFD Markets News and Forecasts — 16-10-2018
| Raw materials | Closing price | % change |
| Oil | $72.16 | +0.53% |
| Gold | $1,228.70 | -0.13% |
| Index | Change items | Closing price | % change |
| Nikkei | +277.94 | 22549.24 | +1.25% |
| TOPIX | +12.47 | 1687.91 | +0.74% |
| Hang Seng | +17.20 | 25462.26 | +0.07% |
| CSI 300 | -25.48 | 3100.97 | -0.81% |
| FTSE 100 | +30.18 | 7059.40 | +0.43% |
| DAX | +162.39 | 11776.55 | +1.40% |
| CAC 40 | +77.98 | 5173.05 | +1.53% |
| DJIA | +547.87 | 25798.42 | +2.17% |
| S&P 500 | +59.13 | 2809.92 | +2.15% |
| NASDAQ | +214.74 | 7645.49 | +2.89% |
| Pare | Closed | % change |
| EUR/USD | $1,1572 | -0,08% |
| GBP/USD | $1,3183 | +0,24% |
| USD/CHF | Chf0,9903 | +0,34% |
| USD/JPY | Y112,28 | +0,46% |
| EUR/JPY | Y129,93 | +0,38% |
| GBP/JPY | Y148,033 | +0,70% |
| AUD/USD | $0,7141 | +0,05% |
| NZD/USD | $0,6584 | -0,13% |
| USD/CAD | C$1,2934 | -0,38% |

The number of job openings reached a series high of 7.1 million on the last business day of August, the U.S. Bureau of Labor Statistics reported today. Over the month, hires and separations were little changed at 5.8 million and 5.7 million, respectively. Within separations, the quits rate was unchanged at 2.4 percent and the layoffs and discharges rate was little changed at 1.2 percent. This release includes estimates of the number and rate of job openings, hires, and separations for the nonfarm sector by industry and by four geographic regions.
U.S. stock-index futures indicated a higher open on Tuesday, as numerous strong earnings helped lift investor sentiment.
Global Stocks:
| Index/commodity | Last | Today's Change, points | Today's Change, % |
| Nikkei | 22,549.24 | +277.94 | +1.25% |
| Hang Seng | 25,462.26 | +17.20 | +0.07% |
| Shanghai | 2,546.33 | -21.76 | -0.85% |
| S&P/ASX | 5,869.90 | +32.80 | +0.56% |
| FTSE | 7,031.65 | +2.43 | +0.03% |
| CAC | 5,134.85 | +39.78 | +0.78% |
| DAX | 11,697.70 | +83.54 | +0.72% |
| Crude | $71.43 | | -0.49% |
| Gold | $1,233.20 | | +0.24% |
Industrial production increased 0.3 percent in September, about the same rate of change as in the previous two months. Output growth in September was held down slightly by Hurricane Florence, with an estimated effect of less than 0.1 percentage point. For the third quarter as a whole, total industrial production advanced at an annual rate of 3.3 percent. In September, manufacturing output moved up 0.2 percent for its fourth consecutive monthly increase, while the output of utilities was unchanged. The index for mining increased 0.5 percent and has moved up in each of the past eight months. At 108.5 percent of its 2012 average, total industrial production was 5.1 percent higher in September than it was a year earlier. Capacity utilization for the industrial sector was unchanged at 78.1 percent, a rate that is 1.7 percentage points below its long-run (1972-2017) average.
(company / ticker / price / change ($/%) / volume)
| 3M Co | MMM | 201.77 | 2.83(1.42%) | 183 |
| ALCOA INC. | AA | 35.61 | 0.27(0.76%) | 700 |
| ALTRIA GROUP INC. | MO | 61.68 | 0.24(0.39%) | 100 |
| Amazon.com Inc., NASDAQ | AMZN | 1,781.99 | 21.04(1.19%) | 43369 |
| Apple Inc. | AAPL | 219.1 | 1.74(0.80%) | 167281 |
| AT&T Inc | T | 32.5 | 0.14(0.43%) | 9131 |
| Barrick Gold Corporation, NYSE | ABX | 12.65 | -0.05(-0.39%) | 56252 |
| Boeing Co | BA | 361.75 | 2.87(0.80%) | 4238 |
| Chevron Corp | CVX | 116.99 | 0.05(0.04%) | 1174 |
| Cisco Systems Inc | CSCO | 45.31 | 0.64(1.43%) | 51188 |
| Citigroup Inc., NYSE | C | 69.6 | 0.39(0.56%) | 5642 |
| Exxon Mobil Corp | XOM | 80.97 | 0.15(0.19%) | 2258 |
| Facebook, Inc. | FB | 154.64 | 1.12(0.73%) | 49108 |
| Ford Motor Co. | F | 8.85 | 0.04(0.45%) | 47183 |
| Freeport-McMoRan Copper & Gold Inc., NYSE | FCX | 12.79 | -0.04(-0.31%) | 10800 |
| General Electric Co | GE | 12.2 | 0.05(0.41%) | 169574 |
| General Motors Company, NYSE | GM | 32.35 | 0.23(0.72%) | 1350 |
| Goldman Sachs | GS | 218.25 | 3.03(1.41%) | 80526 |
| Google Inc. | GOOG | 1,099.60 | 7.35(0.67%) | 2493 |
| Hewlett-Packard Co. | HPQ | 23.65 | 0.09(0.38%) | 219 |
| Home Depot Inc | HD | 192.25 | 1.08(0.56%) | 950 |
| Intel Corp | INTC | 44.86 | 0.33(0.74%) | 18517 |
| International Business Machines Co... | IBM | 141.57 | 0.44(0.31%) | 5650 |
| International Paper Company | IP | 42.53 | -0.17(-0.40%) | 3015 |
| Johnson & Johnson | JNJ | 133.99 | 0.04(0.03%) | 34499 |
| JPMorgan Chase and Co | JPM | 107 | 0.66(0.62%) | 16167 |
| McDonald's Corp | MCD | 165.02 | 1.35(0.82%) | 1271 |
| Microsoft Corp | MSFT | 108.89 | 1.29(1.20%) | 46851 |
| Pfizer Inc | PFE | 43.3 | 0.18(0.42%) | 3535 |
| Procter & Gamble Co | PG | 80.4 | 0.27(0.34%) | 1696 |
| Starbucks Corporation, NASDAQ | SBUX | 56.9 | 0.15(0.26%) | 1638 |
| Tesla Motors, Inc., NASDAQ | TSLA | 262.54 | 2.95(1.14%) | 29197 |
| Twitter, Inc., NYSE | TWTR | 28.99 | 0.38(1.33%) | 22220 |
| United Technologies Corp | UTX | 130.91 | 0.58(0.45%) | 330 |
| UnitedHealth Group Inc | UNH | 265.7 | 5.45(2.09%) | 15357 |
| Verizon Communications Inc | VZ | 53.72 | 0.12(0.22%) | 295 |
| Visa | V | 138.5 | 1.27(0.93%) | 9429 |
| Wal-Mart Stores Inc | WMT | 93.86 | 0.04(0.04%) | 96672 |
| Walt Disney Co | DIS | 114.02 | 0.58(0.51%) | 7597 |
| Yandex N.V., NASDAQ | YNDX | 34.5 | 1.30(3.92%) | 61996 |
Altria (MO) initiated with Mkt Perform at Bernstein
Facebook (FB) initiated with Buy at Loop Capital; target $210
Merck (MRK) target raised to $79 from $70 at Citigroup
Foreign investment in Canadian securities slowed to $2.8 billion in August, down from $15.3 billion in July. At the same time, Canadian investors reduced their holdings of foreign securities by $194 million as they acquired bonds but sold equities.
As a result, Canada's international transactions in securities generated a net inflow of funds in the economy of $3.0 billion in August.
Foreign holdings of Canadian bonds were down $7.4 billion in August, as non-residents reduced their holdings of both government and corporate bonds. This decline followed investment of $12.7 billion in July. The reduction in holdings of government bonds in August was all in federal bonds (-$3.8 billion). Foreign investors reduced their exposure to federal government bonds for the eighth time in nine months, totalling $33.1 billion over the period.
Goldman Sachs (GS) reported Q3 FY 2018 earnings of $6.28 per share (versus $5.02 in Q3 FY 2017), beating analysts' consensus estimate of $5.34.
The company's quarterly revenues amounted to $8.646 bln (+3.8% y/y), beating analysts' consensus estimate of $8.430 bln.
GS rose to $217.55 (+1.08%) in pre-market trading.
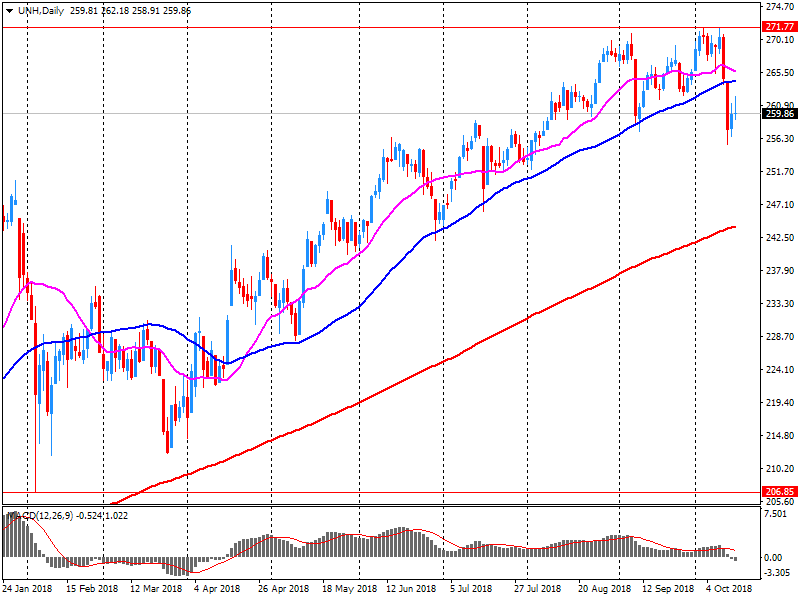
UnitedHealth (UNH) reported Q3 FY 2018 earnings of $3.41 per share (versus $2.66 in Q3 FY 2017), beating analysts' consensus estimate of $3.30.
The company's quarterly revenues amounted to $56.556 bln (+12.4% y/y), generally in-line with analysts' consensus estimate of $56.336 bln.
UNH rose to $263.10 (+2.10%) in pre-market trading.
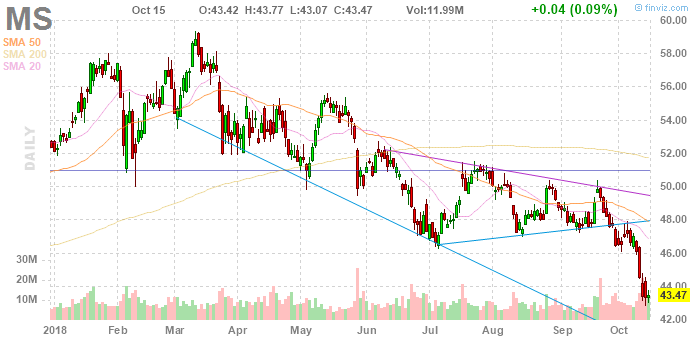
Morgan Stanley (MS) reported Q3 FY 2018 earnings of $1.17 per share (versus $0.93 in Q3 FY 2017), beating analysts' consensus estimate of $1.01.
The company's quarterly revenues amounted to $9.872 bln (+7.3% y/y), beating analysts' consensus estimate of $. bln.
MS rose to $44.73 (+2.90%) in pre-market trading.
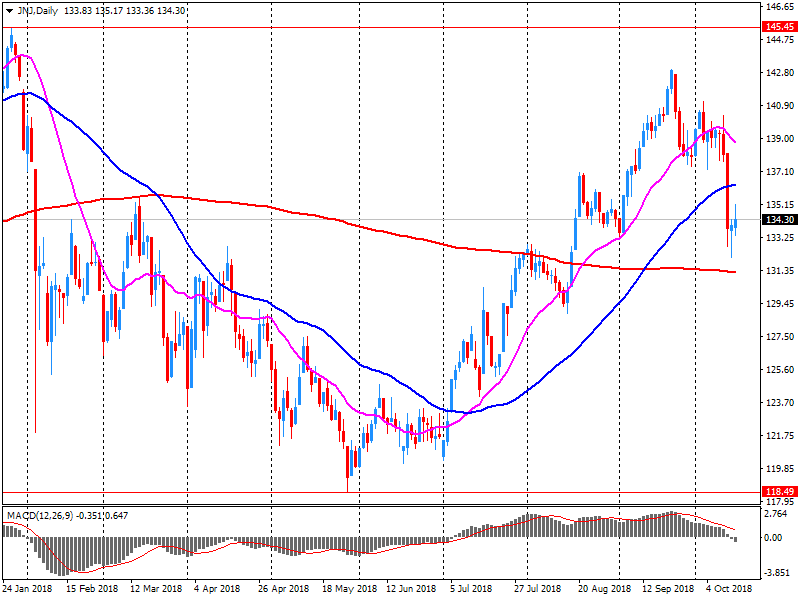
Johnson & Johnson (JNJ) reported Q3 FY 2018 earnings of $2.05 per share (versus $1.90 in Q3 FY 2017), beating analysts' consensus estimate of $2.03.
The company's quarterly revenues amounted to $20.348 bln (+3.6% y/y), beating analysts' consensus estimate of $20.053 bln.
The company also raised guidance for FY 2018, projecting EPS of $8.13-8.18 (versus analysts' consensus estimate of $8.15 and compared to $8.07-8.17 prior) and revenues of $81.0-81.4 bln (versus analysts' consensus estimate of $81.26 bln and compared to $80.5-81.3 bln prior).
JNJ rose to $134.00 (+0.04%) in pre-market trading.
The indicator has thus reached the same low-point as in July of this year, being at its lowest reading since August 2012. Also, with 14.1 points, the extent of the month-to-month decline is remarkably strong. Only once in the recent past did the indicator fall more strongly, namely after the Brexit vote in Great Britain in July 2016. The indicator's current value is far below the long-term average of 22.8 points. The assessment of the current economic situation in Germany decreased by 5.9 points, leaving the corresponding indicator at 70.1 points.
The first estimate for euro area (EA19) exports of goods to the rest of the world in August 2018 was €181.5 billion, an increase of 5.6% compared with August 2017 (€171.9 bn). Imports from the rest of the world stood at €169.8 bn, a rise of 8.4% compared with August 2017 (€156.6 bn). As a result, the euro area recorded a €11.7 bn surplus in trade in goods with the rest of the world in August 2018, compared with +€15.3 bn in August 2017. Intra-euro area trade rose to €140.7 bn in August 2018, up by 5.1% compared with August 2017.
In January to August 2018, euro area exports of goods to the rest of the world rose to €1 501.1 bn (an increase of 4.3% compared with January-August 2017), while imports rose to €1 371.4 bn (an increase of 5.5% compared with January-August 2017). As a result the euro area recorded a surplus of €129.6 bn, compared with +€140.4 bn in January-August 2017. Intra-euro area trade rose to €1 286.9 bn in January-August 2018, up by 6.2% compared with January-August 2017.
Latest estimates show that average weekly earnings for employees in Great Britain increased by 3.1% excluding bonuses, and by 2.7% including bonuses, compared with a year earlier.
Latest estimates show that average weekly earnings for employees in Great Britain in real terms (that is, adjusted for price inflation) increased by 0.7% excluding bonuses, and by 0.4% including bonuses, compared with a year earlier.
Estimates from the Labour Force Survey show that, between March to May 2018 and June to August 2018, the number of people in work was little changed, the number of unemployed people decreased but the number of people aged from 16 to 64 years not working and not seeking or available to work (economically inactive) increased.
There were 32.39 million people in work, little changed compared with March to May 2018 but 289,000 more than for a year earlier.
The unemployment rate (the number of unemployed people as a proportion of all employed and unemployed people) was 4.0%; it has not been lower since December 1974 to February 1975.
-
EU Has Gone A Long Way Toward UK Position On Brexit
-
recent modest fall in AUD helpful for domestic economic growth
-
findings of Royal Commission could lead banks to further tighten lending standards
-
important to measure supply of credit so that economy continued to be supported
-
RBA noted modest increase in banks' funding costs, mortgage rates still low after recent rises
-
home prices had fallen noticeably in Sydney and Melbourne, following previous strong gains
-
uncertain on consumption given subdued income growth, falling home prices
Consumer prices in China were up 2.5 percent on year in September, the National Bureau of Statistics said on Tuesday.
That was in line with expectations and up from 2.3 percent in August.
The statistics bureau also said that producer prices climbed an annual 3.6 percent - exceeding forecasts for 3.5 percent and down from 4.1 percent in the previous month.
EUR/USD
Resistance levels (open interest**, contracts)
$1.1732 (1782)
$1.1710 (2065)
$1.1678 (457)
Price at time of writing this review: $1.1579
Support levels (open interest**, contracts):
$1.1531 (4424)
$1.1498 (3364)
$1.1462 (2989)
Comments:
- Overall open interest on the CALL options and PUT options with the expiration date November, 19 is 79142 contracts (according to data from October, 15) with the maximum number of contracts with strike price $1,1600 (4424);
GBP/USD
Resistance levels (open interest**, contracts)
$1.3332 (2167)
$1.3292 (1012)
$1.3250 (707)
Price at time of writing this review: $1.3163
Support levels (open interest**, contracts):
$1.3106 (457)
$1.3084 (467)
$1.3060 (649)
Comments:
- Overall open interest on the CALL options with the expiration date November, 19 is 23393 contracts, with the maximum number of contracts with strike price $1,3500 (3480);
- Overall open interest on the PUT options with the expiration date November, 19 is 27150 contracts, with the maximum number of contracts with strike price $1,3000 (2980);
- The ratio of PUT/CALL was 1.16 versus 1.11 from the previous trading day according to data from October, 15
* - The Chicago Mercantile Exchange bulletin (CME) is used for the calculation.
** - Open interest takes into account the total number of option contracts that are open at the moment.
In the September 2018 quarter compared with the June 2018 quarter, the CPI rose 0.9 percent (up 0.8 percent with seasonal adjustment).
Transport rose 2.4 percent, influenced by higher prices for petrol (up 5.5 percent).
Housing and household utilities rose 1.1 percent, influenced by higher prices for local authority rates (up 5.1 percent), construction (up 1.3 percent), and rentals for housing (up 0.4 percent).
Food prices rose 0.6 percent, influenced by higher prices for vegetables (up 11 percent).
From the September 2017 quarter to the September 2018 quarter, the CPI inflation rate was 1.9 percent.
Housing and household utilities increased 3.1 percent, with construction up 4.1 percent, rentals for housing up 2.3 percent, and local authority rates up 5.1 percent.
Transport increased 5.6 percent, with petrol up 19 percent.
Alcoholic beverages and tobacco increased 4.7 percent, with cigarettes and tobacco up 11 percent, mainly due to an increase in excise duties for tobacco and tobacco products.
As reported by the Federal Statistical Office (Destatis), the index of import prices increased by 4.8% in August 2018 compared with the corresponding month of the preceding year. In July and in June 2018 the annual rates of change were +4.8% and +4.4%, respectively. From July 2018 to August 2018 the index did not change.
The index of import prices, excluding crude oil and mineral oil products, increased by 2.5% compared with the level of a year earlier.
The index of export prices increased by 2.1% in August 2018 compared with the corresponding month of the preceding year. In July and in June 2018 the annual rates of change were +1.7% and +1.5%, respectively. From July 2018 to August 2018 the export price index increased by 0.2%.


© 2000-2026. All rights reserved.
This site is managed by Teletrade D.J. LLC 2351 LLC 2022 (Euro House, Richmond Hill Road, Kingstown, VC0100, St. Vincent and the Grenadines).
The information on this website is for informational purposes only and does not constitute any investment advice.
The company does not serve or provide services to customers who are residents of the US, Canada, Iran, The Democratic People's Republic of Korea, Yemen and FATF blacklisted countries.
Making transactions on financial markets with marginal financial instruments opens up wide possibilities and allows investors who are willing to take risks to earn high profits, carrying a potentially high risk of losses at the same time. Therefore you should responsibly approach the issue of choosing the appropriate investment strategy, taking the available resources into account, before starting trading.
Use of the information: full or partial use of materials from this website must always be referenced to TeleTrade as the source of information. Use of the materials on the Internet must be accompanied by a hyperlink to teletrade.org. Automatic import of materials and information from this website is prohibited.
Please contact our PR department if you have any questions or need assistance at pr@teletrade.global.
transfers