- Analytics
- News and Tools
- Market News
CFD Markets News and Forecasts — 21-10-2024
- EUR/USD shed nearly half of a percent to open another trading week.
- Markets pivoted back into the Greenback on renewed skepticism on the pace of rate cuts.
- Heavy appearances from central bank member due throughout the week.
EUR/USD fumbled on Monday, kicking off a new trading week with a downside push as price action waffled back into familiar 12-week lows just above the 1.0800 handle. Markets remain apprehensive on the future pace of rate cuts, specifically from the Federal Reserve (Fed), and Purchasing Managers Index (PMI) activity figures due later in the week will give investors a glimpse at the shape of the global economy in the coming weeks.
European Central Bank (ECB) President Christine Lagarde is slated to make several appearances this week. The ECB head’s key public outing will be on Wednesday when ECB President Lagarde will speak on Europe’s current financial challenges at the Atlantic Council in Washington DC.
Global PMI figures are due for a rolling release on Thursday. Markets have high expectations for pan-EU PMI survey results, with median market forecasts calling for a slight uptick in October’s EU Services PMI to 51.6 from September’s 51.4.
EUR/USD price forecast
The EUR/USD pair continues to trade with a bearish bias, currently hovering around 1.0815 after a decisive break below both the 50-day EMA at 1.0990 and the 200-day EMA at 1.0902. The price action confirms that the bears remain firmly in control as the pair consolidates near its recent lows. The inability to regain ground above the 200-day EMA indicates that downside momentum is likely to persist. Immediate support rests at 1.0800, with further declines possibly targeting the 1.0700 region if bearish pressure intensifies.
The MACD indicator further reinforces the bearish outlook, with both the MACD line and signal line in negative territory, and the histogram expanding to the downside. This signals increasing bearish momentum, which suggests that any attempts by the bulls to recover could face strong resistance. A sustained move above 1.0900 is required to shift the bias back to neutral, but without a clear bullish catalyst, the path of least resistance remains to the downside in the near term.
EUR/USD daily chart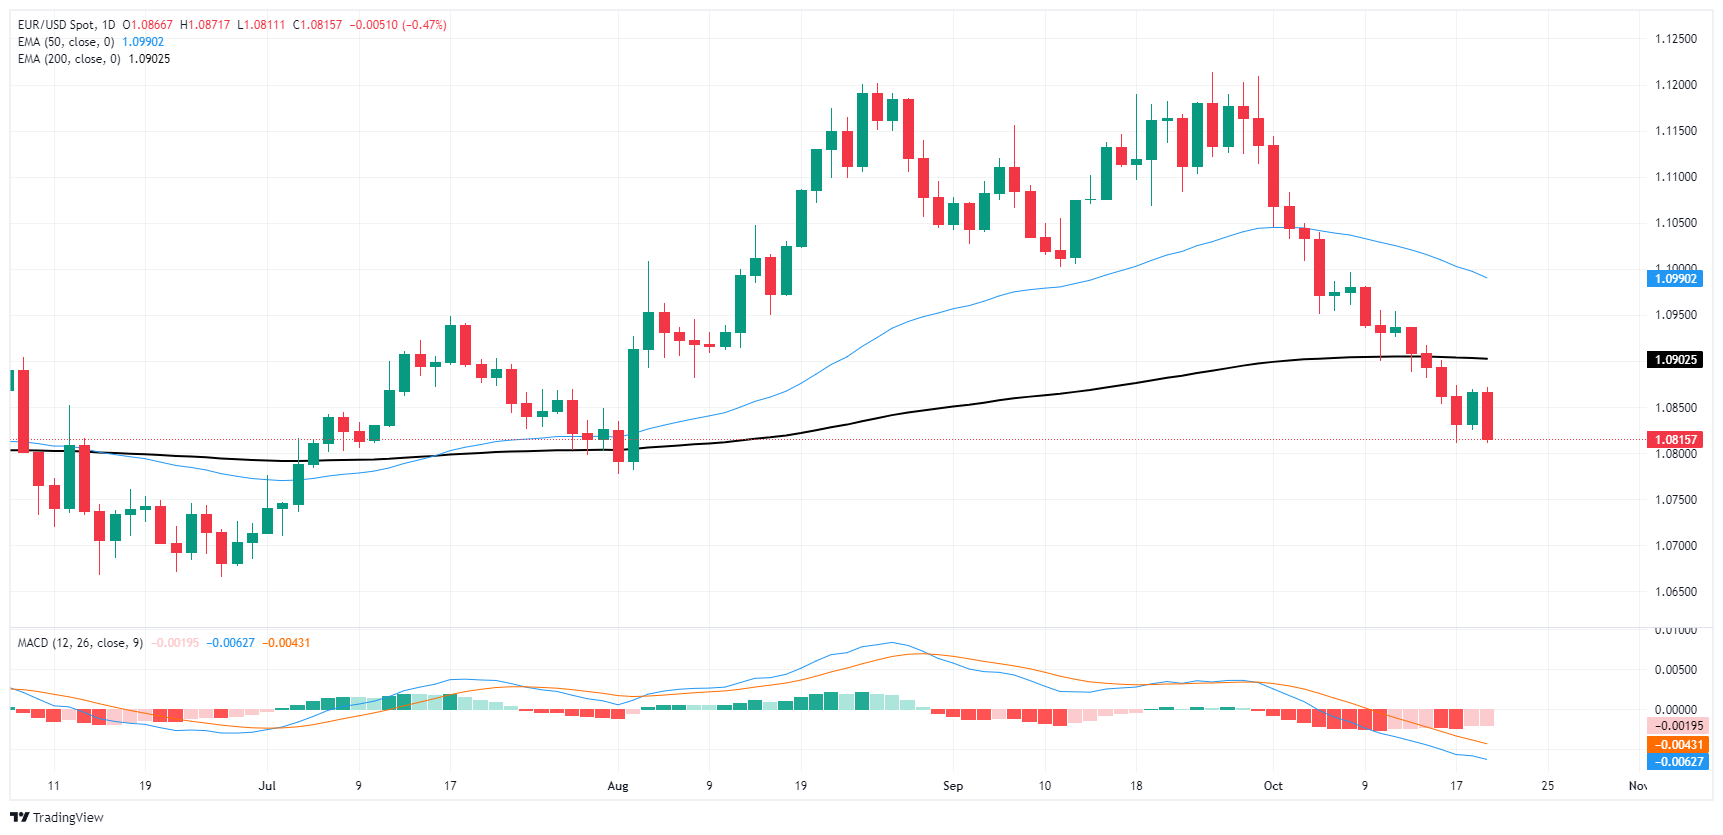
Euro FAQs
The Euro is the currency for the 19 European Union countries that belong to the Eurozone. It is the second most heavily traded currency in the world behind the US Dollar. In 2022, it accounted for 31% of all foreign exchange transactions, with an average daily turnover of over $2.2 trillion a day. EUR/USD is the most heavily traded currency pair in the world, accounting for an estimated 30% off all transactions, followed by EUR/JPY (4%), EUR/GBP (3%) and EUR/AUD (2%).
The European Central Bank (ECB) in Frankfurt, Germany, is the reserve bank for the Eurozone. The ECB sets interest rates and manages monetary policy. The ECB’s primary mandate is to maintain price stability, which means either controlling inflation or stimulating growth. Its primary tool is the raising or lowering of interest rates. Relatively high interest rates – or the expectation of higher rates – will usually benefit the Euro and vice versa. The ECB Governing Council makes monetary policy decisions at meetings held eight times a year. Decisions are made by heads of the Eurozone national banks and six permanent members, including the President of the ECB, Christine Lagarde.
Eurozone inflation data, measured by the Harmonized Index of Consumer Prices (HICP), is an important econometric for the Euro. If inflation rises more than expected, especially if above the ECB’s 2% target, it obliges the ECB to raise interest rates to bring it back under control. Relatively high interest rates compared to its counterparts will usually benefit the Euro, as it makes the region more attractive as a place for global investors to park their money.
Data releases gauge the health of the economy and can impact on the Euro. Indicators such as GDP, Manufacturing and Services PMIs, employment, and consumer sentiment surveys can all influence the direction of the single currency. A strong economy is good for the Euro. Not only does it attract more foreign investment but it may encourage the ECB to put up interest rates, which will directly strengthen the Euro. Otherwise, if economic data is weak, the Euro is likely to fall. Economic data for the four largest economies in the euro area (Germany, France, Italy and Spain) are especially significant, as they account for 75% of the Eurozone’s economy.
Another significant data release for the Euro is the Trade Balance. This indicator measures the difference between what a country earns from its exports and what it spends on imports over a given period. If a country produces highly sought after exports then its currency will gain in value purely from the extra demand created from foreign buyers seeking to purchase these goods. Therefore, a positive net Trade Balance strengthens a currency and vice versa for a negative balance.
- GBP/USD shed half of a percent as the Pound’s recovery against the US Dollar abruptly ends.
- Looming BoE appearances and global PMI figures to keep Pound momentum capped this week.
- Investors bucked on Monday after Fed officials cautioned that the pace of rate cuts may slow.
GBP/USD twisted into the low side on Monday, kicking off the new trading week with a fresh test south of the 1.3000 handle as Cable traders balk ahead of a hectic week that sees a slew of appearances from central bank figures, as well as an update on global Purchasing Managers Index (PMI) figures.
Pound Sterling traders will be keeping an eye out for an appearance from Bank of England (BoE) Governor Andrew Bailey on Tuesday. However, the BoE head’s comments will be coming much later in the day as Bailey will be delivering speech notes at the Bloomberg Global Regulatory Forum in New York during the early US market session.
Global PMI figures are slated for a rolling release on Thursday, with UK figures kicking off the Cable docket. Median market forecasts are expecting a slight downtick in UK activity numbers, with October’s Services PMI specifically expected to ease to 52.2 from 52.4 the previous month.
GBP/USD price forecast
The GBP/USD pair continues to trade with a bearish bias, currently hovering near 1.2982 after failing to hold above the 1.3000 psychological level. The price is trading below the 50-day EMA at 1.3089, signaling that the bears are in control of the short-term trend. The next key support lies at 1.2845, where the 200-day EMA resides, offering potential downside protection. If sellers maintain pressure, a break below this long-term support could accelerate further losses towards 1.2800.
The MACD indicator paints a weak picture, with the histogram showing expanding negative momentum as the MACD line remains below the signal line, reinforcing the bearish outlook. Bulls are struggling to regain traction, and the pair's failure to break above the 50-day EMA adds to the downside risks. A daily close below 1.2900 could further confirm the bearish sentiment, while a bounce back above 1.3100 is needed to restore the pair's upside potential.
GBP/USD daily chart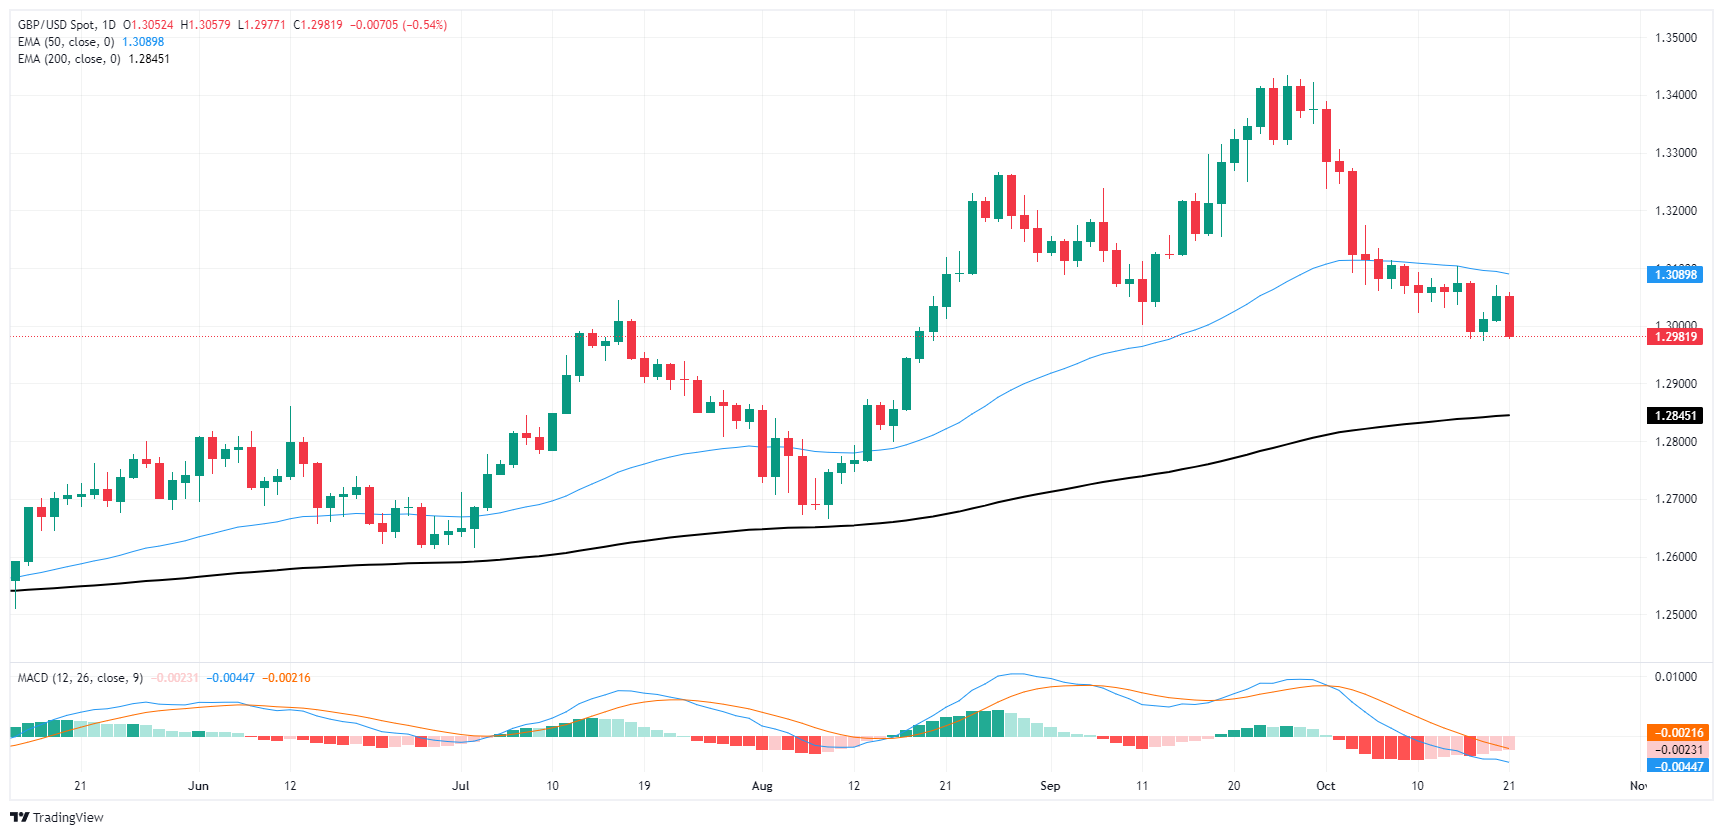
Pound Sterling FAQs
The Pound Sterling (GBP) is the oldest currency in the world (886 AD) and the official currency of the United Kingdom. It is the fourth most traded unit for foreign exchange (FX) in the world, accounting for 12% of all transactions, averaging $630 billion a day, according to 2022 data. Its key trading pairs are GBP/USD, also known as ‘Cable’, which accounts for 11% of FX, GBP/JPY, or the ‘Dragon’ as it is known by traders (3%), and EUR/GBP (2%). The Pound Sterling is issued by the Bank of England (BoE).
The single most important factor influencing the value of the Pound Sterling is monetary policy decided by the Bank of England. The BoE bases its decisions on whether it has achieved its primary goal of “price stability” – a steady inflation rate of around 2%. Its primary tool for achieving this is the adjustment of interest rates. When inflation is too high, the BoE will try to rein it in by raising interest rates, making it more expensive for people and businesses to access credit. This is generally positive for GBP, as higher interest rates make the UK a more attractive place for global investors to park their money. When inflation falls too low it is a sign economic growth is slowing. In this scenario, the BoE will consider lowering interest rates to cheapen credit so businesses will borrow more to invest in growth-generating projects.
Data releases gauge the health of the economy and can impact the value of the Pound Sterling. Indicators such as GDP, Manufacturing and Services PMIs, and employment can all influence the direction of the GBP. A strong economy is good for Sterling. Not only does it attract more foreign investment but it may encourage the BoE to put up interest rates, which will directly strengthen GBP. Otherwise, if economic data is weak, the Pound Sterling is likely to fall.
Another significant data release for the Pound Sterling is the Trade Balance. This indicator measures the difference between what a country earns from its exports and what it spends on imports over a given period. If a country produces highly sought-after exports, its currency will benefit purely from the extra demand created from foreign buyers seeking to purchase these goods. Therefore, a positive net Trade Balance strengthens a currency and vice versa for a negative balance.
Federal Reserve (Fed) Bank of San Francisco President Mary Daly noted late Monday that while she expects the Fed to continue slowly easing interest rates lower in the coming quarters, the Fed is still maintaining a data-dependent approach.
Key highlights
Daly sees ongoing rate cuts in the near future.
Labor market slowdown is unwanted.
No reason to halt rate cuts, monetary policy remains tight.
Businesses are reporting headcount management through attrition, not layoffs.
Soft landing best achieved by adjusting policy rates as inflation declines.
Consumers' shift to lower-priced items demonstrates restricted pricing influence.
Neutral rate estimate at 2.5% to 3%.
Fed will learn through experience where neutral rate is.
- NZD/USD plunges, technical outlook remains bearish.
- RSI nears oversold zone, hinting at potential correction.
- MACD suggests persistent bearish momentum.
In Monday's session, the NZD/USD pair extended its downward trajectory, depreciating by a significant 0.70% to settle at 0.6030. The technical indicators maintain a bearish stance, signaling a possible continuation of the selling pressure that has characterized recent trading.
The Relative Strength Index (RSI) remains near the oversold area, with a reading of 35 and a descending slope. This indicates a rise in selling pressure, suggesting that the bears continue to exert their influence. However, the proximity to the oversold zone raises the possibility of a corrective bounce if the selling momentum wanes. The Moving Average Convergence Divergence (MACD) histogram, displaying rising red bars, confirms the bearish trend. The histogram's upward movement indicates increasing bearish momentum, while the red color denotes a negative trend.
NZD/USD daily chart
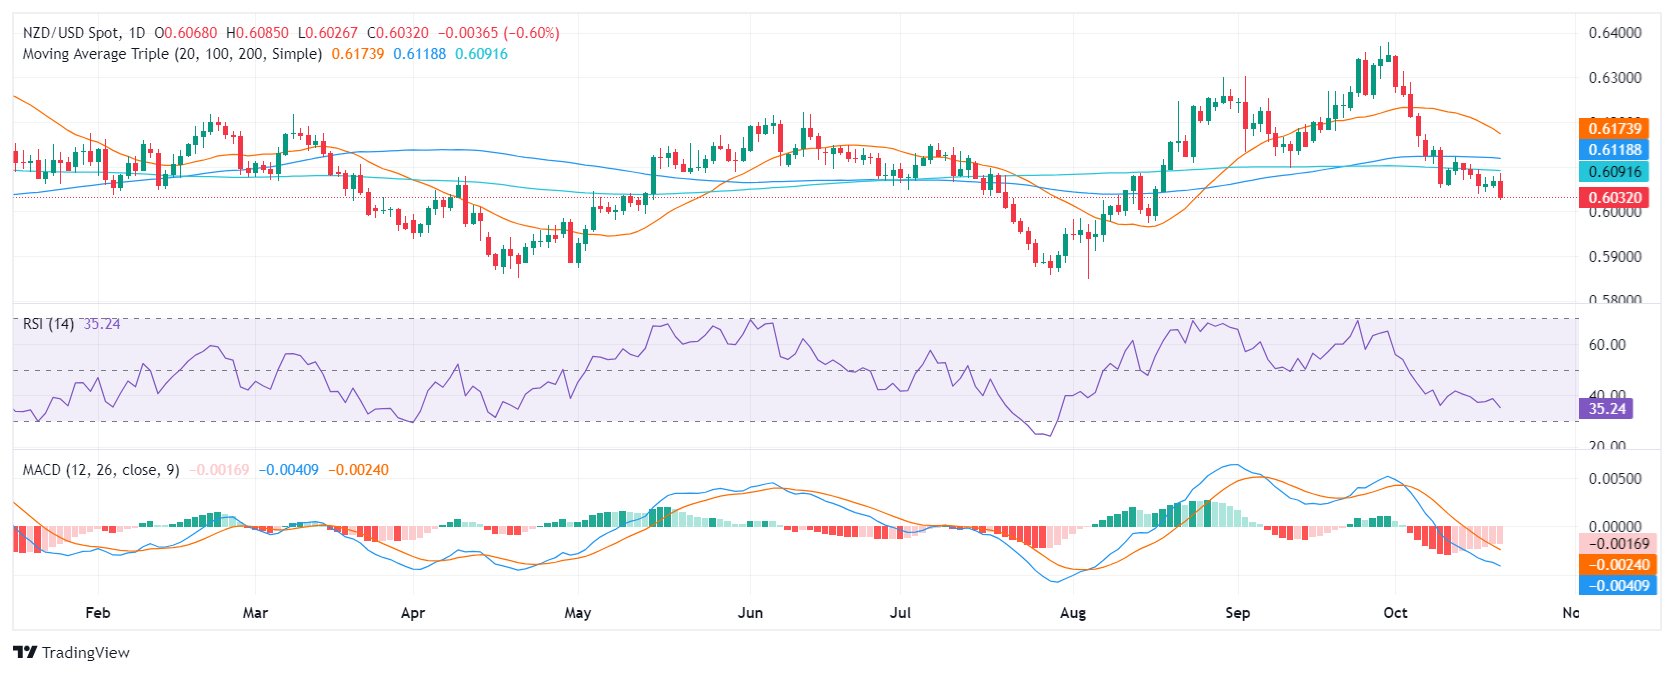
The NZD/USD pair faces significant technical challenges, indicating a bearish outlook. The pair has been trading below key support levels, including the critical 100 and 200-day Simple Moving Averages (SMAs), which currently reside around 0.6100. The pair now stands in lows since mid-August and it may be set for further downside if buyers don’t step in.
If selling continues, the next support is around 0.6000. Conversely, a recovery might see immediate resistance emerging around 0.6060,0.6080 and 0.6100.
Federal Reserve (Fed) Bank of Kansas President Jeffrey Schmid hit newswires late Monday, noting that recent downturns in US data is more likely a normalization of US labor markets after a period of record over-employment and untenably low unemployment rates, rather than an outright deterioration in the overall US labor market.
Key highlights
Schmid urges careful, steady, and purposeful method for reducing interest rates.
Rates to settle significantly higher than pre-pandemic levels.
Fed must prevent significant fluctuations in interest rates.
"Reasonably confident" that inflation is heading in the right direction.
Data to determine rate policy.
Sees a normalization of labor market, not deterioration.
Would prefer to avoid outsized rate cuts, supports measured and gradual strategy for policy
.Favors shorter duration and smaller balance sheet, and prefers a relatively aggressive approach to balance sheet reduction.
- NZD/JPY sees modest gains on the day, and buying pressure rises somewhat.
- The uptrend momentum is capped by flat selling pressure, leading to neutral momentum.
- The 20-day SMA remains a crucial support level with bears unable to breach it.
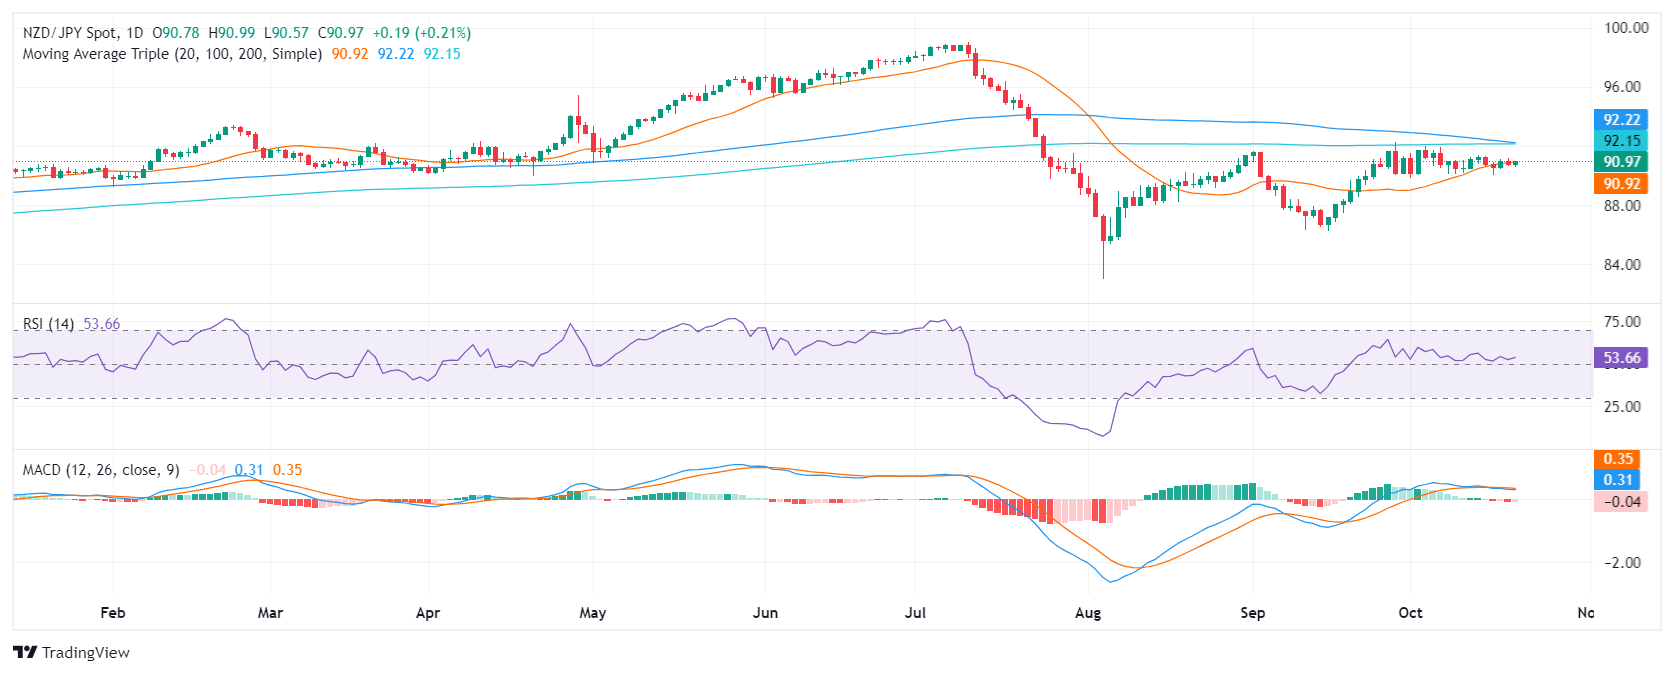
In Tuesday's trading session, the NZD/JPY pair has risen by 0.20% to 90.95, reflecting a slight bullish sentiment on the session. On the bigger picture, the pair continues to trade within a narrow range, with buyers and sellers in a tussle for dominance.
Technical indicators provide a mixed outlook for NZD/JPY. The Relative Strength Index (RSI) for NZD/JPY has mildly climbed to 54, indicating a positive buying trend that is growing in strength. This suggests that buyers are regaining momentum and may push the pair higher.
On the other hand, the Moving Average Convergence Divergence (MACD) histogram remains flat and red, showing that selling pressure is currently weak but persistent. Due to the opposing signals from the RSI and the MACD, the pair's momentum can be considered neutral for now.
The key support and resistance levels remain unchanged, with support at 90.65, 90.95, and 91.15, and resistance at 91.35, 92.00, and 92.15. These price level are set to play a pivotal role in determining the pair's future direction. The 20-day SMA, a pivotal support level, has been instrumental in preventing the pair's slide and will likely continue to do so in the near term.
NZD/JPY daily chart
- Gold trades just below its record high, down 0.09%, as US Treasury yields rise over 10 basis points, reaching 4.192%.
- Safe-haven flows continue amid Middle East hostilities and US election uncertainty with polls showing a tight race between Harris and Trump.
- Fed officials hint at gradual rate cuts, but a 25 bps cut at the November meeting remains heavily priced in.
Gold prices hit another record high during Monday’s North American session, yet it paused its advance amid elevated US Treasury bond yields and a strong US Dollar. Tensions in the Middle East and uncertainty around the presidential election in the United States (US) increased flows toward safe-haven assets during the last five trading days. At the time of writing, XAU/USD trades at $2,718, slightly down 0.09%.
Market sentiment shifted negatively amid a close race in the US election. Reuters revealed that Vice President Kamala Harris leads former President Donald Trump 45% to 42% in the popular vote. However, the winner will be determined by the state-by-state results of the Electoral College.
“Polls have shown Harris and Trump are neck and neck in those battleground states, with many results within the margins of error,” via Reuters.
In the meantime, US Treasury bond yields soared over ten basis points higher to 4.192%. Consequently, the US Dollar Index (DXY), which tracks the buck’s value against a basket of six currencies, has risen 0.50%, hitting a new two-month peak at 104.01.
Hostilities in the Middle East continued as Israel revealed that a projectile from Lebanon hit an open area in central Israel. Meanwhile, Iran’s envoy to the United Nations said that Biden's remarks in Berlin on Israel’s plan to attack the country are “inflammatory.”
Federal Reserve (Fed) officials crossed the wires. Dallas Fed President Lorie Logan said they need to be nimble with monetary policy, adding to the chorus of gradually lowering borrowing costs.
Minneapolis Fed President Neel Kashkari has echoed Logan’s comments, saying that he sees modest cuts over the next quarters while adding that evidence of weakness in the labor market could spark faster rate cuts. He added that the Fed “definitely” wants to avoid a recession.
Despite that, the Fed is heavily expected to lower interest rates by 25 basis points at the November meeting. Odds remained at 87%, according to CME FedWatch Tool data.
Daily digest market movers: Gold price climbs, ignoring upbeat US data
- US Initial Jobless Claims for the week ending October 19 are expected to rise from 241K to 247K.
- US business activity in October is projected to improve in the manufacturing sector, according to S&P Global, while the Services PMI is expected to dip slightly from 55.2 to 55.
- Data from the Chicago Board of Trade, based on the December Fed funds rate futures contract, indicates that investors estimate 46 basis points (bps) of Fed easing by the end of the year, which is slightly lower compared to a week ago.
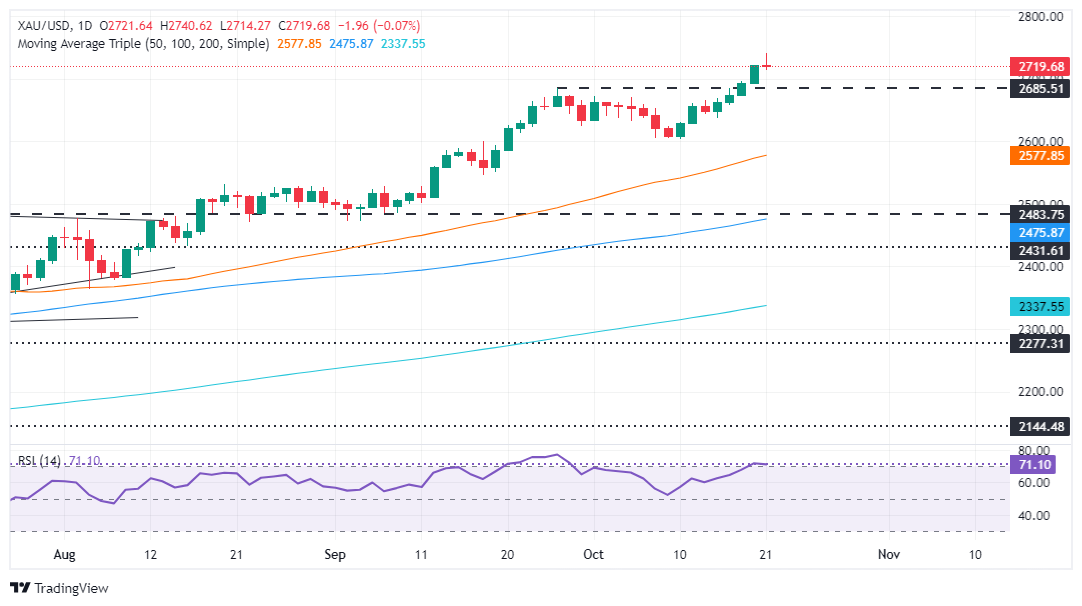
XAU/USD technical outlook: Gold price retraces below $2,720
Gold prices are set to extend the gains, though the formation of a ‘gravestone doji’ could open the door for a pullback.
Momentum shows signs that buyers remain in charge but are losing some steam as depicted by the Relative Strength Index (RSI). The RSI, despite being bullish, has shifted flat.
If XAU/USD clears the October 21 high at $2,740, the next stop would be $2,750, followed by $2,800.
Conversely, if XAU/USD retreats from record highs below $2,700, it could pave the way for a pullback. The first support would be the October 17 high at $2,696, followed by the October 4 high at $2,670.
Gold FAQs
Gold has played a key role in human’s history as it has been widely used as a store of value and medium of exchange. Currently, apart from its shine and usage for jewelry, the precious metal is widely seen as a safe-haven asset, meaning that it is considered a good investment during turbulent times. Gold is also widely seen as a hedge against inflation and against depreciating currencies as it doesn’t rely on any specific issuer or government.
Central banks are the biggest Gold holders. In their aim to support their currencies in turbulent times, central banks tend to diversify their reserves and buy Gold to improve the perceived strength of the economy and the currency. High Gold reserves can be a source of trust for a country’s solvency. Central banks added 1,136 tonnes of Gold worth around $70 billion to their reserves in 2022, according to data from the World Gold Council. This is the highest yearly purchase since records began. Central banks from emerging economies such as China, India and Turkey are quickly increasing their Gold reserves.
Gold has an inverse correlation with the US Dollar and US Treasuries, which are both major reserve and safe-haven assets. When the Dollar depreciates, Gold tends to rise, enabling investors and central banks to diversify their assets in turbulent times. Gold is also inversely correlated with risk assets. A rally in the stock market tends to weaken Gold price, while sell-offs in riskier markets tend to favor the precious metal.
The price can move due to a wide range of factors. Geopolitical instability or fears of a deep recession can quickly make Gold price escalate due to its safe-haven status. As a yield-less asset, Gold tends to rise with lower interest rates, while higher cost of money usually weighs down on the yellow metal. Still, most moves depend on how the US Dollar (USD) behaves as the asset is priced in dollars (XAU/USD). A strong Dollar tends to keep the price of Gold controlled, whereas a weaker Dollar is likely to push Gold prices up.
- AUD/USD value has dropped due to consistent gains in the US Dollar.
- Monetary policy divergence between the RBA and the Fed could provide some relief to AUD/USD.
- Uncertainty surrounding China's economic outlook and stimulus efforts remains a key challenge for the Aussie.
The AUD/USD pair has declined in the Monday session, following consistent gains in the US Dollar. The pair fell by 0.80% to 0.6655 at the time of writing. The declines in the Aussie have been attributed to concerns over China's stimulus measures and recent weakness in copper prices.
However, monetary policy divergence between the Reserve Bank of Australia (RBA) and the Federal Reserve (Fed) could provide some support to AUD/USD, but the uncertainty surrounding China's economic outlook remains a key challenge for the currency. Investors remain vigilant to incoming Aussie data, as it might delay the start of the RBA’s easing cycle.
Daily digest market movers: Australian Dollar declines based on China, copper news
- Persistent weakness in copper prices and a modest decline in iron ore prices further weighed on the Australian Dollar.
- The RBA is keeping its cash rate steady at 4.35% and demands further data to start cutting rates.
- That being said, the latest meeting minutes revealed a more dovish outlook, increasing market expectations of a 25-basis-point rate cut by year-end.
- Elsewhere, deputy Governor Hauser warned that Australian rates would not drop as much or as soon as other central banks due to persistent inflation.
- This might benefit the Aussie as its peers have already started cutting rates. Higher rates might attract foreign investors, bolstering demand for the Australian currency.
AUD/USD technical outlook: Pair faces ongoing selling pressure
The technical outlook for the AUD/USD suggests ongoing selling pressure, indicated by the Relative Strength Index (RSI) close to the oversold area with a declining slope. This signals increasing momentum behind the sell-off. Furthermore, the Moving Average Convergence Divergence (MACD) histogram is red and rising, reinforcing the bearish bias.Significant support levels include 0.6650, 0.6630 and 0.6600, while resistance can be found at 0.6700, 0.6715 and 0.6750.
Australian Dollar FAQs
One of the most significant factors for the Australian Dollar (AUD) is the level of interest rates set by the Reserve Bank of Australia (RBA). Because Australia is a resource-rich country another key driver is the price of its biggest export, Iron Ore. The health of the Chinese economy, its largest trading partner, is a factor, as well as inflation in Australia, its growth rate and Trade Balance. Market sentiment – whether investors are taking on more risky assets (risk-on) or seeking safe-havens (risk-off) – is also a factor, with risk-on positive for AUD.
The Reserve Bank of Australia (RBA) influences the Australian Dollar (AUD) by setting the level of interest rates that Australian banks can lend to each other. This influences the level of interest rates in the economy as a whole. The main goal of the RBA is to maintain a stable inflation rate of 2-3% by adjusting interest rates up or down. Relatively high interest rates compared to other major central banks support the AUD, and the opposite for relatively low. The RBA can also use quantitative easing and tightening to influence credit conditions, with the former AUD-negative and the latter AUD-positive.
China is Australia’s largest trading partner so the health of the Chinese economy is a major influence on the value of the Australian Dollar (AUD). When the Chinese economy is doing well it purchases more raw materials, goods and services from Australia, lifting demand for the AUD, and pushing up its value. The opposite is the case when the Chinese economy is not growing as fast as expected. Positive or negative surprises in Chinese growth data, therefore, often have a direct impact on the Australian Dollar and its pairs.
Iron Ore is Australia’s largest export, accounting for $118 billion a year according to data from 2021, with China as its primary destination. The price of Iron Ore, therefore, can be a driver of the Australian Dollar. Generally, if the price of Iron Ore rises, AUD also goes up, as aggregate demand for the currency increases. The opposite is the case if the price of Iron Ore falls. Higher Iron Ore prices also tend to result in a greater likelihood of a positive Trade Balance for Australia, which is also positive of the AUD.
The Trade Balance, which is the difference between what a country earns from its exports versus what it pays for its imports, is another factor that can influence the value of the Australian Dollar. If Australia produces highly sought after exports, then its currency will gain in value purely from the surplus demand created from foreign buyers seeking to purchase its exports versus what it spends to purchase imports. Therefore, a positive net Trade Balance strengthens the AUD, with the opposite effect if the Trade Balance is negative.
- The Canadian Dollar extended its recent declines against the Greenback.
- Bank of Canada rate call due on Wednesday, looming rate cut trims CAD.
- The CAD is down over 3% against the USD since September.
The Canadian Dollar (CAD) shed another quarter of a percent against the Greenback at the start of the new trading week. The Loonie backslid into a fresh eleven-week low as CAD markets brace for a widely-anticipated 50 bps rate trim from the Bank of Canada (BoC) during the midweek market session on Wednesday.
Daily digest market movers
- CAD traders continue to make a broad-market pivot out of the Loonie ahead of the BoC’s rate call on Wednesday.
- The BoC is widely expected to trim interest rates by a further 50 bps in an effort to shore up decaying economic figures.
- Fedspeak is a key driver in risk sentiment flows on Monday as key Fed officials make early-week appearances.
- Read more:
Fed's Kashkari: I see modest cuts over the next quarters
Fed’s Logan: Gradual rate cuts on the cards if economy meets forecasts - US Retail Sales due Thursday to drive late-week Greenback market momentum.
- Canadian Retail Sales figures due on Friday to serve as a post-rate cut signal of where the Canadian economy is headed in spite of moves from the BoC.
Canadian Dollar price forecast
The USD/CAD pair continues its bullish march, trading around 1.3833 on the daily chart after successfully breaching key resistance levels in recent sessions. The price has risen decisively above both the 50-day EMA at 1.3645 and the 200-day EMA at 1.3617, confirming bullish momentum. These moving averages are now acting as significant support levels, reinforcing the upward bias. With the pair trading near its recent highs, the next psychological resistance to watch is the 1.3900 level, followed by a potential retest of 1.4000 if momentum continues.
The MACD histogram continues to expand in positive territory, suggesting strong bullish momentum. The MACD line has crossed above the signal line, reinforcing the positive outlook. However, the price is approaching overbought conditions, so traders should be cautious of a potential short-term pullback or consolidation phase before the next leg higher. A failure to maintain momentum could lead to a correction toward the 1.3700 area, aligning with the 50-day EMA as a key support zone for buyers to re-enter.
USD/CAD daily chart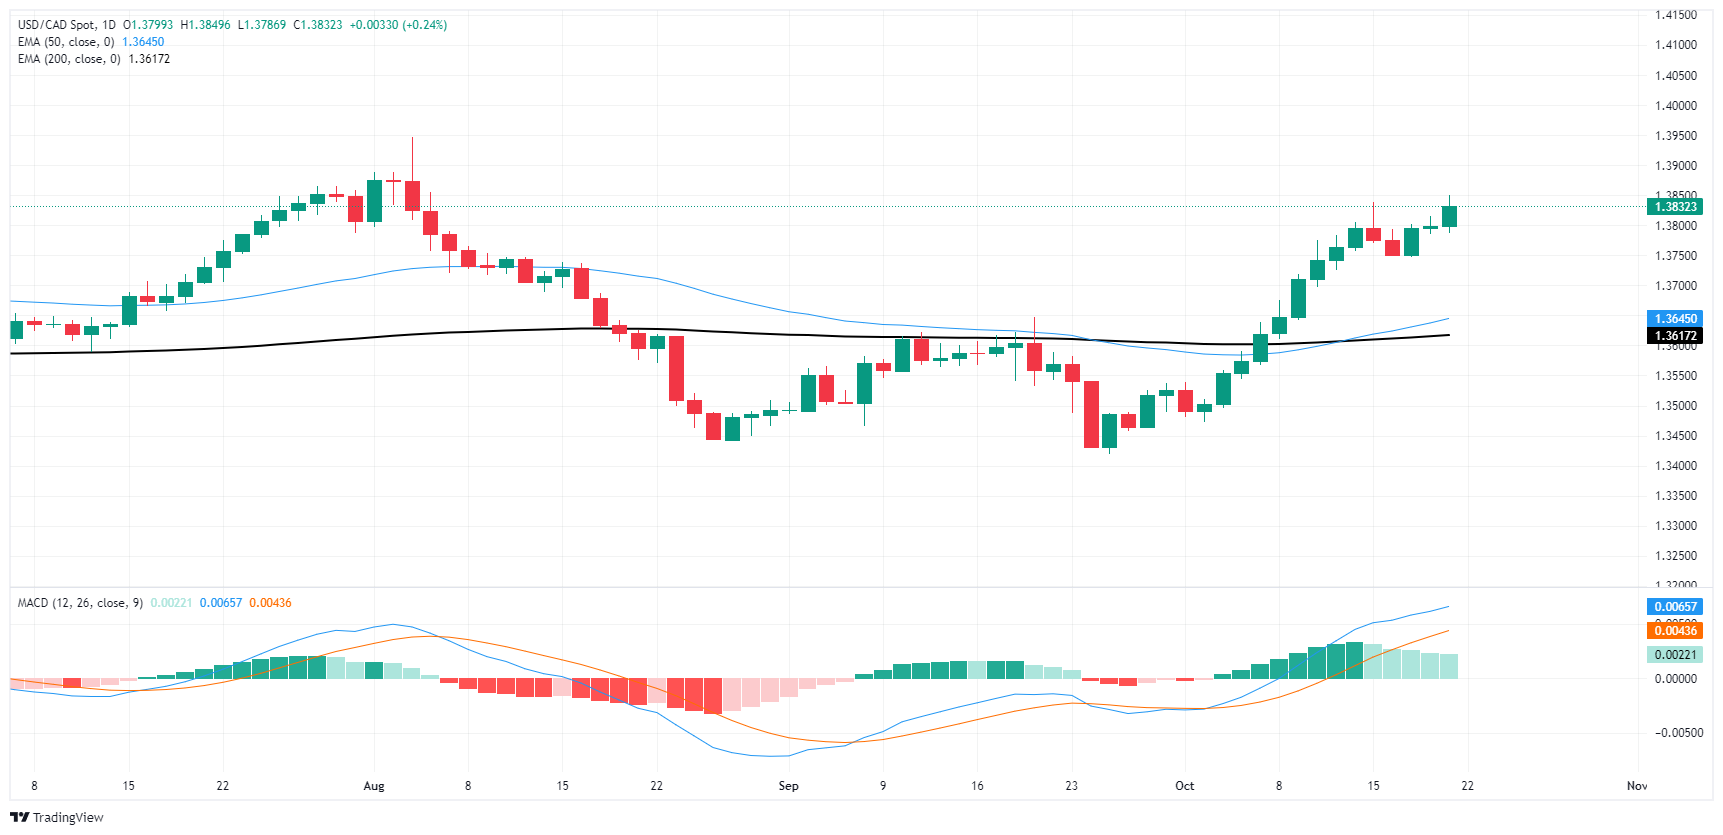
Canadian Dollar FAQs
The key factors driving the Canadian Dollar (CAD) are the level of interest rates set by the Bank of Canada (BoC), the price of Oil, Canada’s largest export, the health of its economy, inflation and the Trade Balance, which is the difference between the value of Canada’s exports versus its imports. Other factors include market sentiment – whether investors are taking on more risky assets (risk-on) or seeking safe-havens (risk-off) – with risk-on being CAD-positive. As its largest trading partner, the health of the US economy is also a key factor influencing the Canadian Dollar.
The Bank of Canada (BoC) has a significant influence on the Canadian Dollar by setting the level of interest rates that banks can lend to one another. This influences the level of interest rates for everyone. The main goal of the BoC is to maintain inflation at 1-3% by adjusting interest rates up or down. Relatively higher interest rates tend to be positive for the CAD. The Bank of Canada can also use quantitative easing and tightening to influence credit conditions, with the former CAD-negative and the latter CAD-positive.
The price of Oil is a key factor impacting the value of the Canadian Dollar. Petroleum is Canada’s biggest export, so Oil price tends to have an immediate impact on the CAD value. Generally, if Oil price rises CAD also goes up, as aggregate demand for the currency increases. The opposite is the case if the price of Oil falls. Higher Oil prices also tend to result in a greater likelihood of a positive Trade Balance, which is also supportive of the CAD.
While inflation had always traditionally been thought of as a negative factor for a currency since it lowers the value of money, the opposite has actually been the case in modern times with the relaxation of cross-border capital controls. Higher inflation tends to lead central banks to put up interest rates which attracts more capital inflows from global investors seeking a lucrative place to keep their money. This increases demand for the local currency, which in Canada’s case is the Canadian Dollar.
Macroeconomic data releases gauge the health of the economy and can have an impact on the Canadian Dollar. Indicators such as GDP, Manufacturing and Services PMIs, employment, and consumer sentiment surveys can all influence the direction of the CAD. A strong economy is good for the Canadian Dollar. Not only does it attract more foreign investment but it may encourage the Bank of Canada to put up interest rates, leading to a stronger currency. If economic data is weak, however, the CAD is likely to fall.
The US Dollar accelerated its uptrend and traded at shouting distance from the area of three-month highs on the back of higher yields and the resumption of the “Trump trade” among market participants.
Here is what you need to know on Tuesday, October 22:
The US Dollar Index (DXY) climbed further and came at shouting distance from the key 104.00 barrier helped by rising US yields. The Richmond Fed Manufacturing Index is due along with the speech by the Fed’s Harker.
EUR/USD resumed its deep pullback and approached the 1.0800 region once again on Monday. All the attention will be on the ECB, as Lagarde, McCaul and Lane are all due to speak.
GBP/USD succumbed to the Dollar’s gains and broke below the key support at 1.3000 the figure. Public Sector Net Borrowing figures will be published followed by the speech by the BoE’s Bailey.
USD/JPY advanced to multi-week tops well north of the 150.00 hurdle following the firm performance of US and Japanese yields. Next on tap in Japan will be the weekly Foreign Bond Investment figures along with the preliminary Jibun Bank Manufacturing and Services Index on October 24.
AUD/USD deflated to six-week lows near 0.6650 on the back of usual concerns from China, the stronger Dollar and weaker commodity prices. The advanced Judo Bank Manufacturing and Services PMIs will be the next salient event in Oz on October 24.
Prices of WTI regained the smile and reversed six straight days of losses on Monday, this time reclaiming the area beyond the key $70.00 mark per barrel.
Prices of Gold rose to a record high around $2,740 mark per ounce troy in response to the stronger Greenback and rising US yields. Silver prices, on the flip side, rose past the $34.00 mark per ounce for the first time since November 2012, ending the day marginally on the upside.
Federal Reserve (Fed) Bank of Minneapolis President Neel Kashkari noted on Monday that while the Fed is on the lookout for a rapid destabilization in the US labor market, investors should expect a modest pace of rate cuts over the next few quarters.
Key highlights
We definitely want to avoid recession, saw signs of labor market weakening, that's why the Fed cut by 50 bps.
Resilience makes me wonder if the neutral rate is higher.
Evidence of quick labor market weakening could lead to faster rate cuts.
Right now, I see modest cuts over the next quarters.
It has been surprising that geopolitics hasn't had more oil impact.
By many measures, excess savings have been spent down.
Monetary policy's role in bringing down inflation was probably mainly in anchoring inflation expectations, not in reducing demand.
- Mexican Peso falls to a six-week low as former President Trump leads US election polls, threatening a 200% tariff on Mexican cars.
- Fears of a constitutional crisis in Mexico intensify after President Sheinbaum defies a court ruling to remove a judicial reform decree.
- Investors shift focus to upcoming economic data from both Mexico and the US with Retail Sales and inflation figures in the spotlight.
The Mexican Peso plunges more than 0.90% against the US Dollar amid a risk-off impulse and increasing odds that former President Donald Trump leads the polls. Rising fears of a constitutional crisis in Mexico weighed on the emerging market currency, which extended its fall to a six-week low. At the time of writing, the USD/MXN trades at 20.03 after bouncing off a daily low of 19.82.
Financial markets' focus has shifted toward the US election. Traders are putting aside Q3 earnings until the election passes. Recently published polls suggest the race is tightening, and former President Donald Trump looks more capable of winning the presidential election on November 5. Last week, he said he would impose a 200% tax on Mexican-made cars. Such a move has weighed on the Mexican currency, which is about to hit three-month lows.
On the Mexican front, last Thursday the 19th District Court based in Coatzacoalcos, Veracruz, and led by Judge Nancy Juarez Salas, granted a definitive suspension, ordering Mexican President Claudia Sheinbaum and the director of el Diario Oficial de la Federacion (the Government’s official gazette) Alejandro Lopez Gonzalez to remove the decree that validates the judicial reform from the official gazette.
In response, President Sheinbaum said that the judge is “not above” the country and declared, “We are not going to lower the publication,” adding that they will file a complaint with the Federal Judicial Council.
As of writing, the decree hasn’t been removed from the Mexican official gazette, which has sparked fears of a probable constitutional crisis.
Meanwhile, an absent economic docket on both sides of the border keeps investors digesting China’s stimulus to boost the economy. China’s central bank, the People’s Bank of China (PBoC), lowered rates for the one and five-year Loan Prime Rate (LPR). Trump announced on the campaign trail that he would impose tariffs on the country if China invades Taiwan.
Meanwhile, Dallas Fed President Lorie Logan commented that money markets are close to or just above interest on reserves rate. She favors a gradual approach to easing policy if the economy meets forecasts.
Mexico’s economic schedule will be slightly busy ahead of the week with the release of the Economic Activity indicator, Retail Sales, and Mid-Month Inflation for October.
On the US front, Fed speakers, jobs data and S&P Global Flash PMIs should influence the USD/MXN direction.
Daily digest market movers: Mexican Peso on the defensive ahead of crucial data
- Mexico’s Economic Activity is expected to slow from 3.8% to 0.9%.
- October Mid-Month Inflation is expected to drop from 3.95% to 3.83%, and underlying inflation is expected to fall from 4.66% to 4.63%.
- The International Monetary Fund (IMF) projected the Mexican economy to grow 1.5% in 2024, lower than in its previous forecast. The IMF estimates a deeper economic slowdown for the next year, estimating 1.3% GDP growth, and forecasts inflation to hit Banxico’s 3% goal in 2025.
- The IMF said that a recent judicial reform creates "important uncertainties about the effectiveness of contract enforcement and the predictability of the rule of law."
- US Initial Jobless Claims for the week ending October 19 are foreseen rising from 241K to 247K.
- US business activity for October is expected to edge up in the manufacturing sector, according to S&P Global. Services PMI is foreseen dipping from 55.2 to 55.
- Data from the Chicago Board of Trade, via the December Fed funds rate futures contract, shows investors estimate 46 bps of Fed easing by the end of the year. This is somewhat lower than a week ago.
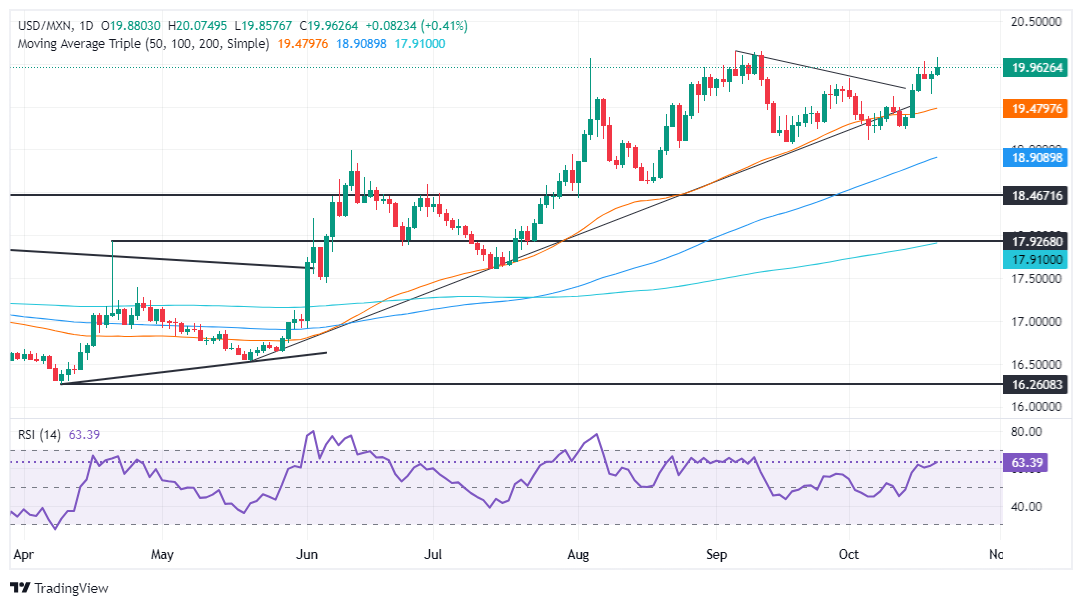
USD/MXN technical outlook: Mexican Peso dives as USD/MXN climbs above 19.90
The USD/MXN exotic pair is upwardly biased, and it could test the year-to-date (YTD) high at 20.22 in the near term. Momentum remains bullish, as the Relative Strength Index (RSI) portrays.
If USD/MXN clears the September 5 high at 20.14, the next resistance would be the YTD high at 20.22. On further strength, the next stop would be 20.50, followed by the 21.00 figure.
Conversely, if the USD/MXN tumbles below 20, the next support would be an October 18 low of 19.64. A breach of the latter will expose the October 10 daily peak at 19.61, followed by the October 4 swing low of 19.10 before testing 19.00.
Mexican Peso FAQs
The Mexican Peso (MXN) is the most traded currency among its Latin American peers. Its value is broadly determined by the performance of the Mexican economy, the country’s central bank’s policy, the amount of foreign investment in the country and even the levels of remittances sent by Mexicans who live abroad, particularly in the United States. Geopolitical trends can also move MXN: for example, the process of nearshoring – or the decision by some firms to relocate manufacturing capacity and supply chains closer to their home countries – is also seen as a catalyst for the Mexican currency as the country is considered a key manufacturing hub in the American continent. Another catalyst for MXN is Oil prices as Mexico is a key exporter of the commodity.
The main objective of Mexico’s central bank, also known as Banxico, is to maintain inflation at low and stable levels (at or close to its target of 3%, the midpoint in a tolerance band of between 2% and 4%). To this end, the bank sets an appropriate level of interest rates. When inflation is too high, Banxico will attempt to tame it by raising interest rates, making it more expensive for households and businesses to borrow money, thus cooling demand and the overall economy. Higher interest rates are generally positive for the Mexican Peso (MXN) as they lead to higher yields, making the country a more attractive place for investors. On the contrary, lower interest rates tend to weaken MXN.
Macroeconomic data releases are key to assess the state of the economy and can have an impact on the Mexican Peso (MXN) valuation. A strong Mexican economy, based on high economic growth, low unemployment and high confidence is good for MXN. Not only does it attract more foreign investment but it may encourage the Bank of Mexico (Banxico) to increase interest rates, particularly if this strength comes together with elevated inflation. However, if economic data is weak, MXN is likely to depreciate.
As an emerging-market currency, the Mexican Peso (MXN) tends to strive during risk-on periods, or when investors perceive that broader market risks are low and thus are eager to engage with investments that carry a higher risk. Conversely, MXN tends to weaken at times of market turbulence or economic uncertainty as investors tend to sell higher-risk assets and flee to the more-stable safe havens.
- The US Dollar sees some gains, while markets continue looking for clues on the Fed’s next steps.
- Several Federal Reserve members will speak on Monday afternoon.
- Fed’s Beige Book, S&P figures and Initial Jobless Claims will be closely followed this week.
The US Dollar Index (DXY), which measures the value of the USD against a basket of six currencies, is slightly higher at the start of the week, supported by safe-haven flows amid geopolitical tensions. Some Federal Reserve (Fed) members are scheduled to speak later on Monday, and their comments will be closely watched for any clues on the Fed's monetary policy stance.
Daily digest market movers: US Dollar gains on Middle East tensions and Fed comments
- The US Dollar remains steady, inching up slightly due to escalating geopolitical tensions in the Middle East and supportive comments from Federal Reserve officials.
- However, profit-taking dampens the Greenback's gains as investors react to positive economic data from China and the government's stimulus package.
- Economic activity figures in this week’s S&P data on Thursday might shake the USD, as well as those in the Fed’s Beige Book report on Wednesday.
- Markets continue to bet on higher odds of two cuts in what remains of 2024.
DXY technical outlook: DXY momentum might have hit its ceiling
The DXY index is facing resistance at the 200-day Simple Moving Average (SMA). Despite resuming the gains, the momentum may not be enough to conquer it. Both the Relative Strength Index (RSI) and the Moving Average Convergence Divergence (MACD) have flattened in positive territory, indicating a pause in buying momentum with the latter still in overbought territory.
As a result, the index may struggle to regain the 200-day SMA and may instead consolidate sideways in the near term.
US Dollar FAQs
The US Dollar (USD) is the official currency of the United States of America, and the ‘de facto’ currency of a significant number of other countries where it is found in circulation alongside local notes. It is the most heavily traded currency in the world, accounting for over 88% of all global foreign exchange turnover, or an average of $6.6 trillion in transactions per day, according to data from 2022. Following the second world war, the USD took over from the British Pound as the world’s reserve currency. For most of its history, the US Dollar was backed by Gold, until the Bretton Woods Agreement in 1971 when the Gold Standard went away.
The most important single factor impacting on the value of the US Dollar is monetary policy, which is shaped by the Federal Reserve (Fed). The Fed has two mandates: to achieve price stability (control inflation) and foster full employment. Its primary tool to achieve these two goals is by adjusting interest rates. When prices are rising too quickly and inflation is above the Fed’s 2% target, the Fed will raise rates, which helps the USD value. When inflation falls below 2% or the Unemployment Rate is too high, the Fed may lower interest rates, which weighs on the Greenback.
In extreme situations, the Federal Reserve can also print more Dollars and enact quantitative easing (QE). QE is the process by which the Fed substantially increases the flow of credit in a stuck financial system. It is a non-standard policy measure used when credit has dried up because banks will not lend to each other (out of the fear of counterparty default). It is a last resort when simply lowering interest rates is unlikely to achieve the necessary result. It was the Fed’s weapon of choice to combat the credit crunch that occurred during the Great Financial Crisis in 2008. It involves the Fed printing more Dollars and using them to buy US government bonds predominantly from financial institutions. QE usually leads to a weaker US Dollar.
Quantitative tightening (QT) is the reverse process whereby the Federal Reserve stops buying bonds from financial institutions and does not reinvest the principal from the bonds it holds maturing in new purchases. It is usually positive for the US Dollar.
- The Dow Jones shed 300 points, or 0.7%, as equities retreat from record highs.
- Bullish momentum is taking a breather, with the Dow Jones bearing the brunt of the load.
- Earnings season expectations are battling with elevated interest rate fears.
The Dow Jones Industrial Average (DJIA) backslid on Monday, tumbling 300 points and shedding seven-tenths of one percent as equity markets ease back from recent record highs. The Dow bore most of the bearish burden to kick off the new trading week, with losses consolidated largely within the major equity index.
Bond yields ticked higher and construction stocks swooned on the day, with fresh fears across the broader market that the Federal Reserve (Fed) would be forced to keep interest rates higher for longer. Despite delivering a jumbo rate cut of 50 bps in September, investors are balking at the fact that the US economy remains stubbornly resilient, implying it could take the Fed even longer than expected to finally drag core inflation down to the 2% annual target.
Earnings season is in full swing in equity markets, with roughly a fifth of the companies listed on the S&P 500 set to release Q3 revenue reporting through this week. A little under 20% of S&P 500 companies already reported third-quarter earnings last week, with nearly 80% of reporting companies beating Wall Street expectations. However, analysts have noted that the extreme beats come off the back of significantly downgraded expectations in recent months; with investing markets expecting so little, it’s difficult for firms to fail, with CFRA chief investment strategist Sam Stovall noting, “rarely does anybody injure themselves falling out of a basement window.”
Dow Jones news
Most of the securities listed on the Dow Jones are easing back on Monday, with all but five of the Dow’s constituent stocks seeing red for the day. Boeing (BA) rose over 3% to hit $160 per share ahead of the airline company’s earnings call slated for Wednesday, October 23. On the low side, American Express (AXP), Home Depot (HD), and Travelers Companies (TRV) lead the loser, with each decline over 2%. AXP fell 2.5% to $270 per share, with HD shedding 2.3% and falling below $405.50, and Travelers Companies declining 2.25%, falling below $260 per share in the process.
Dow Jones price forecast
The Dow Jones is giving mixed signals on daily candlesticks. Price action continues to grind deeper into bull country as bidding momentum outpaces long-term moving averages. However, technical indicators are going on the fritz after spending months flashing warning signs of overbought conditions.
The Dow backpedaled from a recent record high north of 43,200 set last Friday, testing back below 43,000 and shedding over 300 points. Despite the pullback, prices are pinned firmly on the high side, with the 50-day Exponential Moving Average (EMA) well below near-term price action at 41,740.
The Moving Average Convergence-Divergence (MACD) is currently above the zero line, a bullish signal, but the histogram shows a declining momentum. The fast MACD line is now close to crossing below the slower signal line, signaling that bearish momentum could soon take over. This could point to a short-term correction, especially if sellers manage to push the price below the 42,000 level.
Nonetheless, the MACD remains in positive territory with no decisive crossover observed yet, indicating that bulls still maintain some control. However, traders should monitor this indicator closely for additional confirmation of a possible bearish reversal.
Dow Jones daily chart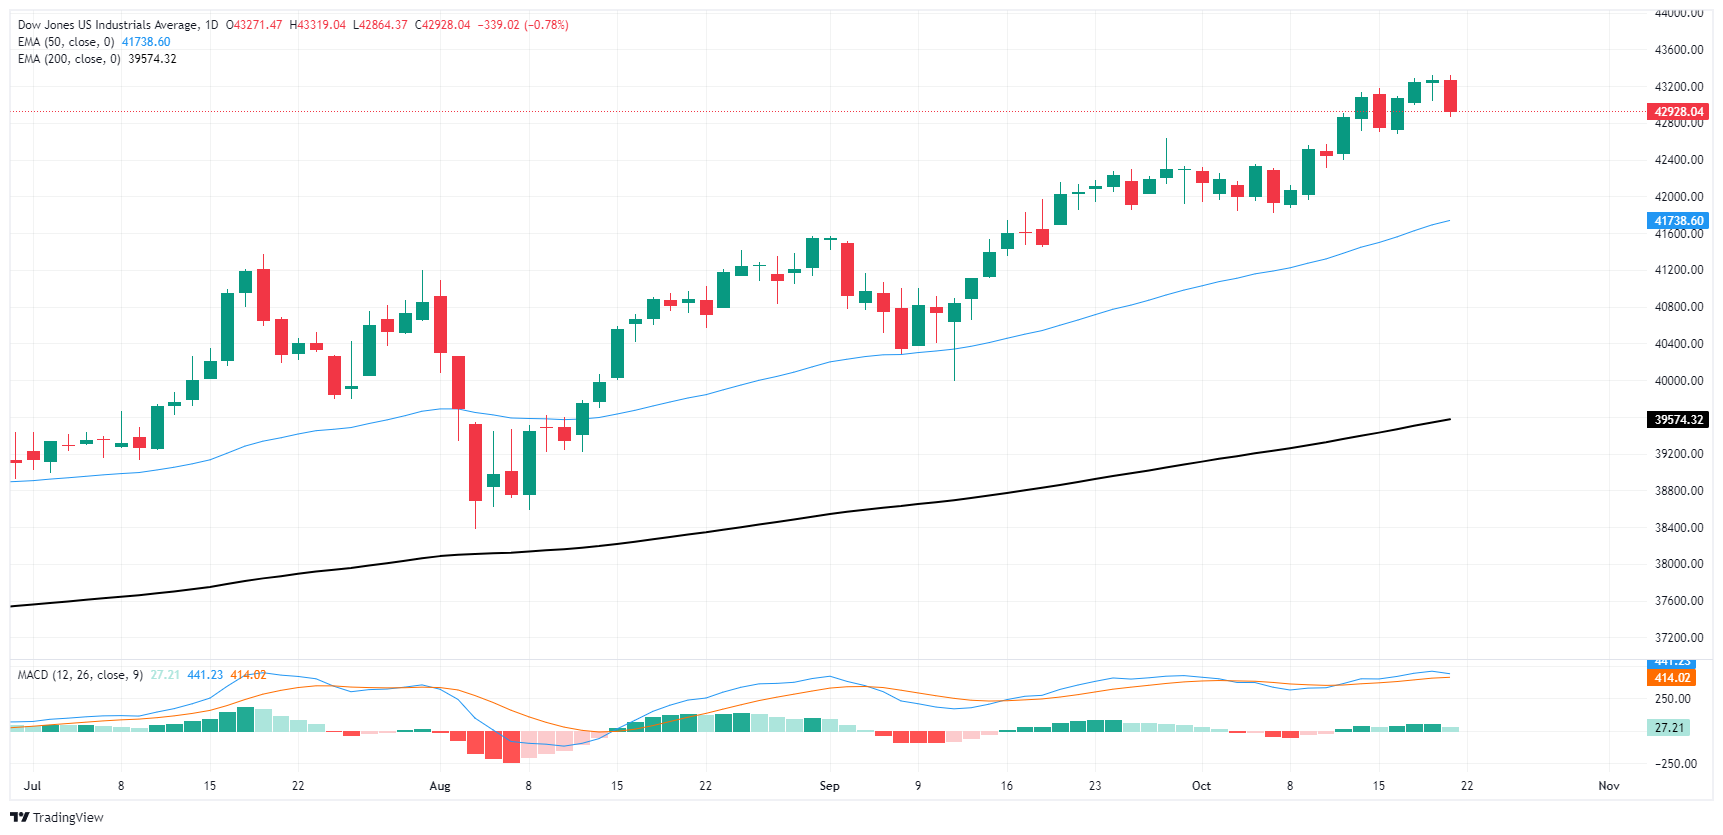
Dow Jones FAQs
The Dow Jones Industrial Average, one of the oldest stock market indices in the world, is compiled of the 30 most traded stocks in the US. The index is price-weighted rather than weighted by capitalization. It is calculated by summing the prices of the constituent stocks and dividing them by a factor, currently 0.152. The index was founded by Charles Dow, who also founded the Wall Street Journal. In later years it has been criticized for not being broadly representative enough because it only tracks 30 conglomerates, unlike broader indices such as the S&P 500.
Many different factors drive the Dow Jones Industrial Average (DJIA). The aggregate performance of the component companies revealed in quarterly company earnings reports is the main one. US and global macroeconomic data also contributes as it impacts on investor sentiment. The level of interest rates, set by the Federal Reserve (Fed), also influences the DJIA as it affects the cost of credit, on which many corporations are heavily reliant. Therefore, inflation can be a major driver as well as other metrics which impact the Fed decisions.
Dow Theory is a method for identifying the primary trend of the stock market developed by Charles Dow. A key step is to compare the direction of the Dow Jones Industrial Average (DJIA) and the Dow Jones Transportation Average (DJTA) and only follow trends where both are moving in the same direction. Volume is a confirmatory criteria. The theory uses elements of peak and trough analysis. Dow’s theory posits three trend phases: accumulation, when smart money starts buying or selling; public participation, when the wider public joins in; and distribution, when the smart money exits.
There are a number of ways to trade the DJIA. One is to use ETFs which allow investors to trade the DJIA as a single security, rather than having to buy shares in all 30 constituent companies. A leading example is the SPDR Dow Jones Industrial Average ETF (DIA). DJIA futures contracts enable traders to speculate on the future value of the index and Options provide the right, but not the obligation, to buy or sell the index at a predetermined price in the future. Mutual funds enable investors to buy a share of a diversified portfolio of DJIA stocks thus providing exposure to the overall index.
- USD/JPY climbs to 150.52, its highest level in 12 weeks, as rising US bond yields fuel demand for the Dollar.
- Technical outlook remains bullish, with potential for further gains if the pair breaks through 150.78 and heads toward the 200-DMA at 151.34.
- A close below 150.00 could trigger a pullback, with key support levels at 149.27 and the 50-DMA at 145.55.
The USD/JPY climbed in the mid-North American session on Monday, up by 0.62%. The pair printed a 12-week peak of 150.52, as US Treasury bond yields rose as traders trimmed odds that the Federal Reserve would embark on an aggressive easing cycle. At the time of writing, the pair fluctuates at around 150.50
USD/JPY Price Forecast: Technical outlook
The USD/JPY began the week on the front foot and extended its gains past 150.00. Momentum remains bullish as depicted by the Relative Strength Index (RSI), which is at the brisk of clearing the latest higher peak.
If USD/JPY clears the 100-day moving average (DMA) confluence and the top of the Ichimoku Cloud (Kumo) at 150.78, this could sponsor a leg-up towards the 200-DMA at 151.34. If cleared, buyers would eye 152.00.
Conversely, a daily close below 150.00 would pave the way for a pullback, exposing the Tenkan-Sen at 149.27. Once surpassed, key support levels would be exposed, like 149.00, followed by the Senkou Span at 147.16, before testing the 50-DMA at 145.55.
USD/JPY Price Action – Daily Chart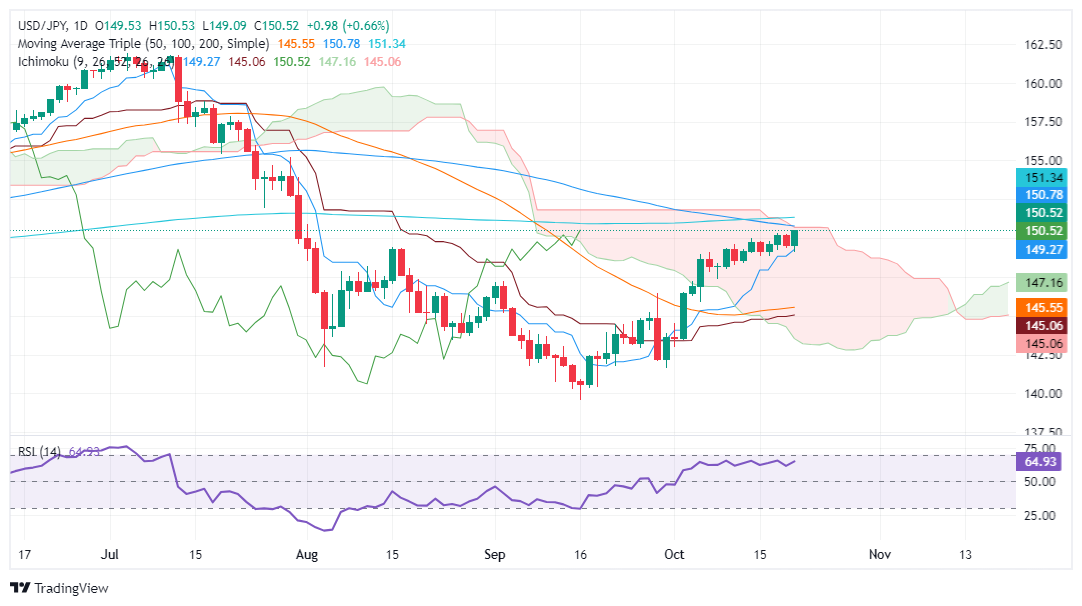
Japanese Yen PRICE Today
The table below shows the percentage change of Japanese Yen (JPY) against listed major currencies today. Japanese Yen was the strongest against the Australian Dollar.
| USD | EUR | GBP | JPY | CAD | AUD | NZD | CHF | |
|---|---|---|---|---|---|---|---|---|
| USD | 0.44% | 0.53% | 0.66% | 0.24% | 0.74% | 0.61% | 0.14% | |
| EUR | -0.44% | 0.01% | 0.15% | -0.15% | 0.26% | 0.06% | -0.38% | |
| GBP | -0.53% | -0.01% | 0.12% | -0.29% | 0.22% | 0.09% | -0.43% | |
| JPY | -0.66% | -0.15% | -0.12% | -0.43% | 0.07% | -0.01% | -0.57% | |
| CAD | -0.24% | 0.15% | 0.29% | 0.43% | 0.41% | 0.43% | -0.22% | |
| AUD | -0.74% | -0.26% | -0.22% | -0.07% | -0.41% | -0.05% | -0.66% | |
| NZD | -0.61% | -0.06% | -0.09% | 0.00% | -0.43% | 0.05% | -0.51% | |
| CHF | -0.14% | 0.38% | 0.43% | 0.57% | 0.22% | 0.66% | 0.51% |
The heat map shows percentage changes of major currencies against each other. The base currency is picked from the left column, while the quote currency is picked from the top row. For example, if you pick the Japanese Yen from the left column and move along the horizontal line to the US Dollar, the percentage change displayed in the box will represent JPY (base)/USD (quote).
- EUR/USD edged back into the low end on Monday as the US Dollar bounces.
- A strong Greenback bid is bolstering the USD across the board.
- Easing equity prices and a simmering Middle East are boosting safe haven bids.
EUR/USD pivoted into early losses to kick off the new trading week, cutting a near-term recovery rally short and sending intraday bids tumbling back toward 1.0800. The US market session sees stock investors taking a breather from setting record highs multiple days in a row, and the downside push in equities is helping to send the US Dollar higher.
Middle East geopolitical tensions continue to simmer away in the background, giving the safe haven Greenback a boost and lending a leg higher to both Gold and Crude Oil prices. Market participants continue to wait and see if the US will successfully negotiate Israel into a ceasefire as the small country continues to wage war against Hezbollah and Hamas, showing a willingness to cross into other countries’ borders to do it.
Federal Reserve (Fed) Bank of Dallas President Lorie Logan hit most of the common narrative elements markets have received from Fed policy planners in recent weeks, however the Dallas Fed President made a point of noting that money markets are “cose to or just above interest on reserve rates”. Dallas Fed President Logan then proceeded to highlight the risks to the US labor market and the Fed’s dedication to maintaining a healthy employment rate, underlining the fact that the Fed will need not just a decline in inflation, but a significant uptick in the unemployment rate before markets would see accelerated rate cuts.
US Dollar FAQs
The US Dollar (USD) is the official currency of the United States of America, and the ‘de facto’ currency of a significant number of other countries where it is found in circulation alongside local notes. It is the most heavily traded currency in the world, accounting for over 88% of all global foreign exchange turnover, or an average of $6.6 trillion in transactions per day, according to data from 2022. Following the second world war, the USD took over from the British Pound as the world’s reserve currency. For most of its history, the US Dollar was backed by Gold, until the Bretton Woods Agreement in 1971 when the Gold Standard went away.
The most important single factor impacting on the value of the US Dollar is monetary policy, which is shaped by the Federal Reserve (Fed). The Fed has two mandates: to achieve price stability (control inflation) and foster full employment. Its primary tool to achieve these two goals is by adjusting interest rates. When prices are rising too quickly and inflation is above the Fed’s 2% target, the Fed will raise rates, which helps the USD value. When inflation falls below 2% or the Unemployment Rate is too high, the Fed may lower interest rates, which weighs on the Greenback.
In extreme situations, the Federal Reserve can also print more Dollars and enact quantitative easing (QE). QE is the process by which the Fed substantially increases the flow of credit in a stuck financial system. It is a non-standard policy measure used when credit has dried up because banks will not lend to each other (out of the fear of counterparty default). It is a last resort when simply lowering interest rates is unlikely to achieve the necessary result. It was the Fed’s weapon of choice to combat the credit crunch that occurred during the Great Financial Crisis in 2008. It involves the Fed printing more Dollars and using them to buy US government bonds predominantly from financial institutions. QE usually leads to a weaker US Dollar.
Quantitative tightening (QT) is the reverse process whereby the Federal Reserve stops buying bonds from financial institutions and does not reinvest the principal from the bonds it holds maturing in new purchases. It is usually positive for the US Dollar.
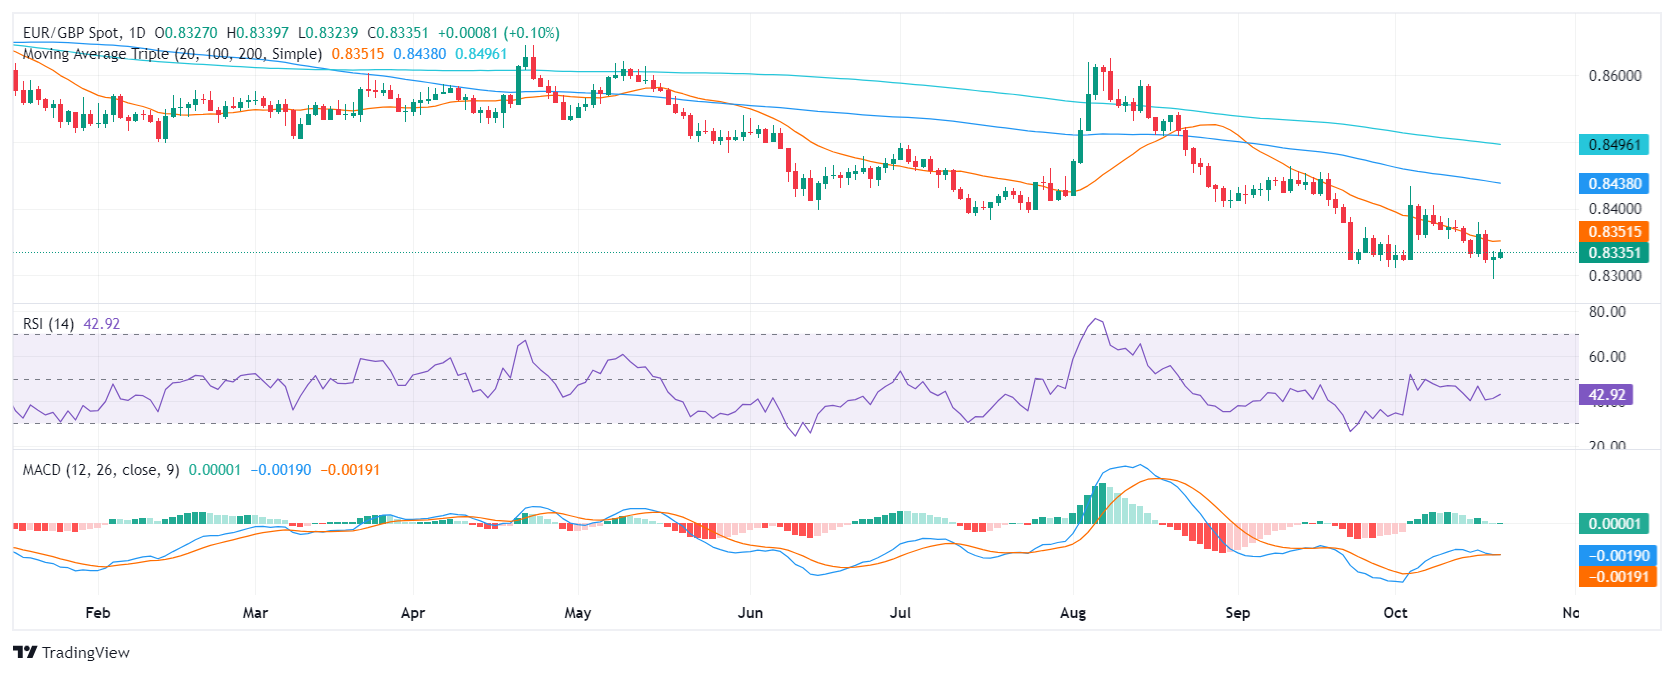
- EUR/GBP remains range-bound, consolidating recent losses as buying pressure stalls.
- Sellers take the foot off the gas after last Thursday’s losses
- RSI indicates recovering buying pressure, while MACD shows flat conditions.
EUR/GBP daily chart
In recent sessions, the USD150 area has been mostly capping the upside for the currency pair. At the start of the month USD/JPY was propelled higher by a remark from the then freshly installed PM Ishiba. He remarked that the economy was not ready for further rate hikes. This could have been a clumsy mistake by a politician unused to being in the market’s central view, Rabobank’s FX analyst Jane Foley notes.
USD/JPY to be lower on a 3-to-6-month horizon
“Since then, the government has made an attempt to provide reassurances about the BoJ’s independence, although the relatively sluggishness of Japanese economic data has ensured there has been no return of October rate hike speculation. Industrial production declined by a greater than expected -3.3% m/m in August, real cash earnings at -0.6% y/y dipped back into negative territory and September consumer confidence fell below the market consensus.”
“While the move back to the USD/JPY 150 level has also been supported by USD strength this month as Fed rate cut speculation was pared back, there would appear to be concern in the market about the risk of MoF intervention should USD/JPY break convincingly above the 150 level. This would likely commence with verbal push-back from the authorities, which underscores the likelihood that Ueda will refer to the impact of exchange rates on prices next week.”
“Indeed, any perceived lack of concern by the BoJ regarding currency weakness next week would likely be the green light for another leg higher in the currency pair. That said, following this summer’s volatility we would expect Ueda to choose his words very carefully to avoid sharp moves in the JPY. We continue to expect USD/JPY to be lower on a 3-to-6-month horizon as the Japanese economic recovery continues. This assumes the BoJ will continue to hike rates next year.”
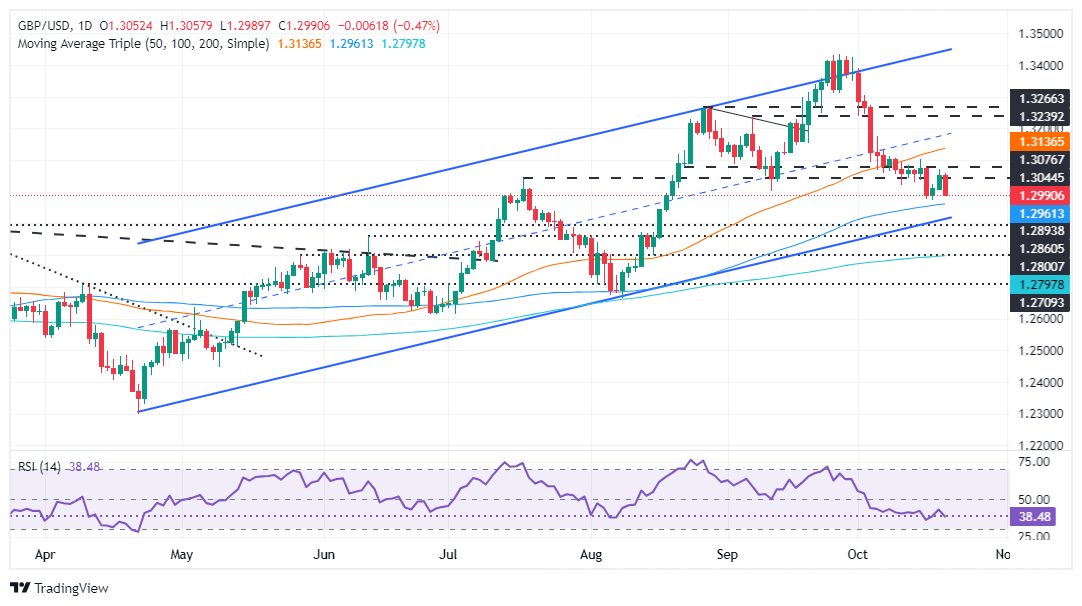
- GBP/USD begins the week down, struggling to hold above 1.3000.
- Sellers eye key support at last week’s low of 1.2973, with further downside targets at the 100-DMA and the 200-DMA, each at 1.2959 and 1.2796.
- Buyers must reclaim 1.3100 to challenge the 50-DMA at 1.3133 and aim for the YTD high of 1.3434.
The Pound Sterling is losing some ground against the Greenback. Increasing tensions in the Middle East are spurring a risk-off environment despite China’s efforts to propel its economy. At the time of writing, the GBP/USD trades at 1.2997, down 0.38%.
GBP/USD Price Forecast: Technical outlook
The GBP/USD begins the week on the back foot after opening at around 1.3039. Since then, the pair hit a 1.3057 high before sliding beneath the 1.3000 mark.
Momentum suggests that sellers are in charge, as portrayed by the Relative Strength Index (RSI). However, they must clear last week’s low of 1.2973 before challenging the 100-day moving average (DMA) at 1.2959, aiming to push prices toward the 200-DMA at 1.2796.
On the other hand, buyers must lift the GBP/USD spot price above 1.3100 so they can test the 50-DMA at 1.3133 as they prepare to challenge the year-to-date (YTD) high at 1.3434.
GBP/USD Price Action – Daily Chart
British Pound PRICE Today
The table below shows the percentage change of British Pound (GBP) against listed major currencies today. British Pound was the strongest against the Australian Dollar.
| USD | EUR | GBP | JPY | CAD | AUD | NZD | CHF | |
|---|---|---|---|---|---|---|---|---|
| USD | 0.34% | 0.47% | 0.47% | 0.19% | 0.64% | 0.54% | 0.14% | |
| EUR | -0.34% | 0.06% | 0.03% | -0.09% | 0.27% | 0.09% | -0.30% | |
| GBP | -0.47% | -0.06% | -0.02% | -0.27% | 0.18% | 0.07% | -0.40% | |
| JPY | -0.47% | -0.03% | 0.02% | -0.27% | 0.17% | 0.12% | -0.40% | |
| CAD | -0.19% | 0.09% | 0.27% | 0.27% | 0.35% | 0.40% | -0.20% | |
| AUD | -0.64% | -0.27% | -0.18% | -0.17% | -0.35% | -0.03% | -0.60% | |
| NZD | -0.54% | -0.09% | -0.07% | -0.12% | -0.40% | 0.03% | -0.47% | |
| CHF | -0.14% | 0.30% | 0.40% | 0.40% | 0.20% | 0.60% | 0.47% |
The heat map shows percentage changes of major currencies against each other. The base currency is picked from the left column, while the quote currency is picked from the top row. For example, if you pick the British Pound from the left column and move along the horizontal line to the US Dollar, the percentage change displayed in the box will represent GBP (base)/USD (quote).
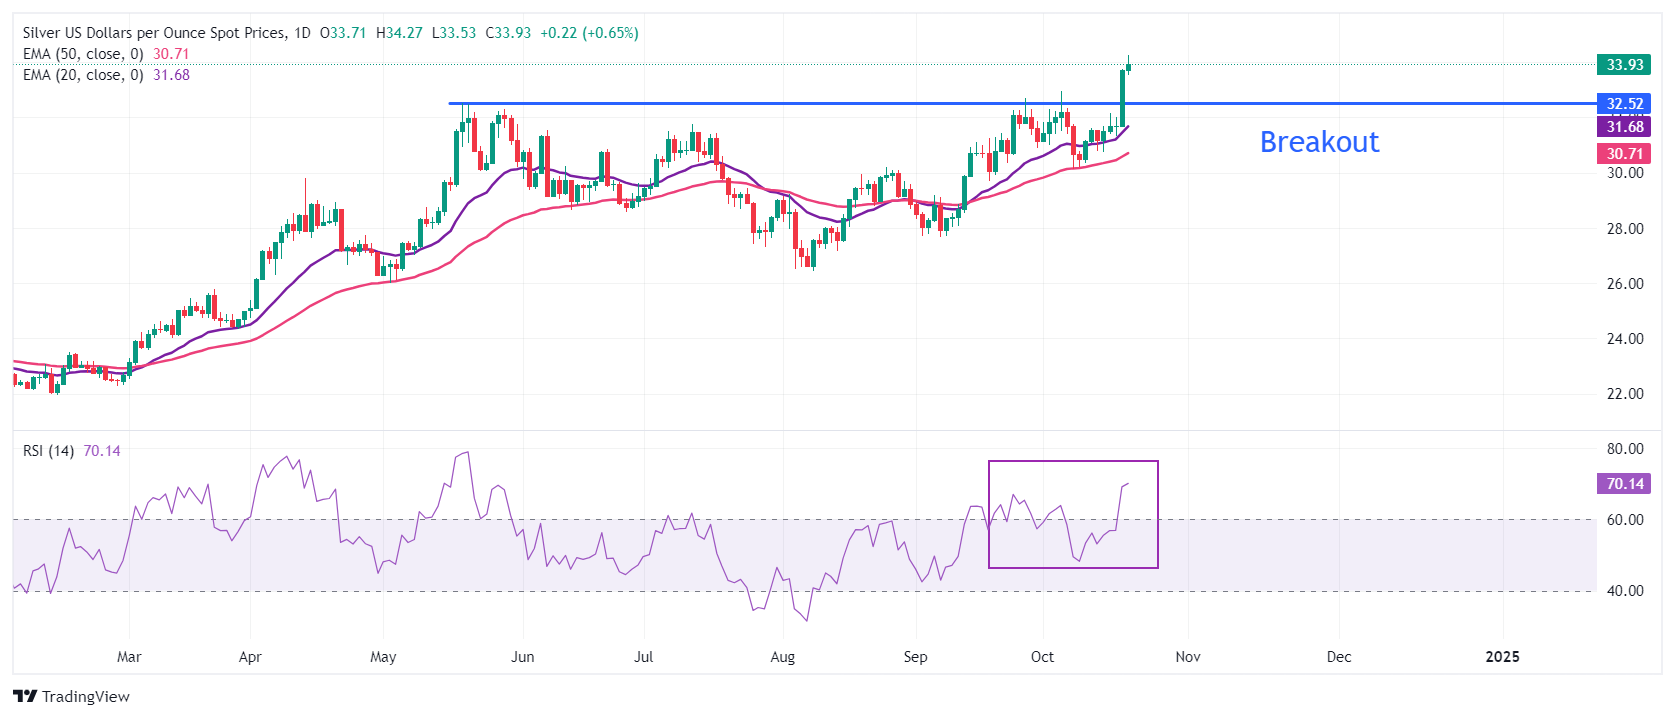
- Silver price posts a fresh high above 34.00 on multiple tailwinds.
- The white metal gains on the fresh escalation in the Middle East war and US presidential election uncertainty.
- The Fed is expected to reduce interest rates moderately.
Silver price (XAG/USD) jumps above $34.00 in Monday’s North American session for the first time in almost 12 years. The white metal strengthens on multiple tailwinds: continuing war between Israel and Iran, and growing uncertainty over United States (US) presidential elections.
Israel vowed to retaliate against Iran’s attack on October 1, as shown by leaked documents originating from the National Security Agency (NSA) and the Geospatial Intelligence Agency (GEOIN), which was authenticated by a US official, reported by The New York Times. The scenario of escalating geopolitical tensions improves the appeal of precious metals, such as Silver, as a safe haven.
The Silver’s safe-haven appeal has also been strengthened by neck-to-neck competition between US Vice President Kamala Harris and former US President Donald Trump for presidential elections on November 5.
Meanwhile, the US Dollar (USD) bounces back strongly after a mild correction on expectations that the Federal Reserve’s (Fed) policy-easing spell will be moderate in the remainder of the year. The US Dollar Index (DXY), which gauges the Greenback’s value against six major currencies, aims to recapture the 11-week high around 104.00.
Going forward, investors will pay close attention to the United States (US) flash S&P Global PMI data for October, which will be published on Thursday.
Silver technical analysis
Silver price strengthens after a breakout above the horizontal resistance plotted from the May 21 high of $32.50 on a daily timeframe. Upward-sloping 20- and 50-day Exponential Moving Averages (EMAs) near $30.70 and $31.70, respectively, signals more upside ahead.
The 14-day Relative Strength Index (RSI) oscillates above 60.00, points to an active bullish momentum.
Silver daily chart
Silver FAQs
Silver is a precious metal highly traded among investors. It has been historically used as a store of value and a medium of exchange. Although less popular than Gold, traders may turn to Silver to diversify their investment portfolio, for its intrinsic value or as a potential hedge during high-inflation periods. Investors can buy physical Silver, in coins or in bars, or trade it through vehicles such as Exchange Traded Funds, which track its price on international markets.
Silver prices can move due to a wide range of factors. Geopolitical instability or fears of a deep recession can make Silver price escalate due to its safe-haven status, although to a lesser extent than Gold's. As a yieldless asset, Silver tends to rise with lower interest rates. Its moves also depend on how the US Dollar (USD) behaves as the asset is priced in dollars (XAG/USD). A strong Dollar tends to keep the price of Silver at bay, whereas a weaker Dollar is likely to propel prices up. Other factors such as investment demand, mining supply – Silver is much more abundant than Gold – and recycling rates can also affect prices.
Silver is widely used in industry, particularly in sectors such as electronics or solar energy, as it has one of the highest electric conductivity of all metals – more than Copper and Gold. A surge in demand can increase prices, while a decline tends to lower them. Dynamics in the US, Chinese and Indian economies can also contribute to price swings: for the US and particularly China, their big industrial sectors use Silver in various processes; in India, consumers’ demand for the precious metal for jewellery also plays a key role in setting prices.
Silver prices tend to follow Gold's moves. When Gold prices rise, Silver typically follows suit, as their status as safe-haven assets is similar. The Gold/Silver ratio, which shows the number of ounces of Silver needed to equal the value of one ounce of Gold, may help to determine the relative valuation between both metals. Some investors may consider a high ratio as an indicator that Silver is undervalued, or Gold is overvalued. On the contrary, a low ratio might suggest that Gold is undervalued relative to Silver.
- EUR/JPY trades near the top of a ten-week range as the Euro remains supported by ECB Kazimir’s comments.
- Kazimir said the governing council would be watching the data closely in December and decide then what to do.
- The Yen comes under pressure as analysts see it at fair value and the governing ADP party underperforms in opinion polls.
EUR/JPY is trading at the top of a ten-week range in the upper 162.00s on Monday as the Euro (EUR) retains strength after comments from a European Central Bank (ECB) official suggested policymakers may not be in such a rush to lower interest rates whilst the Japanese Yen (JPY) remains under pressure following the release of lower-than-expected inflation data last week.
ECB policymaker and Slovakian central bank Governor Peter Kazimir noted on Monday that the December policy meeting is wide open, with all options remaining on the table. "If new information points in the direction of higher inflation risks, we can still slow down the pace at which we remove restrictions in the coming meetings," he said.
Kazimir also said that the ECB will be in a "strong and comfortable position" to continue the policy-easing cycle if the accelerated pace in disinflation is confirmed, per Reuters.
His comments follow more dovish market assessments of the trajectory of interest rates in the Eurozone after the ECB’s decision to cut its prime rates by 25 basis points (bps) (0.25%) at its meeting last Thursday.
Many analysts saw the ECB’s decision to enact two rate cuts in a row as a sign that the bank was accelerating its easing cycle and would therefore be likely to follow up with a cut and each of its next meetings until it had brought interest rates down to the “neutral level” of around 2.00%.
EUR/JPY keeps its upside as the Yen remains under pressure after opinion polls show the ruling ADP party lacks support and risks being replaced by the opposition who are likely to pursue a low-interest rate policy, according to Bloomberg News. The expectation of lower interest rates is likely to be negative for the Yen as it increases foreign capital outflows.
According to analysts at Scotiabank the Yen may be more or less at the level of its fair value, “The spot US Dollar/Yen is about where it should be, according to our fair value estimate (150.20).” They said in a recent note. The next main event for the Yen could be Bank of Japan (BoJ) Governor Ueda speaking at an International Money Fund (IMF) event on Wednesday.
Lower-than-expected Japanese inflation data released on Friday showed that Japan’s headline and core inflation rates slowed to a five-month low of 2.5% and 2.4%, respectively, in September. This could encourage the BoJ to keep interest rates low, further weighing on the Yen (supporting EUR/JPY).
The Yen’s recent bout of weakness prompted Japan’s top currency diplomat Atsushi Mimura to reiterate government warnings that they are closely watching currency moves and that excess volatility is undesirable. Japanese authorities intervened in the currency markets earlier this year.
- EUR/MXN has probably formed a Bull Flag price pattern.
- Such patterns signal the likelihood of more upside evolving.
EUR/MXN appears to be forming a Bull Flag price pattern, most clearly visible on the daily and weekly charts. Bull Flags are bullish continuation patterns.
EUR/MXN Daily Chart

The “flag pole” part of the pattern probably began at the August 15 lows and the “flag square” part has been developing since price peaked on September 5.
A breakout from the flag square would confirm the completion and activation of the Bull Flag. This, in turn, would and probably signal more upside towards a target at around 22.52 (Grey dashed line). This is equal to the length of the pole extrapolated higher. A break above the 22.07 September 26 high would confirm the extension.
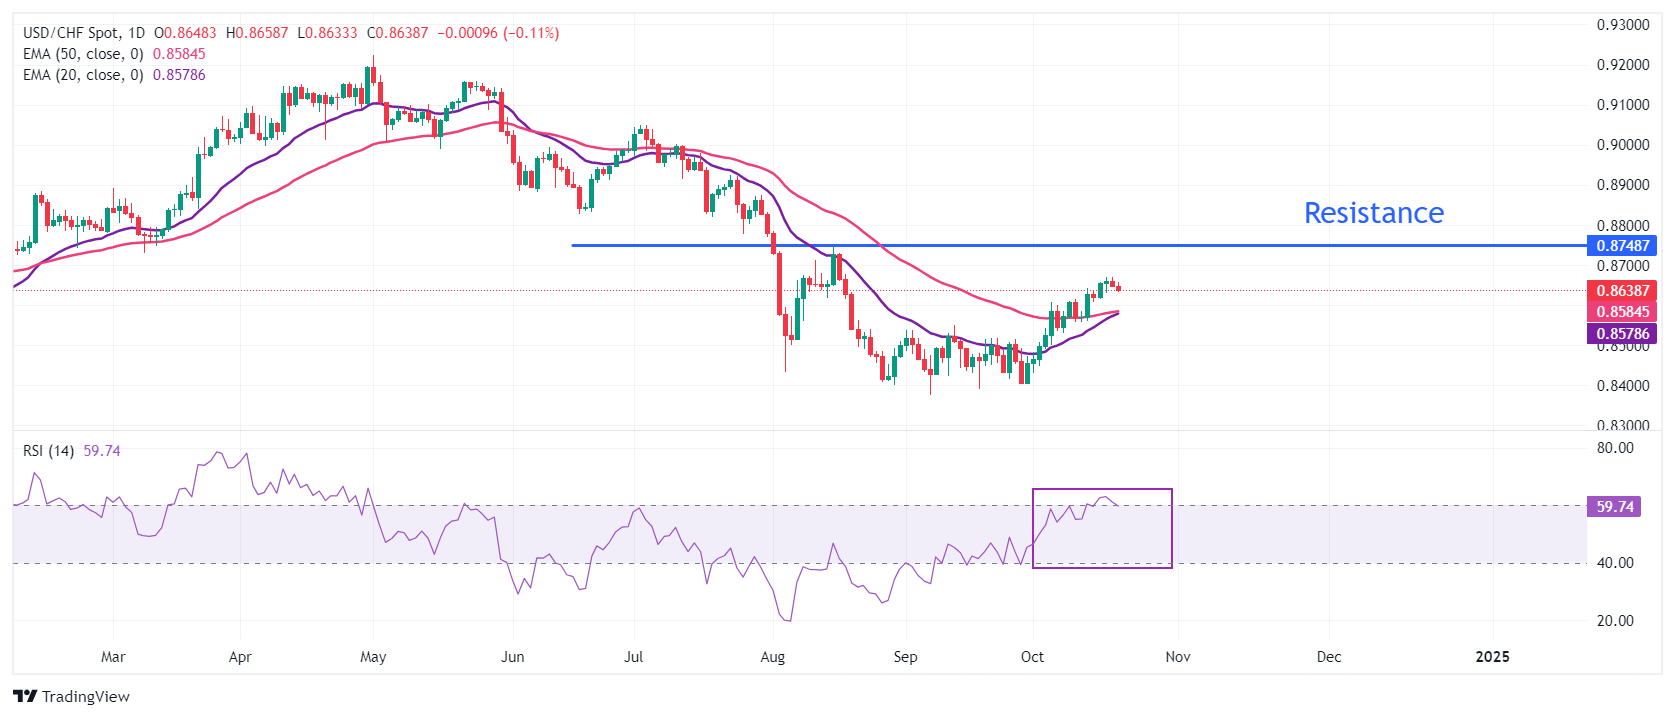
- USD/CHF drops to near 0.8630 even though the US Dollar resumes its upside journey.
- The SNB is expected to cut interest rates again in December.
- Investors expect the Fed to reduce interest rates gradually.
The USD/CHF pair drops to near 0.8630 from the two-month high of 0.8370 in Monday’s North American session. The Swiss Franc pair corrects even though the US Dollar (USD) rebounds after a mild sell-off on Friday, suggesting sheer strength in the Swiss currency.
Investors have underpinned the Swiss Franc against the Greenback despite the Swiss National Bank (SNB) is expected to cut interest rates again in December. This would be the fourth straight interest rate cut in a row.
The US Dollar Index (DXY), which tracks the Greenback’s value against six major currencies, bounces back to near 103.70 and aims to extend its upside above the 11-week high around 104.00. The appeal of the Greenback has strengthened as investors expect the Federal Reserve (Fed) to cut interest rates at a moderate pace.
According to the CME FedWatch tool, the Fed is expected to cut interest rates by 25 basis points (bps) in November and December. Earlier, traders were anticipating the Fed to deliver a larger-than-usual rate cut of 50 bps in November. However, they priced out the scenario after a slew of upbeat United States (US) economic data for September.
The upside move in the USD/CHF pair appears to have paused for a while. However, the upside move could resume after it breaks above October 17 high of 0.8670. A breakout move will drive the asset toward the round-level resistance of 0.8700 and the August 15 high of 0.8750.
In an alternate scenario, a downside move below the September 12 low of 0.8550 will drag the asset toward the psychological support of 0.8500, followed by the October 2 low of 0.8450.
The near-term trend is expected to remain upbeat as the asset trades above the 20- and 50-day Exponential Moving Averages (EMAs), which trade around 0.8580.
The 14-day Relative Strength Index (RSI) oscillates near 60.00. A bullish momentum would trigger if the RSI (14) sustains above 60.00.
USD/CHF daily chart
Swiss Franc FAQs
The Swiss Franc (CHF) is Switzerland’s official currency. It is among the top ten most traded currencies globally, reaching volumes that well exceed the size of the Swiss economy. Its value is determined by the broad market sentiment, the country’s economic health or action taken by the Swiss National Bank (SNB), among other factors. Between 2011 and 2015, the Swiss Franc was pegged to the Euro (EUR). The peg was abruptly removed, resulting in a more than 20% increase in the Franc’s value, causing a turmoil in markets. Even though the peg isn’t in force anymore, CHF fortunes tend to be highly correlated with the Euro ones due to the high dependency of the Swiss economy on the neighboring Eurozone.
The Swiss Franc (CHF) is considered a safe-haven asset, or a currency that investors tend to buy in times of market stress. This is due to the perceived status of Switzerland in the world: a stable economy, a strong export sector, big central bank reserves or a longstanding political stance towards neutrality in global conflicts make the country’s currency a good choice for investors fleeing from risks. Turbulent times are likely to strengthen CHF value against other currencies that are seen as more risky to invest in.
The Swiss National Bank (SNB) meets four times a year – once every quarter, less than other major central banks – to decide on monetary policy. The bank aims for an annual inflation rate of less than 2%. When inflation is above target or forecasted to be above target in the foreseeable future, the bank will attempt to tame price growth by raising its policy rate. Higher interest rates are generally positive for the Swiss Franc (CHF) as they lead to higher yields, making the country a more attractive place for investors. On the contrary, lower interest rates tend to weaken CHF.
Macroeconomic data releases in Switzerland are key to assessing the state of the economy and can impact the Swiss Franc’s (CHF) valuation. The Swiss economy is broadly stable, but any sudden change in economic growth, inflation, current account or the central bank’s currency reserves have the potential to trigger moves in CHF. Generally, high economic growth, low unemployment and high confidence are good for CHF. Conversely, if economic data points to weakening momentum, CHF is likely to depreciate.
As a small and open economy, Switzerland is heavily dependent on the health of the neighboring Eurozone economies. The broader European Union is Switzerland’s main economic partner and a key political ally, so macroeconomic and monetary policy stability in the Eurozone is essential for Switzerland and, thus, for the Swiss Franc (CHF). With such dependency, some models suggest that the correlation between the fortunes of the Euro (EUR) and the CHF is more than 90%, or close to perfect.
Federal Reserve Bank of Dallas President Lorie Logan argued on Monday that she anticipates further interest rate cuts by the Fed. She also indicated there are no obstacles to continuing the Fed's balance sheet reduction.
Key Quotes
Expects gradual rate cuts if economy meets forecasts.
Fed will need to be nimble with monetary policy choices.
Economy is strong and stable.
Sees downside risk to job market, ongoing risks to inflation goal.
Balance sheet cuts and rate cuts working in same direction.
Balance sheet drawdown part of policy normalization.
Liquidity still abundant in money markets.
Not surprised there’s some money market volatility.
Fed should tolerate some money market volatility.
Expects money markets close to or just above interest on reserves rate.
Over time wants ‘negligible’ balances in reverse repo facility.
Fed could change reverse repo rate if cash doesn’t leave facility.
Selling Fed owned mortgage bonds not current issue.
Rightmove House Price data for October were released over the weekend and showed a moderate (0.3%) rise in house prices last month, Scotiabank’s Chief FX Strategist Shaun Osborne notes.
GBP holds trading range around 1.30
“Prices were up 1.0% in the year (down a little from September’s 1.2% gain). Sterling is just along for the ride this morning, tracking losses among the core majors against the USD absent any market-moving news.”
“Cable is soft but holding within its recent trading range. The technical undertone remains weak, leaving spot prone to renewed losses and a retest of last week’s 1.2974 low. Resistance (minor bull trigger potentially) is 1.3065 on the day.”
Dovish comments from ECB Governors Simkus and Kazaks support market expectations for a further reduction in ECB rates in December, Scotiabank’s Chief FX Strategist Shaun Osborne notes.
EUR capped by 200-day MA in upper 1.08s
“But there is little appetite for large reductions in rates, comments suggest, which perhaps means markets expectations are a little stretched (32bps priced in for December at this point). EUR/USD is likely to remain under pressure in the short run but bargain hunters may become a bit more active around 1.08.”
“A decent rebound in the EUR late last week does not appear to signal a reversal in the EUR’s recent slide. The sell-off is looking over-extended on the intraday and daily oscillators but a firm cap appears to have been set on spot rebounds at 1.0872, where the 200-day MA sits currently.”
“Minor gains from Thursday’s low appear corrective ahead of renewed losses. Support is firm at 1.0780/00. Weakness below there targets 1.0650/00.”
The Canadian Dollar (CAD) is one of the better-performing currencies on the session when looking at overall ground lost versus the USD on the session but it is trading at session lows against the USD as our trading day gears up, Scotiabank’s Chief FX Strategist Shaun Osborne notes.
CAD weak but little changed in low 1.38s
“Wider spreads remain the primary drag on the CAD, as bond and swap spreads extend recent gains on firmer US yields generally and ahead of the BoC policy decision Wednesday. Markets have all but fully priced in a 50bps cut now, leaving the door wide open for the Bank to deliver. Could that mean the CAD gets a ‘sell the mystery, buy the history’ rebound after the fact? USD/CAD fair value is estimated at 1.3840 this morning.”
“The CAD looks soft and vulnerable to more losses on the charts. The only thing in the CAD’s favour is perhaps that this USD move higher is about as overcooked now as the USD sell-off was in August, oscillators suggest. That does not necessarily mean the USD will drop in the near term but it does mean the path higher may be a little harder from here.”
“Resistance remains 1.3850 and 1.3950. Support is 1.3750 and 1.3650.”
European Central Bank (ECB) policymaker and Slovakian central bank Governor Peter Kazimir said on Monday that they will be in a "strong and comfortable position" to continue the policy-easing cycle if the accelerated pace in disinflation is confirmed, per Reuters.
Kazimir further noted that the December policy meeting is wide open, with all options remaining on the table. "If new information points in the direction of higher inflation risks, we can still slow down the pace at which we remove restrictions in the coming meetings," he added.
Market reaction
These comments failed to trigger a noticeable market reaction. At the time of press, EUR/USD was down 0.15% on the day at 1.0850.
- USD/JPY broke out of its Wedge pattern but failed to fall far and has recovered.
- Underlying weakness shows up in the RSI’s divergence with price and could be a precursor to more weakness.
USD/JPY broke down and out of its Rising Wedge pattern on Friday but has since recovered and returned back inside.
The trend is at a delicate point and it is ambiguous. It is possible that the uptrend could be resuming and pushing price back up in a “last hurrah”.
USD/JPY 4-hour Chart
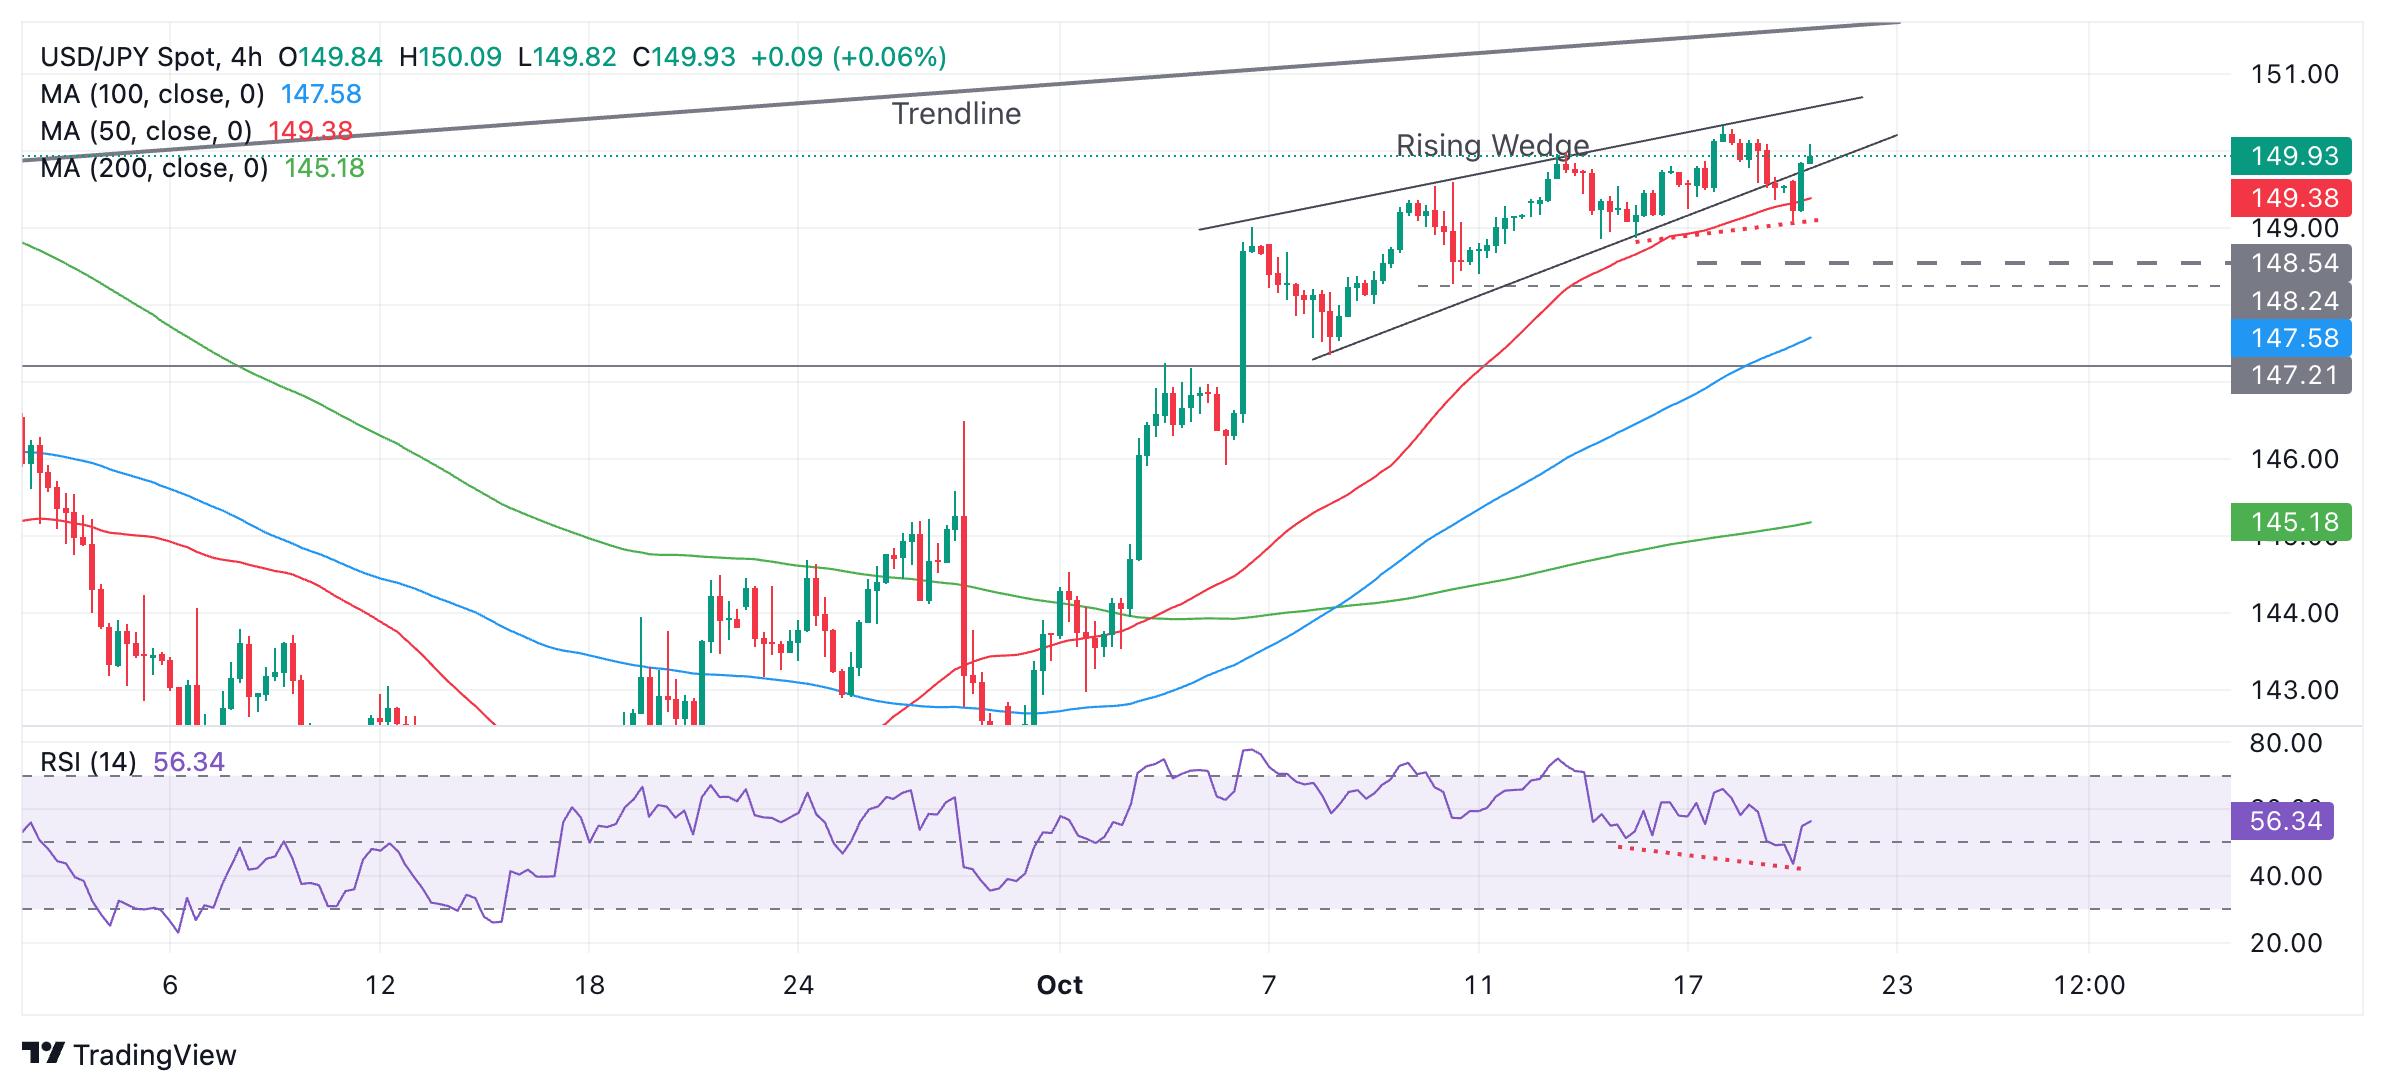
Alternatively, the bearish divergence between the Relative Strength Index (RSI) momentum indicator and price (red dotted lines) when comparing the October 16 and 21 lows is indicative of underlying bearish pressure, which, in turn, could suggest the pair could roll over and begin weakening again.
A break below the 149.09 low formed after the breakout would provide confirmation of more weakness and a change in the short-term trend. This would probably lead to a target at 148.40 as a minimum, which is the 61.8% Fibonacci extrapolation of the height of the wedge lower.
More downside could lead to support at 148.27 (October 10 low) or 147.23 (September 2 high).
The JPY is soft, near 150, reflecting the rebound in US yields and less supportive spreads, Scotiabank’s Chief FX Strategist Shaun Osborne notes.
JPY trades around 150
“Spot US Dollar/Yen is about where it should be, according to our fair value estimate (150.20) but Japanese officials are still likely to step up verbal support for their currency around these levels.”
“It’s a quiet start to the week for global markets data-wise. Over the balance of the week, global PMIs, the Fed’s Beige Book and (potentially) more China stimulus will move markets. BoJ Governor Ueda is expected to speak at an IMF event Wednesday.”
Will the markets can see higher EUR/USD levels again in the coming weeks? These questions are hardly surprising, given the weeks-long slide in EUR/USD that has taken the markets from 1.12 at the end of September to below 1.09. Moreover, as the end of the year approaches, this is a vital question for anyone who wants or needs to hedge, Commerzbank’s FX analysts Michael Pfister notes.
EUR/USD is likely to stabilise around current levels
“Looking at these data, it is not surprising that the movement since the end of September has been clearly driven by the US dollar, which has appreciated significantly since then. Perhaps more surprising is the fact that the euro has actually appreciated slightly against the G10 average over the same period, although this is not comparable to the huge appreciation of the US dollar. This means that in order to see significantly higher EUR/USD levels, we would probably need to see an end to the USD rally.”
“It is likely that the strong increase in jobs at the beginning of October will be revised downwards and, if our economists are right, the Fed will also make another rate cut. This should take some of the wind out of the dollar's sails. But it will be a few weeks before that happens. In addition, Donald Trump's chances of becoming US President again have increased recently. His economic proposals have the potential to trigger a strong USD rally, which could overshadow the labor market and the interest rate decision.”
“This does not mean that we will not see higher EUR/USD levels in the coming weeks. On Friday we saw already a small recovery. However, the risks are still clearly on the downside, which means that EUR/USD is likely to stabilise around current levels. At least until the US employment report comes in weaker and sends shockwaves through the market again.”
The US Dollar (USD) remains firm, supported by softer risk appetite and rising US Treasury yields, Scotiabank’s Chief FX Strategist Shaun Osborne notes.
USD firmer, supported by rising yields
“Global bonds are under pressure on the day but the rise in US 10Y yields through the October peak suggests that rebound may extend a little more at least. Bloomberg notes one analyst suggesting that the 10Y could reach 5% in the next six months on worries over persistent inflation and weak US fiscal policy.
“Fiscal excess is, in my opinion, a growing risk for the USD broadly but the impact of weak fiscal policy settings may be relatively slow-moving issue for FX—and may not factor in to markets until after the US election.’
- AUD/USD appears to be resuming its downtrend after a brief pull back.
- Should the pair break to lower lows it will signal a continuation of the trend south to lower targets.
AUD/USD seems to be resuming the downtrending move it began at the late-September highs, following a brief pull back.
AUD/USD Daily Chart
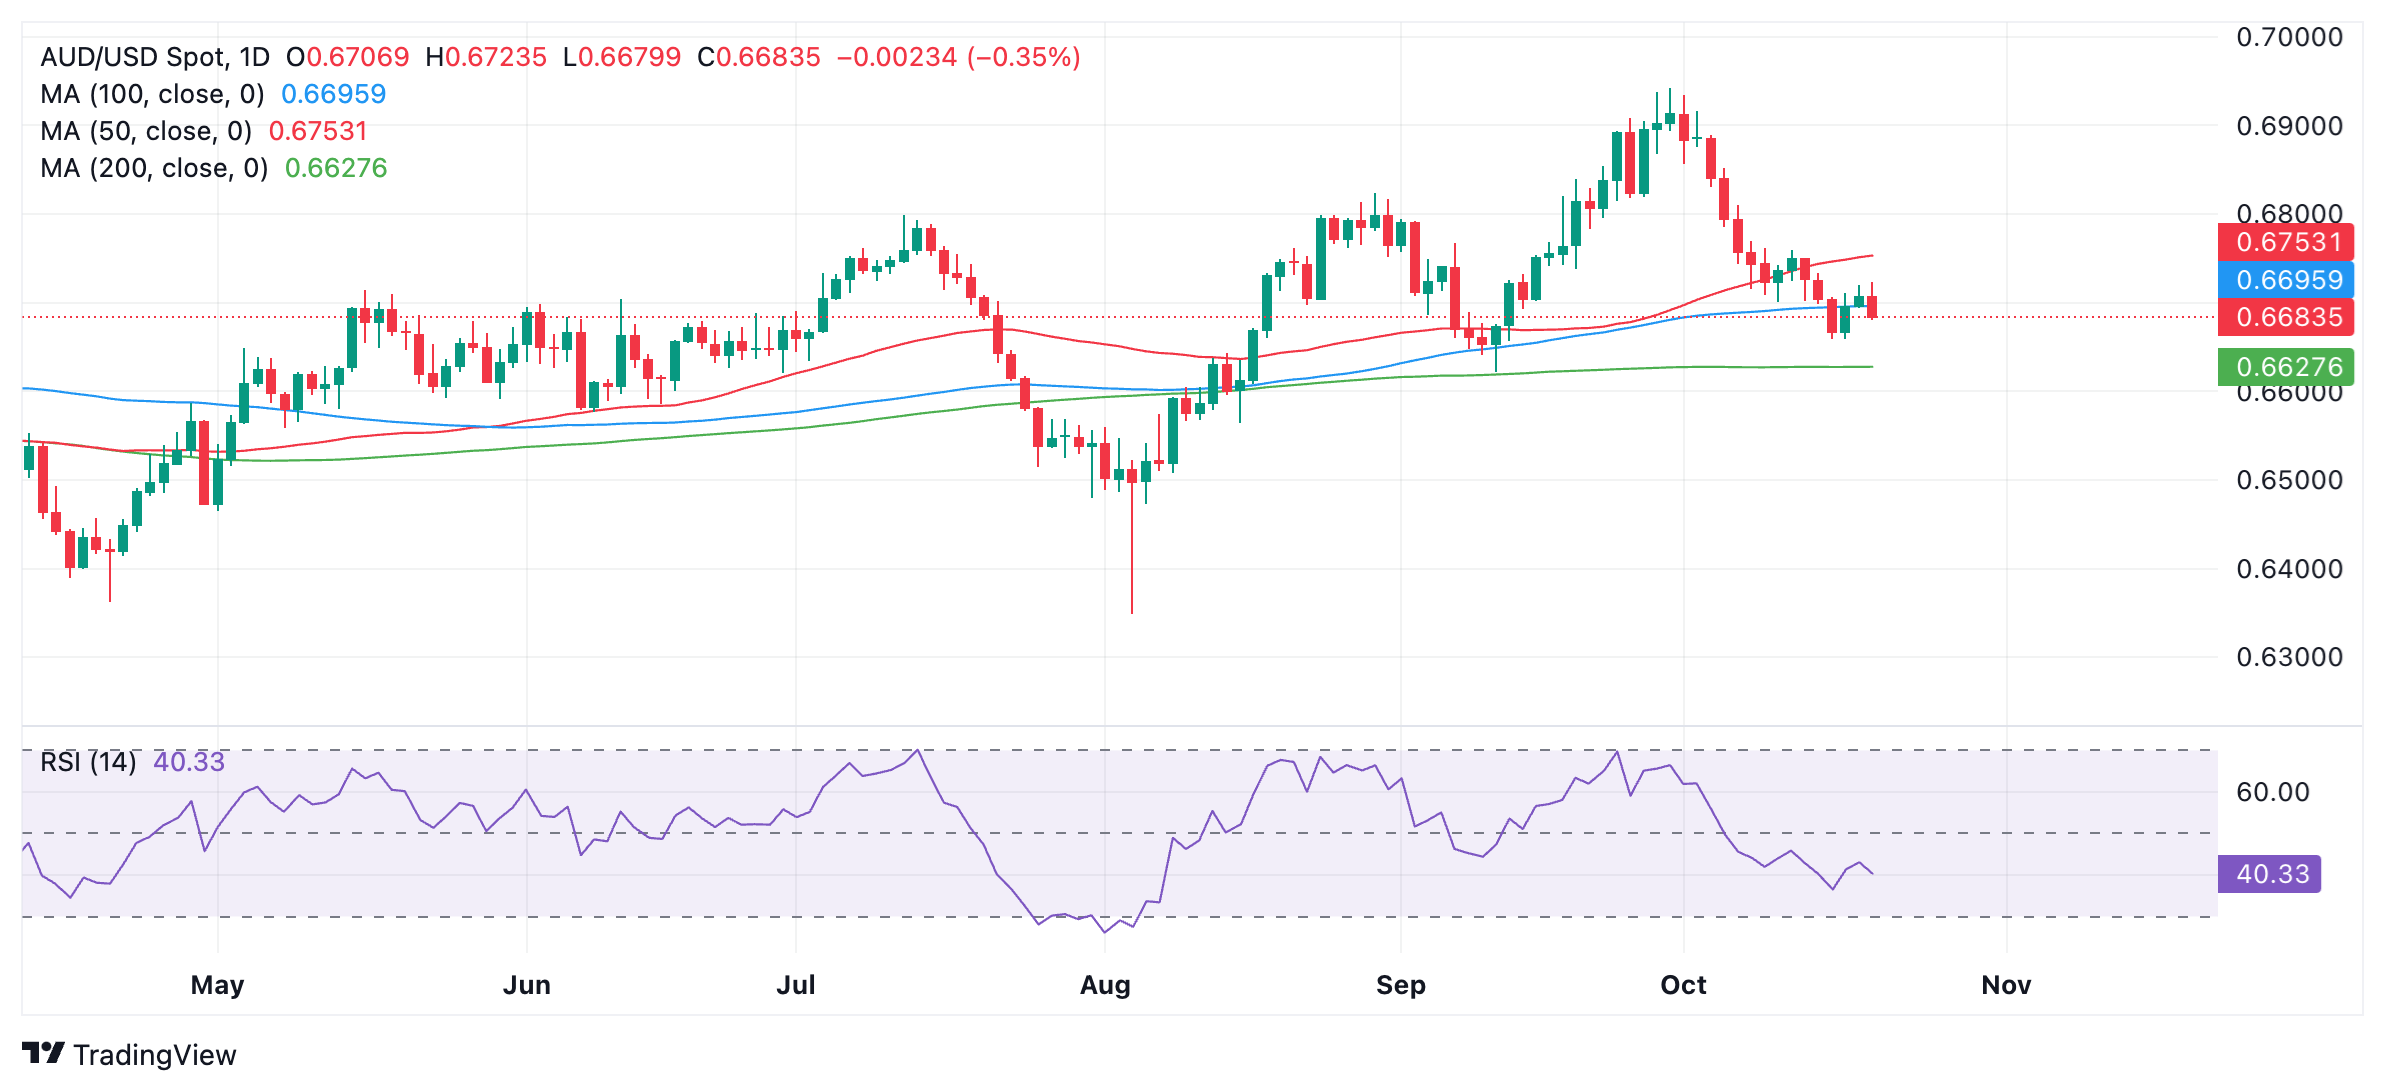
On Monday it is down by a third of a percent and is threatening to break below the October 16 low at 0.6658.
A break below that level would set a lower low and confirm the pair’s medium and short-term downtrending bias. Such a move would probably reach a target at the green 200-day Simple Moving Average (SMA) at 0.6628. Further weakness would be dependent on breaking below that level as well as the key September 11 swing low and support level, at 0.6622.
However, if successful, the next bearish target would come in at the 0.6565 August 15 swing low.
The trend is bearish on the short and medium term timeframes – indicating a bias towards more selling – but sideways on the long-term.
SMEI returned to expansionary territory at 50.7 in October, after staying below 50 for two months. Overall performance sub-index edged up to 50.2, the first above 50-reading since May. Manufacturing continued to outperform; real estate, construction and retail sales remained key drags. Easing monetary policy supported SME access to bank credit; funding costs from NBFIs fell further, Standard Chartered’s Hunter Chan and Shuang Ding note.
Demand outlook improved
“Our proprietary Small and Medium Enterprise Confidence Index (SMEI; Bloomberg: SCCNSMEI <Index>) edged up to 50.7 in October from 49.7 in September, leaving contractionary territory after two months on a broad-based improvement in the three key sub-indices. The performance sub-index rose to 50.2 in October from 48.9, ending four straight months of contraction. While sales remained subdued, the new orders, employment and profitability sub-indices bounced to above-50 levels. The expectations sub-index recovered to 50.3 from 49.6 prior.”
“While production activity declined m/m partly due to the National Day holidays, the manufacturing performance sub-index picked up on a solid increase in new orders. External demand remained robust. Cross-border trading SMEs reported a recovery in sales and higher new orders. Meanwhile, non-manufacturing performance remained soft, with real estate, construction, retail sales and wholesale, and other services SMEs continuing to report a m/m decline in overall activity.”
“The credit sub-index climbed to a five-month high of 51.7 in October, as banks were more willing to lend to SMEs. The People’s Bank of China (PBoC) lowered its policy rate and reserve requirement ratio (RRR) in late September. In addition, borrowing costs from non-bank financial institutions (NBFIs) fell for a second month. Expectations of CNY appreciation against the USD picked up again among SMEs.”
US Dollar (USD) net short positions have increased. Euro (EUR) net long positions have halved. GBP net long positions have decreased for the second week in a row, and JPY net long positions have decreased for three consecutive weeks, Rabobank’s FX analysts Jane Foley and Molly Schwartz note.
Longs decrease, shorts increase
“USD net short positions have increased, driven by an increase in short positions. US CPI inflation printed on October 10th, and registered higher than expected in both the headline and core measures, destroying investor hopes of a 50bps cut at the next meeting. On the spot market the USD is the best performing G10 currency in the month to date.”
“EUR net long positions have halved, driven by an increase in short positions. EUR/USD reached its lowest levels since August on October 17th, trading at lows of 1.0811. Greenback strength in the spot market has dominated in October and the EUR has slipped to the position of fourth strongest performing G10 currency month-to-date.”
“GBP net long positions have decreased for the second week in a row, driven by a decrease in long positions. GBP is still the best performing G10 currency year-to-date. The BoE is expected to cut rates by 25 bps in November, but it is still far from certain if the MPC can pick up the pace of rate cuts. JPY net long positions have decreased for three consecutive weeks, driven by an increase in short positions. The market is pricing in a no-change decision for the October 31st.”
- The Oil price recovers to near $70.00 after PBoC’s bigger-than-expected cut in its Loan Price Rate.
- Iranian oil and nuclear facilities are expected to remain safe from Israel’s attack.
- Investors await the S&P Global PMI for fresh guidance on the Oil demand outlook.
West Texas Intermediate (WTI), futures on NYMEX, bounces back to near $70.00 in Monday’s European session. The Oil price recovers strongly after a big boost from the People’s Bank of China’s (PBoC) larger-than-projected dovish decision on interest rates.
The PBoC cuts its one-year Loan Prime Rate by 25 basis points (bps) to 3.1%, with an intention to uplift economic growth, boosting spending and revive the realty sector. Additionally, the Chinese central bank cut the five-year LPR from 3.85% to 3.60%. Economists expected the PBoC to reduce its key borrowing rates by 20 bps.
A larger-than-usual PBoC interest rate cut has improved the Oil demand outlook as China is the largest importer of the black gold in the world. The overall action in the Oil price remained bearish in the past week as Beijing didn’t provide clarity on how the massive stimulus by China’s ministry will be allocated.
On the geopolitical front, comments from Israeli Prime Minister Benjamin Netanyahu last week that they will not attack on Iran’s non-military sites, which pointed to safety of Iran’s oil and nuclear facilities, has diminished fears of supply disruption.
Going forward, the Oil price will be influenced by the preliminary S&P Global Purchasing Managers’ Index (PMI) data for October of various nations, which will be published on Thursday.
Brent Crude Oil FAQs
Brent Crude Oil is a type of Crude Oil found in the North Sea that is used as a benchmark for international Oil prices. It is considered ‘light’ and ‘sweet’ because of its high gravity and low sulfur content, making it easier to refine into gasoline and other high-value products. Brent Crude Oil serves as a reference price for approximately two-thirds of the world's internationally traded Oil supplies. Its popularity rests on its availability and stability: the North Sea region has well-established infrastructure for Oil production and transportation, ensuring a reliable and consistent supply.
Like all assets supply and demand are the key drivers of Brent Crude Oil price. As such, global growth can be a driver of increased demand and vice versa for weak global growth. Political instability, wars, and sanctions can disrupt supply and impact prices. The decisions of OPEC, a group of major Oil-producing countries, is another key driver of price. The value of the US Dollar influences the price of Brent Crude Oil, since Oil is predominantly traded in US Dollars, thus a weaker US Dollar can make Oil more affordable and vice versa.
The weekly Oil inventory reports published by the American Petroleum Institute (API) and the Energy Information Agency (EIA) impact the price of Brent Crude Oil. Changes in inventories reflect fluctuating supply and demand. If the data shows a drop in inventories it can indicate increased demand, pushing up Oil price. Higher inventories can reflect increased supply, pushing down prices. API’s report is published every Tuesday and EIA’s the day after. Their results are usually similar, falling within 1% of each other 75% of the time. The EIA data is considered more reliable, since it is a government agency.
OPEC (Organization of the Petroleum Exporting Countries) is a group of 12 Oil producing nations who collectively decide production quotas for member countries at twice-yearly meetings. Their decisions often impact Brent Crude Oil prices. When OPEC decides to lower quotas, it can tighten supply, pushing up Oil prices. When OPEC increases production, it has the opposite effect. OPEC+ refers to an expanded group that includes ten extra non-OPEC members, the most notable of which is Russia.
China’s 3Q24 GDP growth was largely in line with consensus expectations at 4.6% y/y, 0.9% q/q sa (Bloomberg’s est: 4.5% y/y, 1.1% q/q; UOB est: 4.7% y/y, 1.1% q/q). September data showed improvement in momentum but no respite for housing market yet. UOB Group’s economist Ho Woei Chen notes.
3Q24 GDP growth moderation largely in line with consensus
“China’s 3Q24 GDP growth was largely in line with consensus expectations and clocked a growth of 4.8% YTD. Nominal GDP growth has remained below the real GDP growth rate, indicating that deflationary pressure has yet to abate which was also evident in Sep CPI and PPI.”
“September data was largely positive with an acceleration in momentum for industrial production, retail sales and urban fixed asset investment while the unemployment rate unexpectedly fell. However, sustained pace of declines in property prices and sales values put a dampener on the recovery outlook.”
“We maintain our growth forecast for China at 4.9% this year and 4.6% in 2025. Anticipation is building around the meeting of the Standing Committee of the National People’s Congress (NPC) later this month to announce the details of the fiscal stimulus following the approval process. This will have an impact on the China’s growth outlook, especially for next year.”
- The US Dollar trades flat to mildly up as the possible escalation in the Middle East conflict drives flows towards the Greenback.
- Fed speakers are starting to align with market expectations for gradual to no rate cuts in the near future.
- The US Dollar Index rally could pick up steam if Donald Trump leads further in the polls.
The US Dollar (USD) opens broadly flat on Monday as three main factors provide some support for the Greenback. The first one is geopolitics, with Israel’s Prime Minister Benjamin Netanyahu vowing to step up retaliations after an Iranian drone struck near his private residence over the weekend. The second driver is coming from the Federal Reserve (Fed) after a few of its officials called for a gradual approach to reduce interest rates (or even no rate cuts) in order to retain control of inflation. Finally, the third driver is the upcoming US presidential election on November 5 with a small lead on the betting websites for former US President Donald Trump, which supports a stronger US Dollar.
The US calendar is very light in terms of economic data on Monday. Besides the US Treasury set to issue some more debt into the markets, four Fed members will speak. Markets will want to look for further confirmation from the Fed on the rate cut projections for the meetings in November and December after Atlanta Fed President Raphael Bostic said last week that the Fed should refrain from cutting.
Daily digest market movers: The ball is rolling
- Federal Reserve Bank of Dallas President Lorie Logan is set to speak at 12:55 GMT. Logan participates in a conversation at the 2024 SIFMA (Securities Industry and Financial Markets Association) Annual Meeting.
- At 17:00 GMT, Federal Reserve Bank of Minneapolis President Neel Kashkari participates in a town hall event hosted by the Chippewa Falls Chamber of Commerce in Chippewa Falls, Wisconsin.
- At 21:05 GMT, Federal Reserve Bank of Kansas City President Jeffrey Schmid delivers remarks about the US economic and monetary policy outlook at an event organized by the Chartered Financial Analyst Society in Kansas City.
- Federal Reserve Bank of San Francisco President Mary Daly is set to participate in a moderated Q&A session with the Wall Street Journal's Nick Timiraos at the 2024 WSJ Tech Live at 22:40 GMT.
- Equities are taking a breather on Monday and are looking for a direction. Minor gains or losses overall, with just the Chinese Hang Seng closing down by more than 1.5% on Monday.
- The CME Fed rate expectation for the meeting on November 7 shows a 92.3% probability of a 25 basis points (bps) rate cut, while the remaining 7.7% is pricing in no rate cut. Chances for a 50 bps rate cut have been fully priced out.
- The US 10-year benchmark rate is trading at 4.09% after having flirted with a break below 4% on Wednesday.
US Dollar Index Technical Analysis: The beginning of something big
The US Dollar Index (DXY) holds strong near last week’s peak. Expectations of a gradual approach to interest rate cuts by the Fed would support a stronger US Dollar. More upside could take place should former President Donald Trump take a further lead in the polls or gain a swing state majority, or should geopolitical tensions in the Middle East swirl further out of control.
A firm resistance ahead is 103.80, which aligns with the 200-day SMA. Above that, there is a small gap before hitting the pivotal level at 103.99 (the June 4 low) and the 104.00 big figure. Should geopolitical tensions increase or Trump further lead in the polls, a rapid swing up to the 105.00 round level and 105.53 (the April 11 high) could be on the cards.
On the downside, the 100-day SMA at 103.19 and the pivotal level at 103.18 (the March 12 high) are now acting as support and should prevent the DXY from falling lower. With the Relative Strength Index in overbought territory, a test on this level looks granted. Further down, the 55-day SMA at 101.86 and the pivotal level at 101.90 (the December 22, 2023, high) should avoid further downside moves.
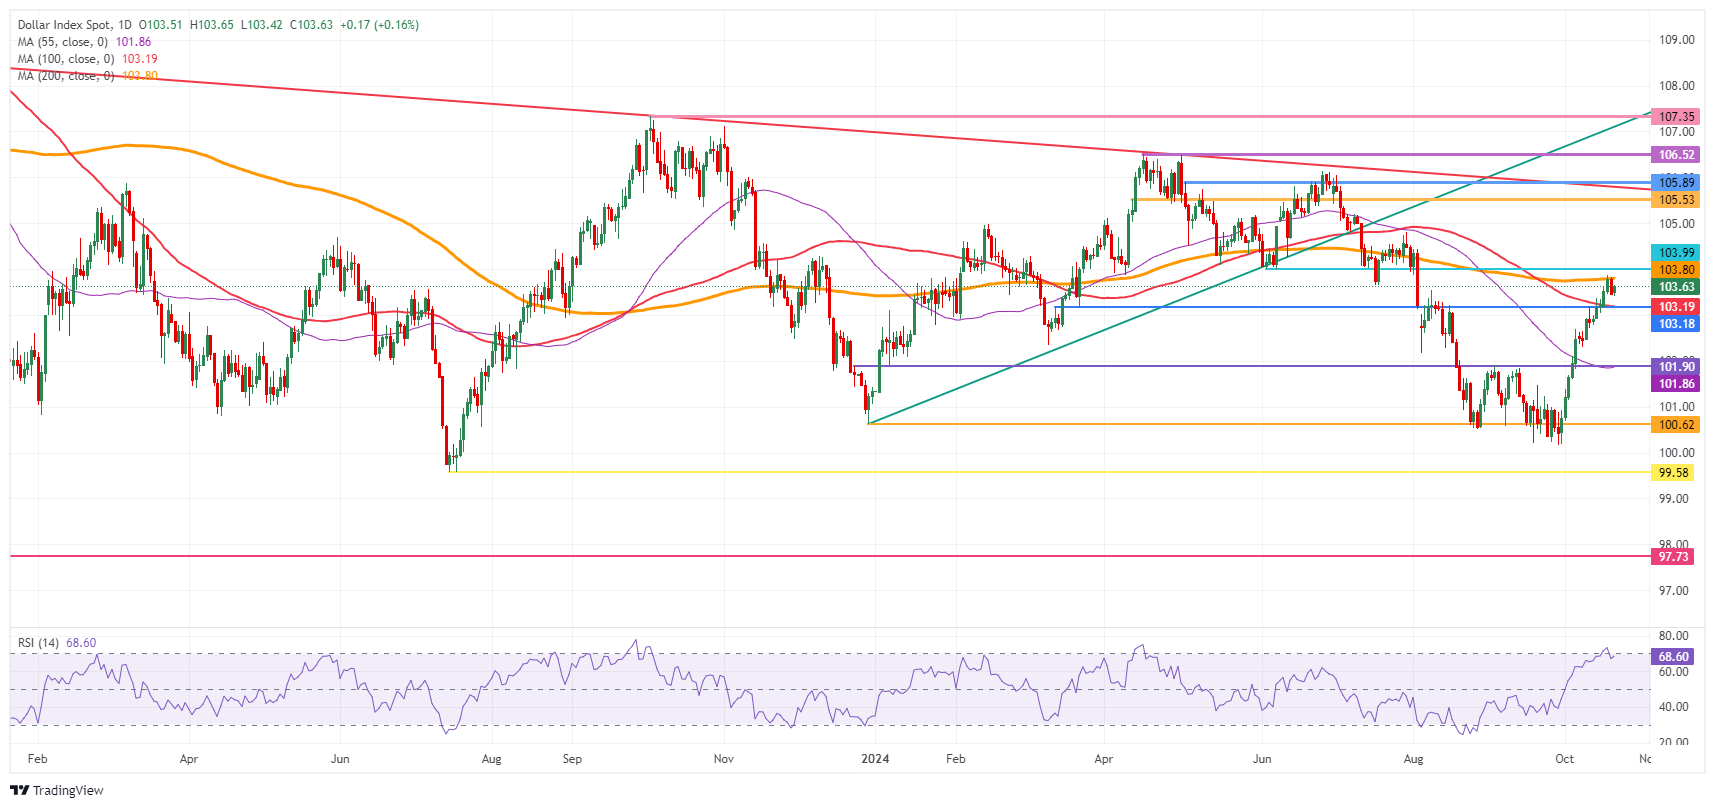
US Dollar Index: Daily Chart
US Dollar FAQs
The US Dollar (USD) is the official currency of the United States of America, and the ‘de facto’ currency of a significant number of other countries where it is found in circulation alongside local notes. It is the most heavily traded currency in the world, accounting for over 88% of all global foreign exchange turnover, or an average of $6.6 trillion in transactions per day, according to data from 2022. Following the second world war, the USD took over from the British Pound as the world’s reserve currency. For most of its history, the US Dollar was backed by Gold, until the Bretton Woods Agreement in 1971 when the Gold Standard went away.
The most important single factor impacting on the value of the US Dollar is monetary policy, which is shaped by the Federal Reserve (Fed). The Fed has two mandates: to achieve price stability (control inflation) and foster full employment. Its primary tool to achieve these two goals is by adjusting interest rates. When prices are rising too quickly and inflation is above the Fed’s 2% target, the Fed will raise rates, which helps the USD value. When inflation falls below 2% or the Unemployment Rate is too high, the Fed may lower interest rates, which weighs on the Greenback.
In extreme situations, the Federal Reserve can also print more Dollars and enact quantitative easing (QE). QE is the process by which the Fed substantially increases the flow of credit in a stuck financial system. It is a non-standard policy measure used when credit has dried up because banks will not lend to each other (out of the fear of counterparty default). It is a last resort when simply lowering interest rates is unlikely to achieve the necessary result. It was the Fed’s weapon of choice to combat the credit crunch that occurred during the Great Financial Crisis in 2008. It involves the Fed printing more Dollars and using them to buy US government bonds predominantly from financial institutions. QE usually leads to a weaker US Dollar.
Quantitative tightening (QT) is the reverse process whereby the Federal Reserve stops buying bonds from financial institutions and does not reinvest the principal from the bonds it holds maturing in new purchases. It is usually positive for the US Dollar.
USD/SGD traded lower, in line with our call for pullback. Pair was last at 1.3128 levels, OCBC’s FX analyst Frances Cheung and Christopher Wong note.
Daily momentum is bullish
“Move lower came amid broad pullback in USD. Daily momentum is bullish while RSI turned lower from near overbought conditions. Further pullback likely.
“Support at 1.3020 (50 DMA), 1.2970/80 levels (23.6% fibo, 21 DMA). Resistance at 1.3140/50 levels (recent high), 1.32 levels (50% fibo retracement of Jul high to Sep low).”
“Decline in S$NEER has moderated and is now stabilizing in its range of 1.6 – 2% above model implied mid. Last estimated at 1.7% above model-implied mid.”
We've had a bullish view on EUR/GBP this year, largely because we had felt that the market was mispricing the Bank of England cycle, ING’s FX analyst Chris Turner notes.
The 1.30 level looks vulnerable for GBP/USD
“We still believe that to be the case, but the problem is that the ECB cycle has moved substantially to the downside too as the ECB has proved more dovish than we were expecting.”
“For this week, we have four speeches from BoE Governor Andrew Bailey. We still think the market is under-pricing the pace of the BoE easing cycle – and should Bailey add to some of his rare comments that the BoE could become more 'activist' in its easing, sterling could come under pressure.”
“That may more be felt against the dollar than the euro, with the 1.30 level looking vulnerable for GBP/USD. Thursday's release of the UK PMI should also have a big say on whether sterling continues to out-perform or perhaps succumbs to some dovish BoE rhetoric.”
The US Dollar (USD) is likely to trade in a range between 7.0990 and 7.1330. In the longer run, momentum is slowing; a breach of 7.0900 would indicate that USD is more likely to trade in a range instead of strengthening further, UOB Group’s FX analysts Quek Ser Leang and Peter Chia note.
After breaking below 7.0900 USD to stop going up
24-HOUR VIEW: “Our view for USD to trade in a range between 7.1180 and 7.1480 last Friday was incorrect. Instead of trading in a range, USD dropped to a low of 7.1096, closing at 7.1159 (-0.29%). Despite the decline, there has been no clear increase in downward momentum. Today, we continue to expect USD to trade in a range, probably between 7.0990 and 7.1330.”
1-3 WEEKS VIEW: “Our most recent narrative was from last Wednesday (16 Oct, spot at 7.1350), wherein the recent strong and sudden surge suggests further USD strength to 7.1600, potentially 7.1900. We added, ‘To keep the momentum going, USD must not break below the ‘strong support’ level, now at 7.0900.’ After the strong rise, USD has not been able to build on its gain. Momentum is beginning to slow, and a breach of 7.0900 would indicate that USD is more likely to trade in a range instead of strengthening further.”
EUR/USD is licking its wounds after a tough week, ING’s Chris Turner notes.
EUR/USD to stay relatively offered in a 1.08-1.09 range
“Two key drivers have been: a) the market's repricing of a potential Trump victory presaging a potentially tariff-inflicted period for world trade, and b) European Central Bank President Christine Lagarde throwing more fuel on the dovish bonfire with her press conference last Thursday.”
“With two-year EUR:USD swap differentials now very wide at 141bp and weighing on EUR/USD, there will be much focus on the ECB speakers in Washington this week. Here, we'd pick out Lagrade speaking to Bloomberg TV tomorrow and Chief Economist Philip Lane speaking on Wednesday.”
“Thursday's release of PMIs across the Eurozone region will also be crucial to EUR/USD this week. Lagarde surprised some last Thursday by elevating the importance of the PMIs in ECB decision-making. Unless there is a miraculous recovery in these (which seems unlikely), EUR/USD should stay relatively offered in a 1.08-1.09 range.”
The US Dollar (USD) is likely to trade in a sideways range of 149.00/150.00. In the longer run, momentum has improved slightly; it remains to be seen if USD could rise to 151.00, UOB Group’s FX analysts Quek Ser Leang and Peter Chia note.
USD can rise to 151.00
24-HOUR VIEW: “After USD soared to a 2-1/2-month high of 150.32 last Thursday, we highlighted on Friday that ‘the advance appears to be running ahead of itself, and USD is unlikely to rise much further.’ We held the view that USD ‘is more likely to trade in a 149.40/150.35 range.’ USD then traded sideways between 149.35 and 150.28, closing at 149.52 (-0.45%). Further sideways trading appears likely today, expected to be in a range of 149.00/150.00.”
1-3 WEEKS VIEW: “Our update from last Friday (18 Oct, spot at 150.00) still stands. As highlighted, while USD rose to 150.32, upward momentum has only improved slightly, and it remains to be seen if USD could rise to 151.00. On the downside, a clear break below 149.00 would indicate that the USD strength from early this month has ended.”
USD/JPY eased lower, tracking the dip in UST yields last Fri while markets continue to watch BoJ rhetoric. USD/JPY was last at 150.02, OCBC’s FX analyst Frances Cheung and Christopher Wong note.
Bias for pullback play
“Last Friday, Governor Ueda said that the outlook for overseas economies including the US is uncertain and financial markets continue to be unstable. He also said that the FX rate is now more likely to impact prices than in the past.”
“Earlier, FX chief Mimura flagged ‘sudden, one-sided move’ in FX. He also said ‘We’ll keep monitoring the forex market with a high sense of urgency, including any speculative moves.”
“Bullish momentum on daily chart shows signs of fading while RSI shows signs of easing from near overbought conditions. Bias for pullback play. Support seen at 148, 147 (21 DMA). Resistance at 150.70/80 levels (50% fibo retracement of Jul high to Sep low, 100 DMA).”
- USD/CAD strives to revisit the immediate resistance of 1.3840 ahead of the BoC’s policy decision on Wednesday.
- The BoC is expected to cut interest rates by 50 bps to 3.75%.
- The next move in the US Dollar will be influenced by headlines regarding US presidential elections.
The USD/CAD pair extends its winning spree for the third trading session on Monday. The Loonie pair sustains above 1.3800 and aims to recapture the 11-month high of 1.3840 ahead of the Bank of Canada’s (BoC) interest rate decision, which will be announced on Wednesday.
Economists expect the BoC to cut its borrowing rates for the fourth time in a row. However, the pace at which it is expected to lower interest rates is larger-than-usual. With Canadian inflation remaining under control and the jobless rate beyond 6% despite back-to-back rate cuts, the BoC is expected to cut rates by 50 basis points (bps) to 3.75%.
This would keep the Canadian Dollar (CAD) on the back for a longer period as other central bankers such as the Federal Reserve (Fed), the Bank of England (BoE), and the European Central Bank (ECB) are expected to follow a gradual policy-easing cycle.
Meanwhile, sheer strength in the US Dollar (USD) has also kept the Loonie pair on the front foot. The US Dollar Index (DXY), which tracks the Greenback’s value against six major currencies, resumes its upside journey after a mild correction on Friday. Growing uncertainty over the United States (US) presidential elections has strengthened the US Dollar’s appeal as a safe haven.
USD/CAD witnessed strong buying interest after a breakout above the September 19 high around 1.3650.
The near-term outlook of the Loonie pair has strengthened further as the 20- and 50-day Exponential Moving Averages (EMAs) near 1.3645 and 1.3690, respectively, are sloping higher.
The 14-day Relative Strength Index (RSI) oscillates inside the bullish range of 60.00-80.00, pointing to an active momentum.
More upside towards the round-level resistance of 1.3900 and Year-To-Date (YTD) high of 1.3945 would appear if the pair decisively breaks above April 16 high of 1.3846.
In an alternate scenario, a downside move below the September 19 high of around 1.3650 will expose the asset to a May 16 low near 1.3600, followed by a September 13 high of 1.3538.
USD/CAD daily chart
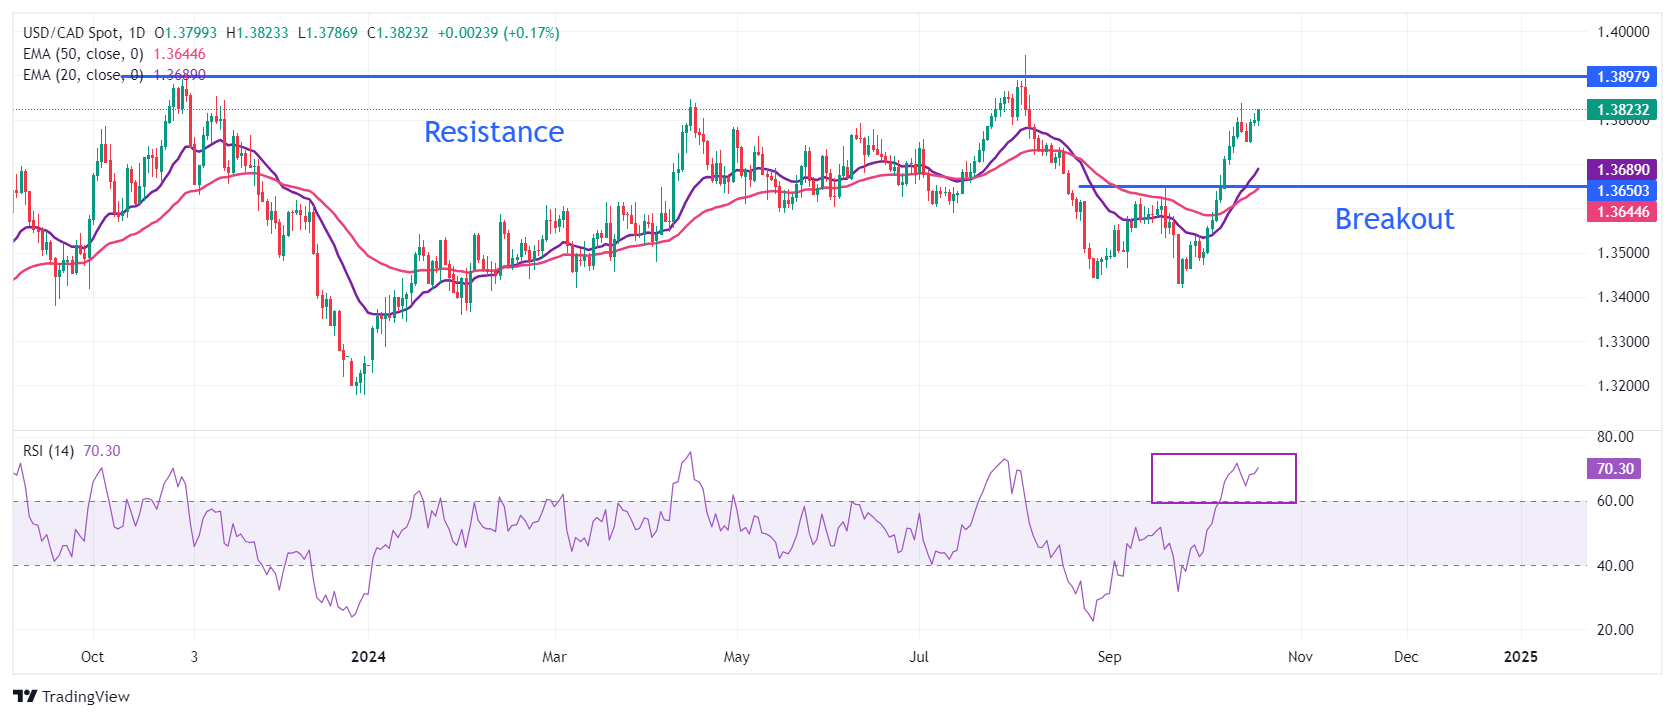
Canadian Dollar FAQs
The key factors driving the Canadian Dollar (CAD) are the level of interest rates set by the Bank of Canada (BoC), the price of Oil, Canada’s largest export, the health of its economy, inflation and the Trade Balance, which is the difference between the value of Canada’s exports versus its imports. Other factors include market sentiment – whether investors are taking on more risky assets (risk-on) or seeking safe-havens (risk-off) – with risk-on being CAD-positive. As its largest trading partner, the health of the US economy is also a key factor influencing the Canadian Dollar.
The Bank of Canada (BoC) has a significant influence on the Canadian Dollar by setting the level of interest rates that banks can lend to one another. This influences the level of interest rates for everyone. The main goal of the BoC is to maintain inflation at 1-3% by adjusting interest rates up or down. Relatively higher interest rates tend to be positive for the CAD. The Bank of Canada can also use quantitative easing and tightening to influence credit conditions, with the former CAD-negative and the latter CAD-positive.
The price of Oil is a key factor impacting the value of the Canadian Dollar. Petroleum is Canada’s biggest export, so Oil price tends to have an immediate impact on the CAD value. Generally, if Oil price rises CAD also goes up, as aggregate demand for the currency increases. The opposite is the case if the price of Oil falls. Higher Oil prices also tend to result in a greater likelihood of a positive Trade Balance, which is also supportive of the CAD.
While inflation had always traditionally been thought of as a negative factor for a currency since it lowers the value of money, the opposite has actually been the case in modern times with the relaxation of cross-border capital controls. Higher inflation tends to lead central banks to put up interest rates which attracts more capital inflows from global investors seeking a lucrative place to keep their money. This increases demand for the local currency, which in Canada’s case is the Canadian Dollar.
Macroeconomic data releases gauge the health of the economy and can have an impact on the Canadian Dollar. Indicators such as GDP, Manufacturing and Services PMIs, employment, and consumer sentiment surveys can all influence the direction of the CAD. A strong economy is good for the Canadian Dollar. Not only does it attract more foreign investment but it may encourage the Bank of Canada to put up interest rates, leading to a stronger currency. If economic data is weak, however, the CAD is likely to fall.
Momentum is beginning to slow; the likelihood of the New Zealand Dollar (NZD) declining further to 0.6005 has decreased, UOB Group’s FX analysts Quek Ser Leang and Peter Chia note.
Likelihood of NZD declining to 0.6005 decreases
24-HOUR VIEW: “We noted last Friday that ‘momentum indicators are mostly flat, and we continue to expect NZD to trade in a range, probably between 0.6040 and 0.6080.’ NZD then traded in a narrower range of 0.6055/0.6079. Momentum indicators remain flat, and we continue to expect NZD to trade in a range, likely between 0.6055 and 0.6090.”
1-3 WEEKS VIEW: “In our most recent narrative from last Wednesday (16 Oct, spot at 0.6060), we highlighted that NZD ‘is likely to decline further, and the level to watch is 0.6005.’ We also highlighted that ‘Overall, only a breach of 0.6115 (‘strong resistance’ level) would mean that the weakness in NZD that started early this month has stabilised.’ NZD traded in a quiet manner the last couple of days. Momentum is beginning to slow, and the likelihood of NZD declining further to 0.6005 has decreased.”
FX markets seem to be positioning for a Trump victory in next month's US presidential election. October seems to have been a good month for Donald Trump in opinion polls and the US Dollar (USD) is bid across the board. Interestingly in the week to last Tuesday (15th) speculators and in particular asset managers bought the USD heavily against the euro, but also against the Canadian dollar. Canadian dollar and Mexican peso would not have as easy a ride as they did back in 2018/19 if Trump was re-relected, ING’s FX analyst Chris Turner notes.
USD is rallying broadly
“It is with US elections looming large that FX markets this week face the challenge of geopolitics. The IMF meetings in Washington are more a forum for central bankers to share their latest views (and many central bank governors will be speaking), but we also have Russia hosting a BRICS summit and no end in sight for Middle East tension. Geopolitics in the driving seat is evidenced by gold pushing above $2700/oz even though the USD is rallying broadly.”
“It is hard to see this dynamic changing substantially over the next couple of weeks. On Wednesday, the Federal Reserve does release its Beige Book report ahead of the next FOMC meeting on 7 November. Many believe the soft showing of the prior Beige Book release prompted the FOMC to start with a 50bp cut in September. This release is probably seen as the biggest threat to the USD this week. Yet, US consumption and the labour market have held up recently, and there is no guarantee that this week's Beige Book release will push interest rate markets into pricing 50bp of Fed easing this year compared to current pricing of just 43bp.”
“The USD has come quite a long way in a short space of time. But unless the Beige Book surprises on the downside or Thursday's European PMIs miraculously surprise on the upside, it seems that DXY will probably stay bid in the top end of a 103-104 range.”
- The Pound Sterling remains under pressure but it could rebound as market participants reassess the BoE rate cut path.
- Unexpectedly strong UK Retail Sales data for September could dampen expectations that the BoE will opt for large interest-rate cuts.
- Kamala Harris leads by a slight margin in national polls against Donald Trump in US presidential elections.
The Pound Sterling (GBP) weakens slightly against its major peers at the start of the week. The British currency, which has suffered in the past weeks on the broad assessment that the Bank of England (BoE) will cut interest rates aggressively, could now be facing a different scenario after the release of strong United Kingdom (UK) Retail Sales data for September.
The Retail Sales data, a key measure for consumer spending, surprisingly rose by 0.3% month-over-month. Economists had projected a decline in the consumer spending measure at a similar pace.
Before the UK Retail Sales data, traders started pricing in the BoE to cut interest rates in both the policy meetings remaining this year amid slowing inflation. However, upbeat Retail Sales data is expected to weigh on bets supporting the BoE to cut its key borrowing rates in December.
For more guidance on interest rates, investors will pay close attention to speeches from BoE Governor Andrew Bailey, Governor Sarah Breeden, and policymaker Megan Greene on Tuesday. Bailey will speak several times during the week.
On the economic front, investors will focus on the preliminary S&P Global/CIPS Composite Purchasing Managers’ Index (PMI) data for October, which will be published on Thursday. The overall business activity is expected to have expanded at a slower pace.
Daily digest market movers: Pound Sterling underperforms US Dollar
- The Pound Sterling drops to near 1.3020 against the US Dollar (USD) in Monday’s London session. The GBP/USD pair stays under pressure as the US Dollar resumes its upside journey after a slight correction on Friday. The Greenback gains on expectations that the policy-easing cycle from the Federal Reserve (Fed) will be more gradual than previously expected.
- According to the CME FedWatch tool, 30-day Federal Funds futures pricing data shows that the Fed will lower rates by 50 basis points (bps) in the remaining year, suggesting that the US central bank will cut its borrowing rates by 25 bps both in November and December. The Fed seems to follow a moderate policy-easing cycle as a string of upbeat United States (US) data for September has diminished risks of an economic slowdown.
- However, Atlanta Fed Bank President Raphael Bostic said on Friday that he sees only one interest rate cut in the remaining two meetings this year. Bostic added that he sees the federal funds rate heading between 3% and 3.5% at the end of 2025, but that he is not in a rush to reach this neutral level.
- Meanwhile, the immediate reaction in the US Dollar will be guided by how speculation over US presidential elections will shape going forward. Currently, Vice President Kamala Harris is running ahead of former President Donald Trump in national polls, according to the Emerson College’s poll.
Technical Analysis: Pound Sterling hovers near 1.3000
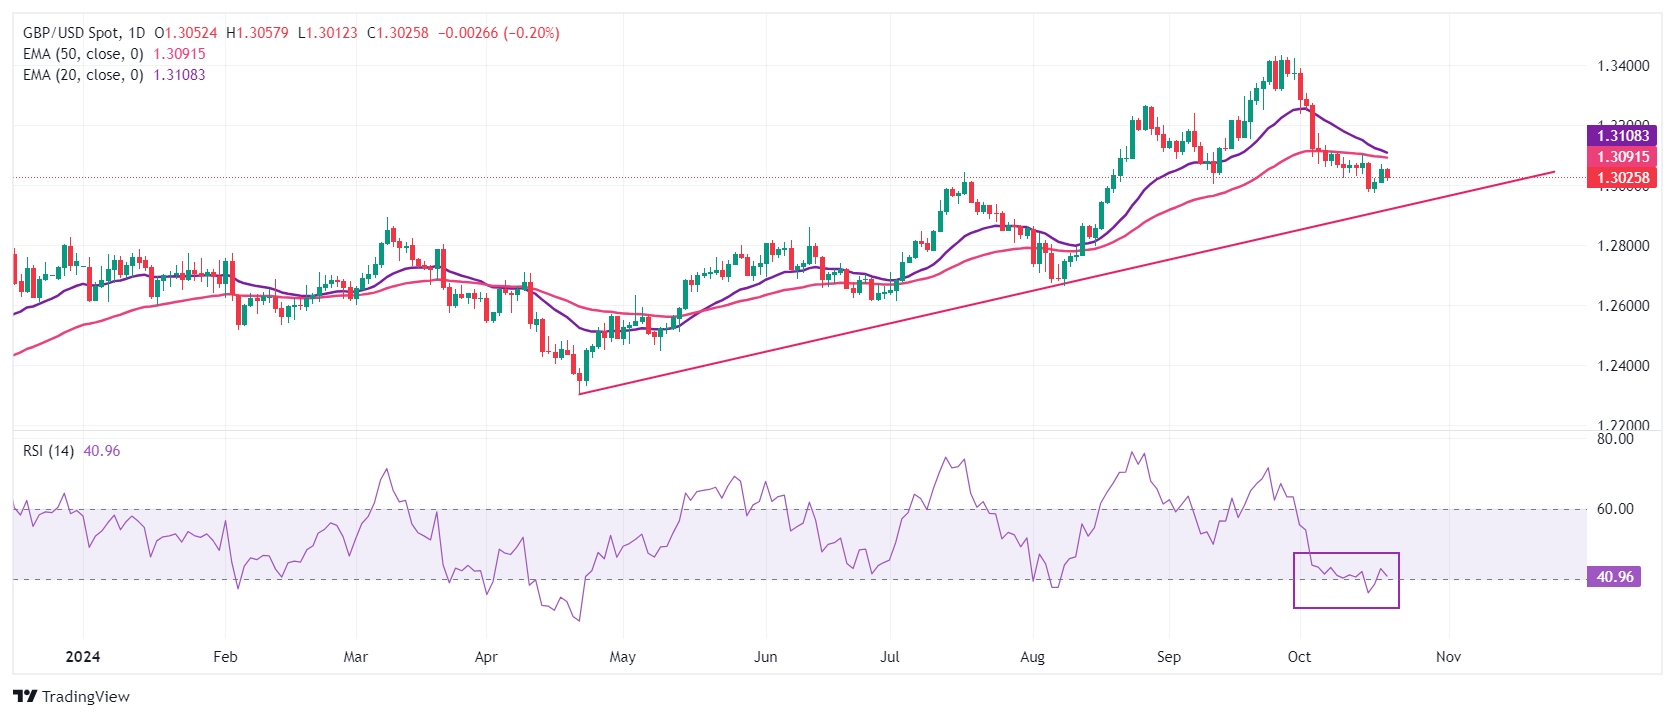
The Pound Sterling trades at make or a break near the psychological support of 1.3000 in European trading hours. The near-term outlook of the GBP/USD remains bearish as it hovers below the 50-day Exponential Moving Average (EMA), which trades around 1.3090.
The 14-day Relative Strength Index (RSI) hovers near 40.00. A breakdown will the same will strengthen the bearish momentum.
Looking down, the upward-sloping trendline drawn from the April 22 low at 1.2300 will be a major support zone for Pound Sterling bulls near 1.2920. On the upside, the Cable will face resistance near the 20-day EMA around 1.3110.
Pound Sterling FAQs
The Pound Sterling (GBP) is the oldest currency in the world (886 AD) and the official currency of the United Kingdom. It is the fourth most traded unit for foreign exchange (FX) in the world, accounting for 12% of all transactions, averaging $630 billion a day, according to 2022 data. Its key trading pairs are GBP/USD, also known as ‘Cable’, which accounts for 11% of FX, GBP/JPY, or the ‘Dragon’ as it is known by traders (3%), and EUR/GBP (2%). The Pound Sterling is issued by the Bank of England (BoE).
The single most important factor influencing the value of the Pound Sterling is monetary policy decided by the Bank of England. The BoE bases its decisions on whether it has achieved its primary goal of “price stability” – a steady inflation rate of around 2%. Its primary tool for achieving this is the adjustment of interest rates. When inflation is too high, the BoE will try to rein it in by raising interest rates, making it more expensive for people and businesses to access credit. This is generally positive for GBP, as higher interest rates make the UK a more attractive place for global investors to park their money. When inflation falls too low it is a sign economic growth is slowing. In this scenario, the BoE will consider lowering interest rates to cheapen credit so businesses will borrow more to invest in growth-generating projects.
Data releases gauge the health of the economy and can impact the value of the Pound Sterling. Indicators such as GDP, Manufacturing and Services PMIs, and employment can all influence the direction of the GBP. A strong economy is good for Sterling. Not only does it attract more foreign investment but it may encourage the BoE to put up interest rates, which will directly strengthen GBP. Otherwise, if economic data is weak, the Pound Sterling is likely to fall.
Another significant data release for the Pound Sterling is the Trade Balance. This indicator measures the difference between what a country earns from its exports and what it spends on imports over a given period. If a country produces highly sought-after exports, its currency will benefit purely from the extra demand created from foreign buyers seeking to purchase these goods. Therefore, a positive net Trade Balance strengthens a currency and vice versa for a negative balance.
The Australian Dollar (AUD) is likely to trade in a 0.6685/0.6730 range. In the longer run, downward momentum is slowing rapidly; a breach of 0.6740 would mean that the weakness in AUD has stabilized, UOB Group’s FX analysts Quek Ser Leang and Peter Chia note.
Likely to trade in a 0.6685/0.6730 range
24-HOUR VIEW: “We expected AUD to trade in a 0.6680/0.6725 range last Friday. It subsequently traded between 0.6694 and 0.6719, closing slightly higher at 0.6707 (+0.16%). Further range trading appears likely today, even though the slightly firmed underlying tone suggests a higher range of 0.6685/0.6730 range.”
1-3 WEEKS VIEW: “We turned negative in AUD early this month (as annotated in the chart below). After AUD dropped sharply to 0.6659, in our latest narrative from last Wednesday (16 Oct, spot at 0.6680), we indicated that ‘the rapid increase in momentum is likely to lead to further AUD weakness.’ However, AUD has not been able to make further headway on the downside since then. Downward momentum is slowing rapidly, and a breach of 0.6740 (no change in level in ‘strong resistance’ level) would mean that the AUD weakness has stabilised.”
The Australian Dollar (AUD) was a touch firmer this morning amid supported risk sentiments and on comments from RBA’s Hauser. AUD was last at 0.6689, OCBC’s FX analyst Frances Cheung and Christopher Wong note.
Risks skewed to the upside
“Some of the highlights of his recent fireside chat include: inflation is still ‘too high’; was surprised by overall employment growth; labour market outcome in good news story; firms finding it hard to fill vacancies.”
“He also said that RBA is not certain on level of neutral rate but most RBA models should between 3% and 4% neutral rate. He repeated again that RBA rate won’t fall as much or as early as other bans. Remarks were somewhat hawkish and reinforces RBA’s case for standing pat on policy rate for now.”
“Bearish momentum on daily chart shows signs of fading while RSI rose from overbought conditions. Risks skewed to the upside. Next resistance at 0.6780/90 levels (21 DMA), 0.6820 levels. Support at 0.6660.”
- Gold rises on increased safe-haven demand as the conflict in the Middle East deepens.
- Israel steps up bombing of Beirut and is poised to launch a retaliatory attack on Iran after a bomb explodes near Netanyahu’s house.
- XAU/USD continues trending higher as it pushes deeper into territory above $2,700.
Gold (XAU/USD) is already up half a percent to trade in the $2,730s on Monday during the European session after rising over 1.0% on Friday. The precious metal is gaining on a mixture of increased safe-haven demand due to the intensifying conflict in the Middle East and moves by the People’s Bank of China (PBoC) to further ease credit conditions by cutting interest rates.
The PBoC’s move to lower its one-year and five-year prime loan borrowing rates not only has the effect of increasing Gold’s attractiveness as a non-interest-paying asset, but also suggests the potential of more demand for Gold from Chinese investors and private buyers, who already make up the largest market for the commodity in the world.
Gold rises as Middle East tensions reach boiling point
Gold rallies as investor demand for safety increases due to the deepening conflict in the Middle East. Israel has stepped up its bombardment of Beirut by destroying several economic targets in an attempt to wipe out the bank that provides Hezbollah with its funding. The bank, which also serves a large Shiite population of muslims in Lebanon, is the main conduit for donations to Hezbollah, including $50 million a year from Iran, according to Bloomberg News. By destroying it, Israel not only hopes to remove the organization’s principal source of funding but also ferment discord amongst Hezbollah and the Shiite Lebanese community.
Further, Israel’s retaliatory attack on Iran is back on the table after an Iranian drone penetrated Israeli air-defense systems and exploded near the Israeli Prime Minister Benjamin Netanyahu’s private residence. Following the attack, Netanyahu convened several emergency meetings to discuss preparations for Israel’s delayed attack on Iran.
Technical Analysis: Gold approaches next target as trend extends
Gold is rising in a steady uptrend on all time frames (short, medium and long) and after breaching the $2,700 mark it is now on its way to the next target at $2,750.
XAU/USD Daily Chart
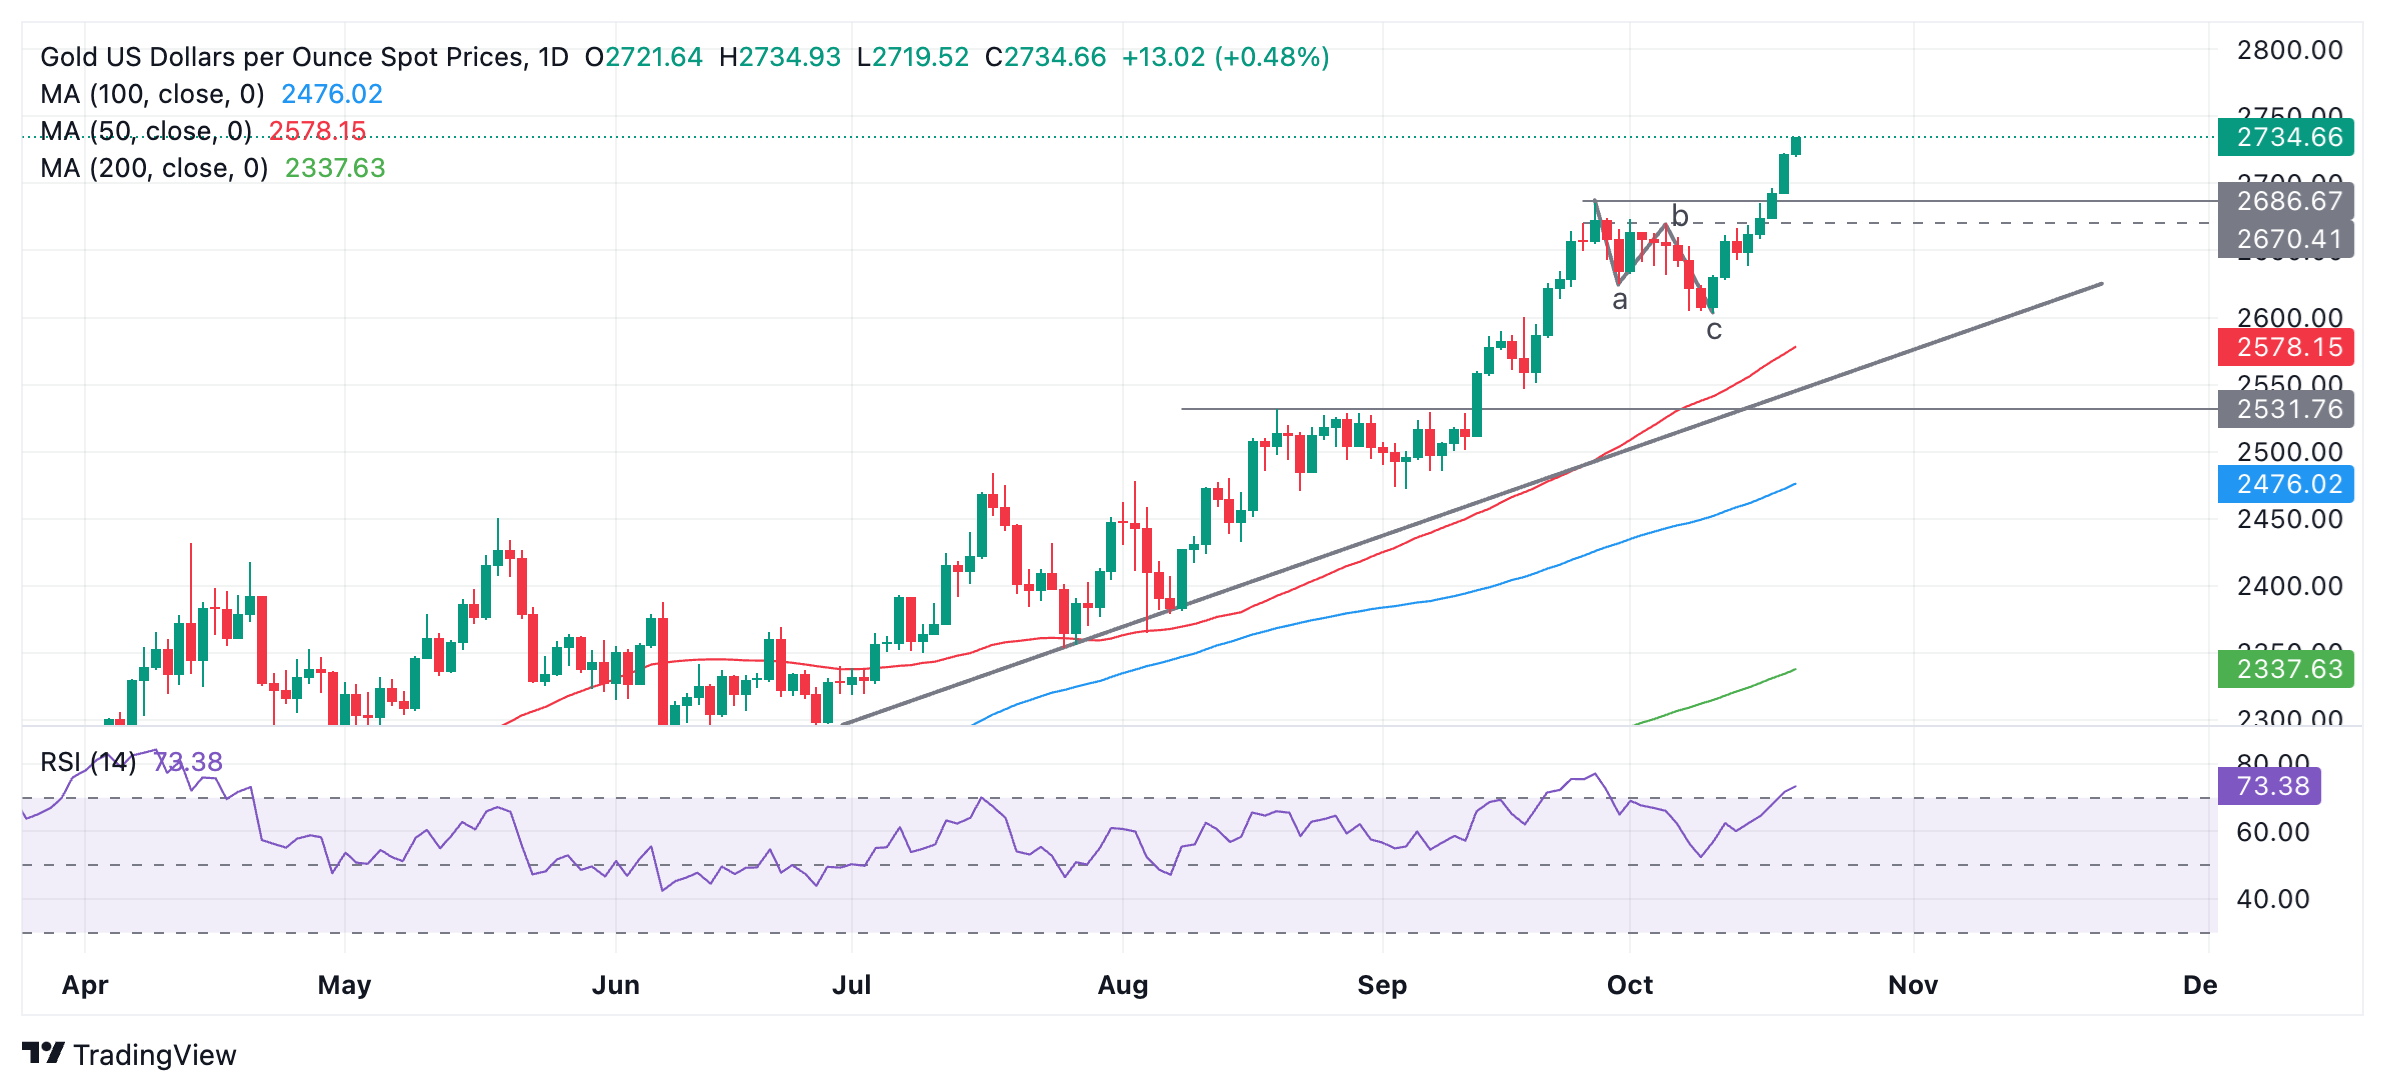
The Relative Strength Index (RSI) is overbought, however, advising long-holders not to add to their positions because of an increased risk of a pullback. Should RSI close back in neutral territory, it will be a sign for long-holders to close their positions and open shorts as a deeper correction may evolve. Support lies at $2,700 (key level) and $2,685 (September high).
Gold’s strong overall uptrend, however, suggests that any corrections are likely to be short-lived, and afterward the broader bull trend will probably resume.
Gold FAQs
Gold has played a key role in human’s history as it has been widely used as a store of value and medium of exchange. Currently, apart from its shine and usage for jewelry, the precious metal is widely seen as a safe-haven asset, meaning that it is considered a good investment during turbulent times. Gold is also widely seen as a hedge against inflation and against depreciating currencies as it doesn’t rely on any specific issuer or government.
Central banks are the biggest Gold holders. In their aim to support their currencies in turbulent times, central banks tend to diversify their reserves and buy Gold to improve the perceived strength of the economy and the currency. High Gold reserves can be a source of trust for a country’s solvency. Central banks added 1,136 tonnes of Gold worth around $70 billion to their reserves in 2022, according to data from the World Gold Council. This is the highest yearly purchase since records began. Central banks from emerging economies such as China, India and Turkey are quickly increasing their Gold reserves.
Gold has an inverse correlation with the US Dollar and US Treasuries, which are both major reserve and safe-haven assets. When the Dollar depreciates, Gold tends to rise, enabling investors and central banks to diversify their assets in turbulent times. Gold is also inversely correlated with risk assets. A rally in the stock market tends to weaken Gold price, while sell-offs in riskier markets tend to favor the precious metal.
The price can move due to a wide range of factors. Geopolitical instability or fears of a deep recession can quickly make Gold price escalate due to its safe-haven status. As a yield-less asset, Gold tends to rise with lower interest rates, while higher cost of money usually weighs down on the yellow metal. Still, most moves depend on how the US Dollar (USD) behaves as the asset is priced in dollars (XAU/USD). A strong Dollar tends to keep the price of Gold controlled, whereas a weaker Dollar is likely to push Gold prices up.
- The Mexican Peso is losing ground as Donald Trump edges past Kamala Harris in the polls.
- Trump has vowed to slap massive import tariffs on Mexican goods, especially cars, so if he wins, it will negatively impact MXN.
- USD/MXN starts rallying back up within its rising channel after a brief pullback.
The Mexican Peso (MXN) is weakening in its key pairs on Monday as the odds shift marginally in favor of former President Donald Trump winning the United States (US) presidential election in November. This comes after a period in which Trump trailed behind US Vice President and Democratic candidate Kamala Harris in the polls. Trump has said he will tear up the US’s free trade agreement with Mexico and slap up to 300% tariffs on Mexican cars arriving in the States. Such a move would hit the Mexican economy and reduce demand for its currency.
The latest national opinion poll by TIPP Insights on October 17-19 shows Donald Trump in the lead with 49% of the vote against Harris’s 47%, according to election website FiveThirtyEight. Betting website OddsChecker, meanwhile, has about equal chances – 33/50 or 60.02% for Trump to win and 4/6 or 60.00% for a Harris victory.
Trump supporter and CEO of Tesla Elon Musk’s pledge to offer voters in swing states the opportunity to be entered into a prize draw for a $1 million jackpot if they vote for Trump has also been seen as a major boost to the former president’s campaign, according to Bloomberg News.
Mexican Peso capped by defensive stance
The Mexican Peso might also be suffering as a result of the increasingly “defensive” stance of global investors towards emerging market (EM) assets, according to an article in El Financiero. This is partly because of increasing concerns the Federal Reserve (Fed) may have acted too hastily in lowering US interest rates by a double-the-usual 50 basis points (bps) (0.50%) at its meeting in September.
Buoyant US data suggests conditions may not have warranted such a large rate cut. Although a strong US economy is positive for Mexico because the US is such an important trading neighbor, elevated US interest rates also reduce the attractiveness of EM – chiefly Brazilian and Mexican – assets, according to The Wall Street Journal (WSJ). A retrenchment to a tighter stance would hurt demand for Mexican assets from global investors.
Disappointment at the level of Chinese stimulus measures might also be a factor in increasing investor defensiveness over EM holdings, which in turn could be weighing on the Mexican Peso. That said, the People’s Bank of China (PBoC) decided to cut its one- and five-year prime rates on Monday in a further measure to ease credit conditions.
Technical Analysis: USD/MXN starts rising again
USD/MXN restarts its rally within a rising channel after a brief pullback that ended up petering out pretty rapidly.
On Friday, the pair formed a bullish Hammer Japanese candlestick pattern, which neutralized the bearish Shooting Star candlestick formed the day before. This suggests there probably now will not be a pullback unfolding lower.
The pair is again on the rise at the start of the week and appears to be resuming its uptrend.
USD/MXN Daily Chart
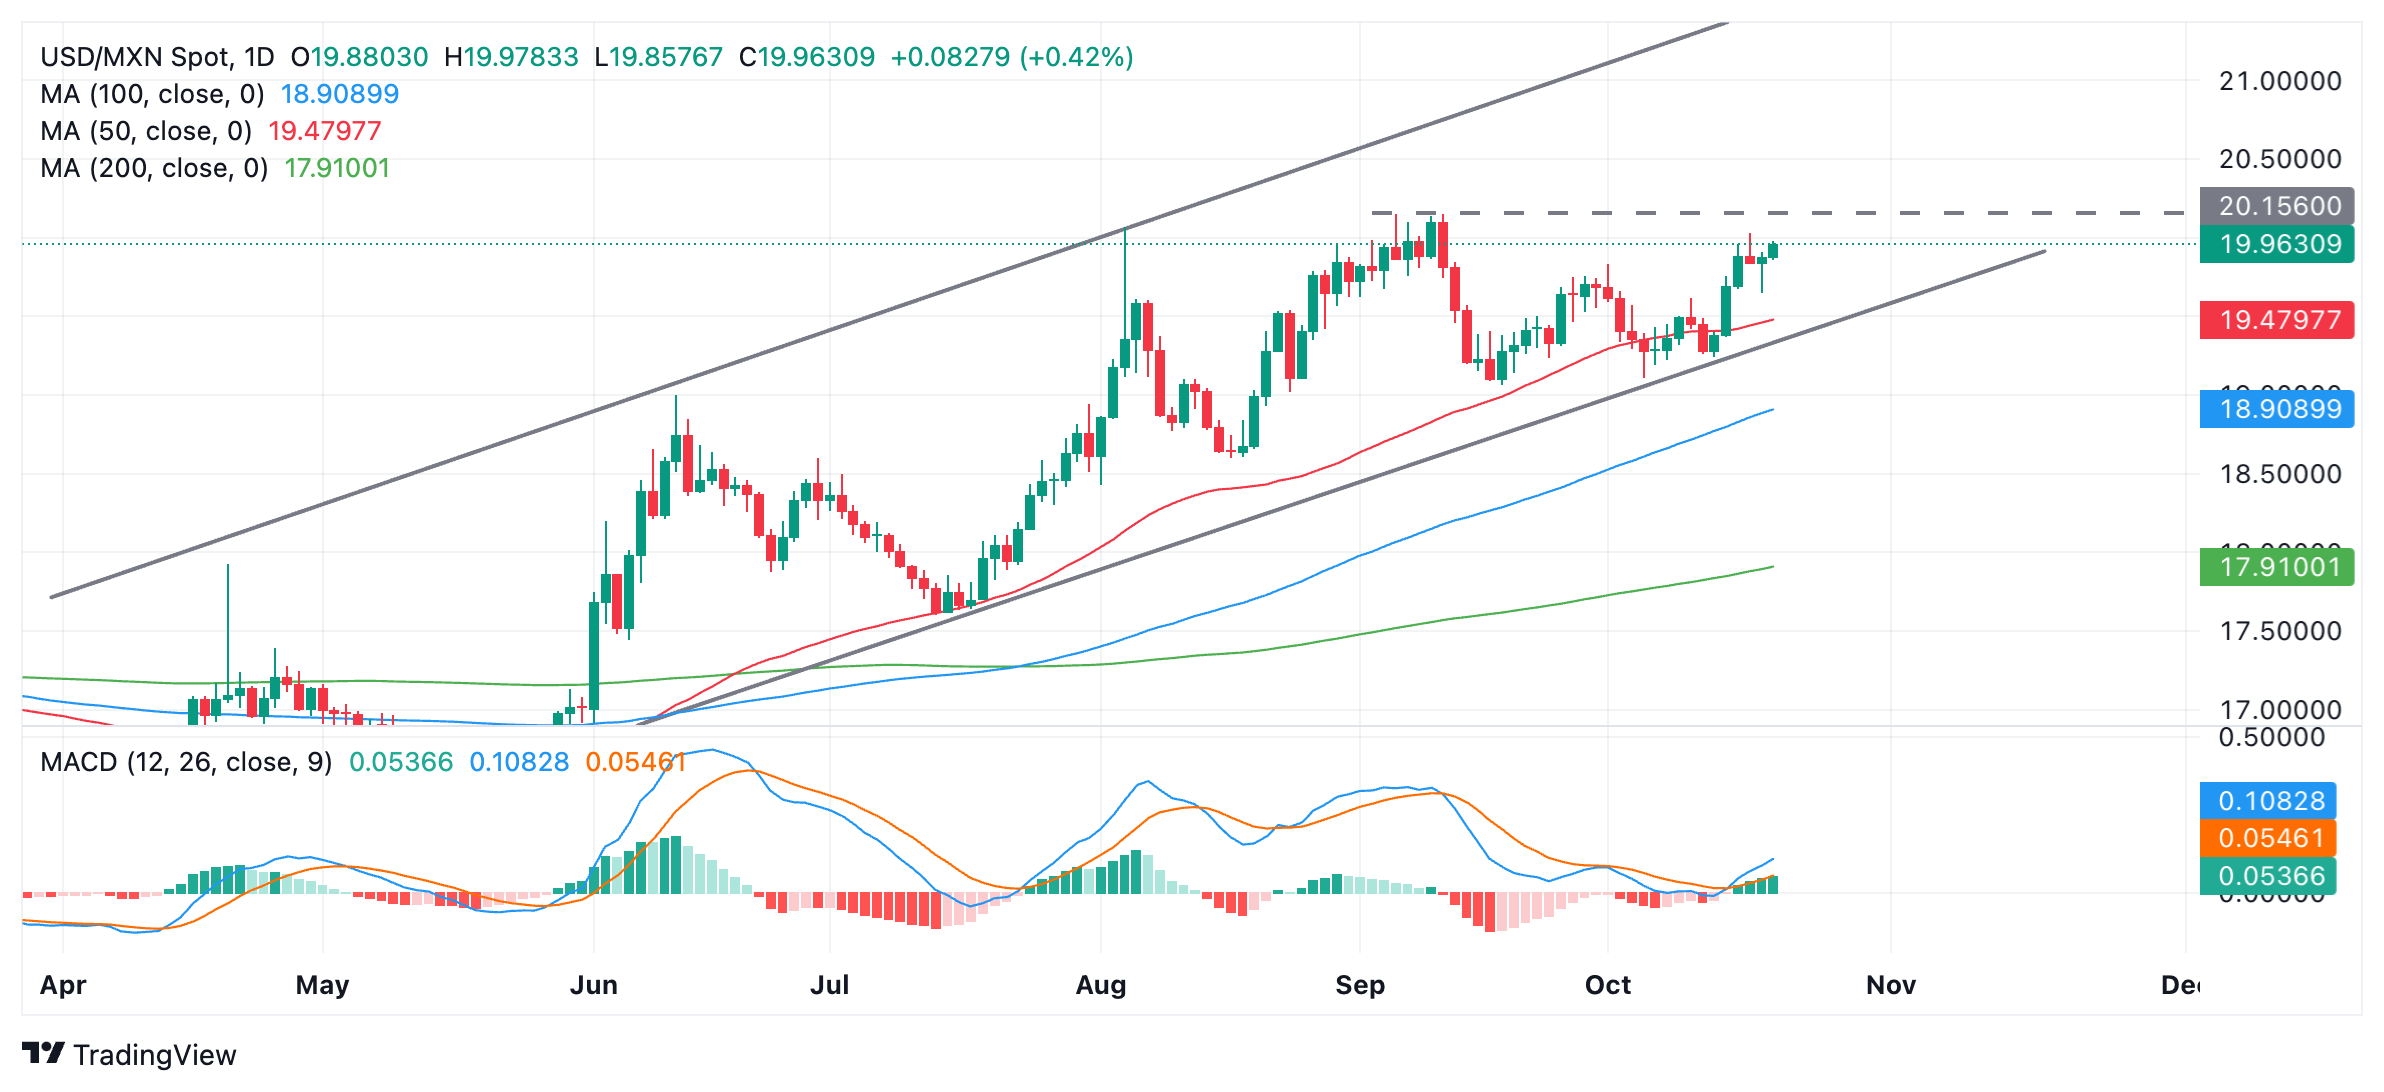
The break above 19.83 (October 1 high) confirmed a continuation up to the next target in the vicinity of the September 10 high at 20.13, which remains live.
The Moving Average Convergence Divergence (MACD) momentum indicator is rising quite strongly after bottoming out at the zero line, supporting a mildly bullish outlook overall.
Mexican Peso FAQs
The Mexican Peso (MXN) is the most traded currency among its Latin American peers. Its value is broadly determined by the performance of the Mexican economy, the country’s central bank’s policy, the amount of foreign investment in the country and even the levels of remittances sent by Mexicans who live abroad, particularly in the United States. Geopolitical trends can also move MXN: for example, the process of nearshoring – or the decision by some firms to relocate manufacturing capacity and supply chains closer to their home countries – is also seen as a catalyst for the Mexican currency as the country is considered a key manufacturing hub in the American continent. Another catalyst for MXN is Oil prices as Mexico is a key exporter of the commodity.
The main objective of Mexico’s central bank, also known as Banxico, is to maintain inflation at low and stable levels (at or close to its target of 3%, the midpoint in a tolerance band of between 2% and 4%). To this end, the bank sets an appropriate level of interest rates. When inflation is too high, Banxico will attempt to tame it by raising interest rates, making it more expensive for households and businesses to borrow money, thus cooling demand and the overall economy. Higher interest rates are generally positive for the Mexican Peso (MXN) as they lead to higher yields, making the country a more attractive place for investors. On the contrary, lower interest rates tend to weaken MXN.
Macroeconomic data releases are key to assess the state of the economy and can have an impact on the Mexican Peso (MXN) valuation. A strong Mexican economy, based on high economic growth, low unemployment and high confidence is good for MXN. Not only does it attract more foreign investment but it may encourage the Bank of Mexico (Banxico) to increase interest rates, particularly if this strength comes together with elevated inflation. However, if economic data is weak, MXN is likely to depreciate.
As an emerging-market currency, the Mexican Peso (MXN) tends to strive during risk-on periods, or when investors perceive that broader market risks are low and thus are eager to engage with investments that carry a higher risk. Conversely, MXN tends to weaken at times of market turbulence or economic uncertainty as investors tend to sell higher-risk assets and flee to the more-stable safe havens.
The Pound Sterling (GBP) is likely to trade sideways between 1.3010 and 1.3070. In the longer run, weakness from the start of the month has ended; GBP is likely to trade between 1.2980 and 1.3130 for the time being, UOB Group’s FX analysts Quek Ser Leang and Peter Chia note.
GBP bulls can try to break above 1.3070
24-HOUR VIEW: “Last Friday, we expected GBP to trade in a 1.2985/1.3050 range. However, it rose to 1.3070, closing higher by 0.29% at 1.3048. Despite the advance, there is no significant increase in momentum. Instead of continuing to rise, GBP is more likely to trade sideways between 1.3010 and 1.3070.”
1-3 WEEKS VIEW: “In our most recent narrative from last Thursday (17 Oct, spot at 1.2990), we indicated that ‘the breach of the major support at 1.3000 sets the stage for further losses.’ We added, ‘Only a breach of 1.3080 (‘strong resistance’ level) would indicate that the weakness from early this month has ended.’ GBP rebounded strongly on Friday, reaching a high of 1.3070. Although our ‘strong resistance’ level has not been breached yet, downward momentum has largely faded. In other words, the weakness in GBP has ended, and for the time being, it is likely to trade in a range between 1.2980 and 1.3130.”
The Dollar Index (DXY) drifted lower, tracking the decline in UST yields. DXY was last at 103.60 levels, OCBC’s FX analyst Frances Cheung and Christopher Wong note.
DXY pullback is not ruled out
“Softer housing data was the trigger. Elsewhere, Fed’s Bostic said that he is not in a hurry to lower rates to neutral levels of 3 – 3.5% (by his estimation). He reiterated the central bank’s benchmark rate is still “a ways” above the level at which it neither boosts nor slows the economy. He also said he expects inflation will fall to the Fed’s target by the end of next year.”
“Daily momentum remains bullish but RSI turned lower from overbought conditions. We reiterate that the recent run up looks stretched technically and pullback is not ruled out. Resistance at 103.80 levels (200 DMA, 50% fibo). Support at 103.30 (100 DMA), 101.75/90 levels (50 DMA, 23.6% fibo retracement of 2023 high to 2024 low), 102 (21 DMA).”
Silver prices (XAG/USD) rose on Monday, according to FXStreet data. Silver trades at $33.99 per troy ounce, up 0.81% from the $33.71 it cost on Friday.
Silver prices have increased by 42.82% since the beginning of the year.
| Unit measure | Silver Price Today in USD |
|---|---|
| Troy Ounce | 33.99 |
| 1 Gram | 1.09 |
The Gold/Silver ratio, which shows the number of ounces of Silver needed to equal the value of one ounce of Gold, stood at 80.47 on Monday, down from 80.73 on Friday.
Silver FAQs
Silver is a precious metal highly traded among investors. It has been historically used as a store of value and a medium of exchange. Although less popular than Gold, traders may turn to Silver to diversify their investment portfolio, for its intrinsic value or as a potential hedge during high-inflation periods. Investors can buy physical Silver, in coins or in bars, or trade it through vehicles such as Exchange Traded Funds, which track its price on international markets.
Silver prices can move due to a wide range of factors. Geopolitical instability or fears of a deep recession can make Silver price escalate due to its safe-haven status, although to a lesser extent than Gold's. As a yieldless asset, Silver tends to rise with lower interest rates. Its moves also depend on how the US Dollar (USD) behaves as the asset is priced in dollars (XAG/USD). A strong Dollar tends to keep the price of Silver at bay, whereas a weaker Dollar is likely to propel prices up. Other factors such as investment demand, mining supply – Silver is much more abundant than Gold – and recycling rates can also affect prices.
Silver is widely used in industry, particularly in sectors such as electronics or solar energy, as it has one of the highest electric conductivity of all metals – more than Copper and Gold. A surge in demand can increase prices, while a decline tends to lower them. Dynamics in the US, Chinese and Indian economies can also contribute to price swings: for the US and particularly China, their big industrial sectors use Silver in various processes; in India, consumers’ demand for the precious metal for jewellery also plays a key role in setting prices.
Silver prices tend to follow Gold's moves. When Gold prices rise, Silver typically follows suit, as their status as safe-haven assets is similar. The Gold/Silver ratio, which shows the number of ounces of Silver needed to equal the value of one ounce of Gold, may help to determine the relative valuation between both metals. Some investors may consider a high ratio as an indicator that Silver is undervalued, or Gold is overvalued. On the contrary, a low ratio might suggest that Gold is undervalued relative to Silver.
(An automation tool was used in creating this post.)
The Euro (EUR) could edge higher; it does not seem to have enough momentum to break above 1.0900. In the longer run, slowing momentum suggests 1.0770 is likely out of reach this time around, UOB Group’s FX analysts Quek Ser Leang and Peter Chia note.
To trade in range after breaking above of 1.0900
24-HOUR VIEW: “After EUR fell sharply last Thursday, we indicated on Friday that ‘conditions are severely oversold after the rapid drop, but today, EUR could test the 1.0800 level before a recovery can be expected.’ However, instead of testing 1.0800, EUR recovered from a low of 1.0823, closing higher by 0.32% at 1.0866. The recovery has gathered some momentum. Today, EUR is likely to edge higher, but it does not seem to have enough momentum to break above 1.0900 (there’s a minor resistance at 1.0885). Support is at 1.0850; a breach of 1.0835 would indicate that the current mild upward pressure has eased.”
1-3 WEEKS VIEW: “Last Thursday (17 Oct, spot t 1.0860), we highlighted that ‘the weakness in EUR that started early this month remains intact.’ We added, ‘To reach the significant support at 1.0770, EUR must keep moving lower, or the likelihood of it reaching this level will diminish quickly.’ EUR subsequently dropped to 1.0810. Last Friday, it rebounded and reached a high of 1.0869. Although our ‘strong resistance’ level at 1.0900 has not been breached yet, the slowing momentum suggests 1.0770 is likely out of reach this time around. Looking ahead, a breach of 1.0900 would indicate the start of a range trading phase.”
- Silver gains some follow-through traction on Monday and jumps to a fresh 12-year top.
- A slightly overbought RSI on the daily chart warrants some caution for bullish traders.
- Any meaningful corrective slide is more likely to get bought into and remain limited.
Silver (XAG/USD) advances to its highest level since October 2012 during the first half of the European session on Monday, with bulls now looking to extend the upward trajectory beyond the $34.00 round-figure mark.
Looking at the broader picture, Friday's sustained breakout above the $32.50 supply zone was seen as a fresh trigger for bullish traders. That said, the Relative Strength Index (RSI) on the daily chart has moved above the 70 mark and points to slightly overbought conditions. This, in turn, makes it prudent to wait for some near-term consolidation or a modest pullback before positioning for any further appreciating move.
Meanwhile, any meaningful corrective decline could be seen as a buying opportunity and remain limited near the $33.00 round figure. A convincing break below, however, might prompt some technical selling and drag the XAG/USD back towards the $32.50 resistance breakpoint, now turned support, en route to the $32.00 mark. The latter should act as a key pivotal point, which if broken might shift the bias in favor of bearish traders.
On the flip side, the immediate hurdle is pegged near the $33.45 horizontal zone, above which the XAG/USD could aim to reclaim the $35.00 psychological mark. The momentum could get extended further towards the October 2012 swing high, around the $35.35-$35.40 region, though the technical setup warrants some caution for bullish traders.
Silver daily chart
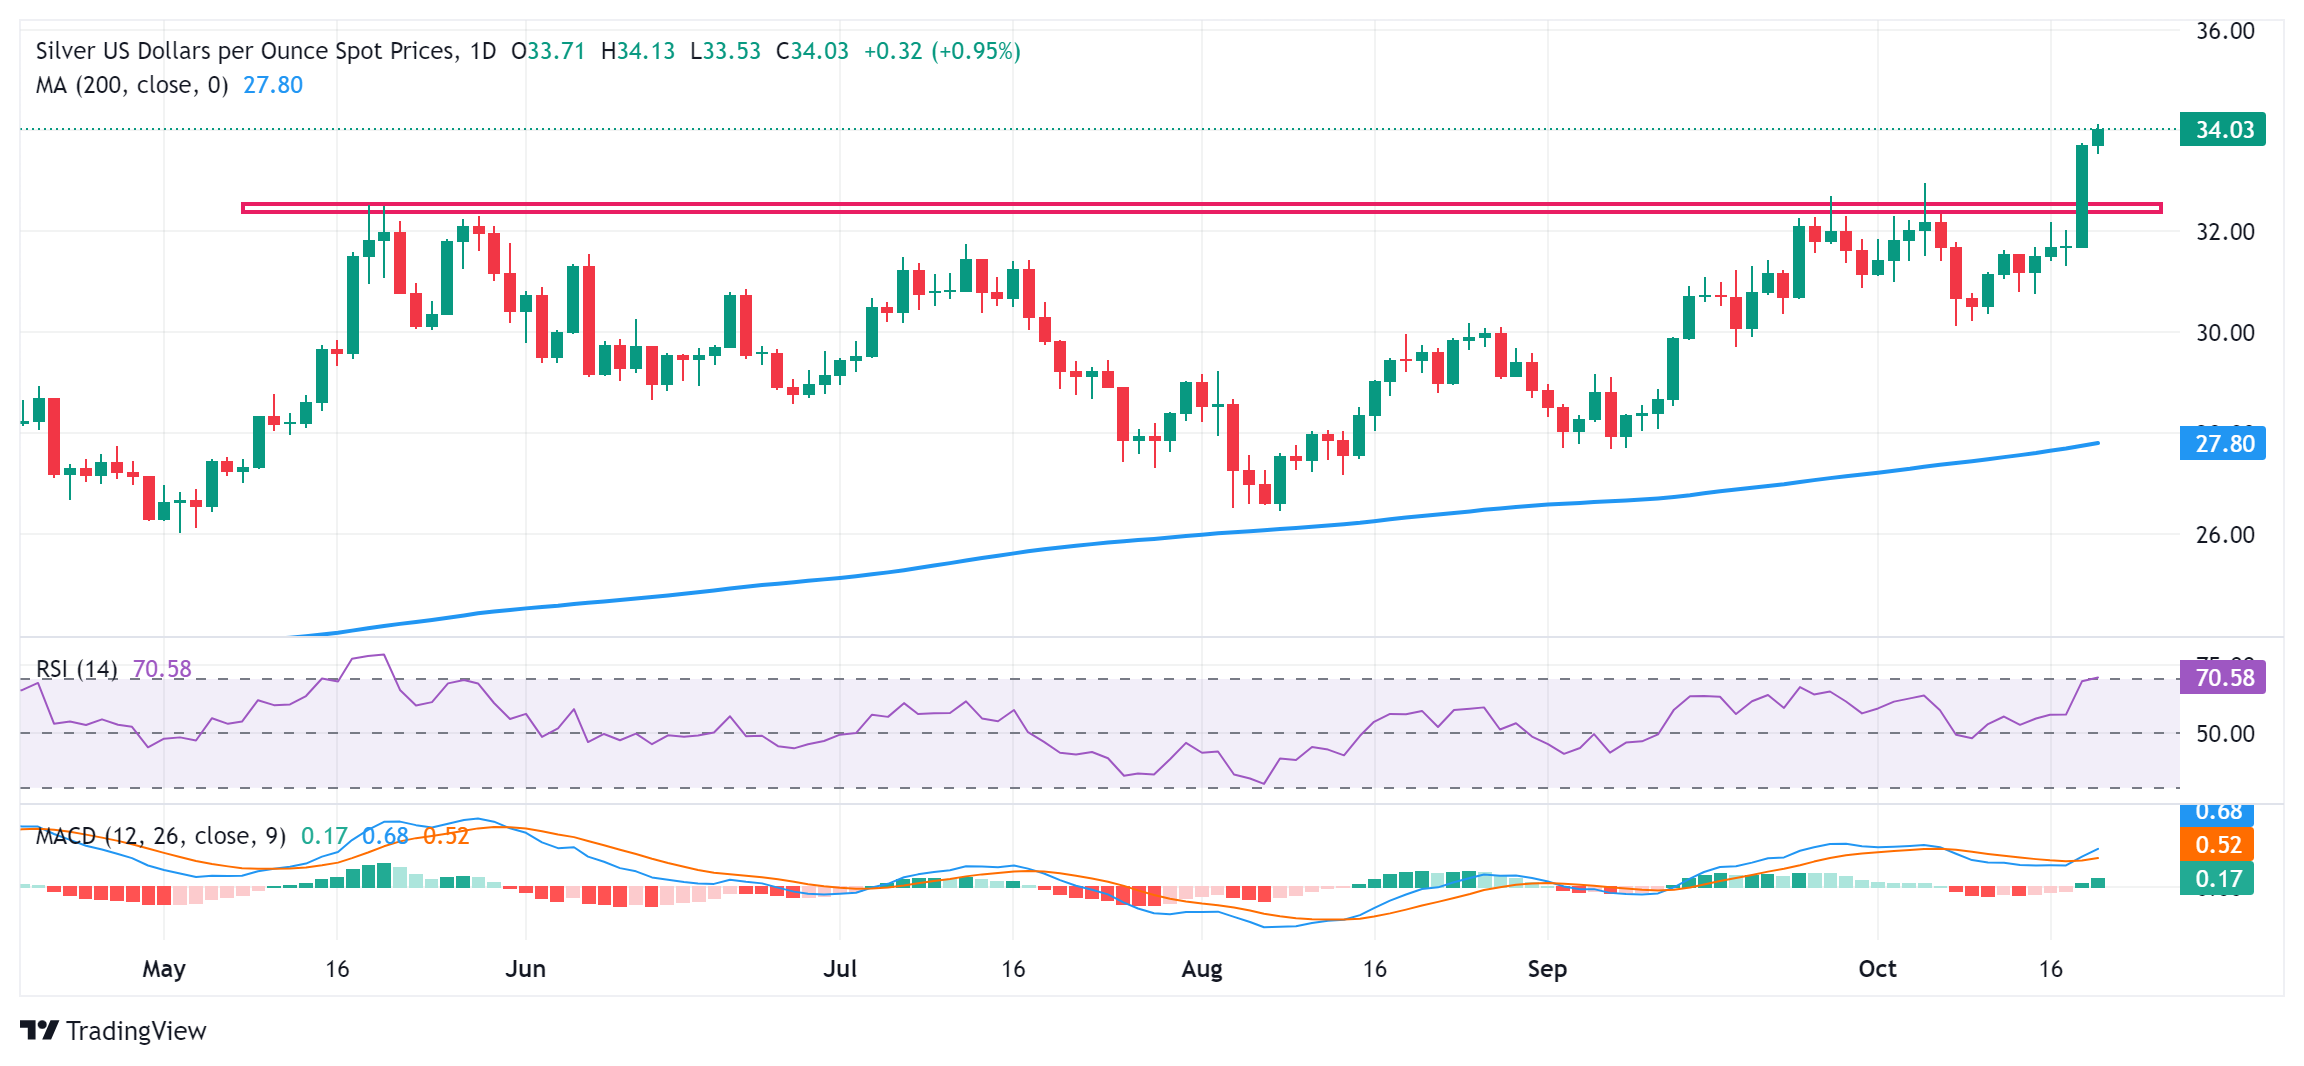
Silver FAQs
Silver is a precious metal highly traded among investors. It has been historically used as a store of value and a medium of exchange. Although less popular than Gold, traders may turn to Silver to diversify their investment portfolio, for its intrinsic value or as a potential hedge during high-inflation periods. Investors can buy physical Silver, in coins or in bars, or trade it through vehicles such as Exchange Traded Funds, which track its price on international markets.
Silver prices can move due to a wide range of factors. Geopolitical instability or fears of a deep recession can make Silver price escalate due to its safe-haven status, although to a lesser extent than Gold's. As a yieldless asset, Silver tends to rise with lower interest rates. Its moves also depend on how the US Dollar (USD) behaves as the asset is priced in dollars (XAG/USD). A strong Dollar tends to keep the price of Silver at bay, whereas a weaker Dollar is likely to propel prices up. Other factors such as investment demand, mining supply – Silver is much more abundant than Gold – and recycling rates can also affect prices.
Silver is widely used in industry, particularly in sectors such as electronics or solar energy, as it has one of the highest electric conductivity of all metals – more than Copper and Gold. A surge in demand can increase prices, while a decline tends to lower them. Dynamics in the US, Chinese and Indian economies can also contribute to price swings: for the US and particularly China, their big industrial sectors use Silver in various processes; in India, consumers’ demand for the precious metal for jewellery also plays a key role in setting prices.
Silver prices tend to follow Gold's moves. When Gold prices rise, Silver typically follows suit, as their status as safe-haven assets is similar. The Gold/Silver ratio, which shows the number of ounces of Silver needed to equal the value of one ounce of Gold, may help to determine the relative valuation between both metals. Some investors may consider a high ratio as an indicator that Silver is undervalued, or Gold is overvalued. On the contrary, a low ratio might suggest that Gold is undervalued relative to Silver.
- NZD/USD could test the immediate support around a two-month low at 0.6039 level.
- The daily-chart analysis suggests the short-term market bias is bearish for the pair.
- A break above the immediate resistance at the nine-day and 50-day EMAs could trigger a shift toward a bullish bias.
The NZD/USD loses ground after two days of gains, trading around 0.6060 during Monday’s European hours. The analysis of the daily chart shows that the pair remains below the nine-day Exponential Moving Average (EMA), which suggests the short-term market bias is bearish.
Additionally, the 14-day Relative Strength Index (RSI) consolidates below the 30 level, reinforcing the current bearish sentiment. Furthermore, the nine-day Exponential Moving Average (EMA) remains below the 50-day EMA, highlighting weakness in the short-term price trend for the pair.
On the downside, the NZD/USD pair tests immediate support around a two-month low at 0.6039 level, which was recorded on October 16, followed by the psychological level of 0.6000. A break below this level could exert downward pressure on the pair to re-test the area around the "pullback support" near the 0.5850 level.
In terms of resistance, the immediate resistance appears at the nine-day Exponential Moving Average (EMA) around the level of 0.6089, followed by the 50-day EMA at 0.6146 level. A break above the latter could cause the emergence of the short-term bullish bias, potentially allowing the NZD/USD pair to target the psychological level of 0.6200.
NZD/USD: Daily Chart
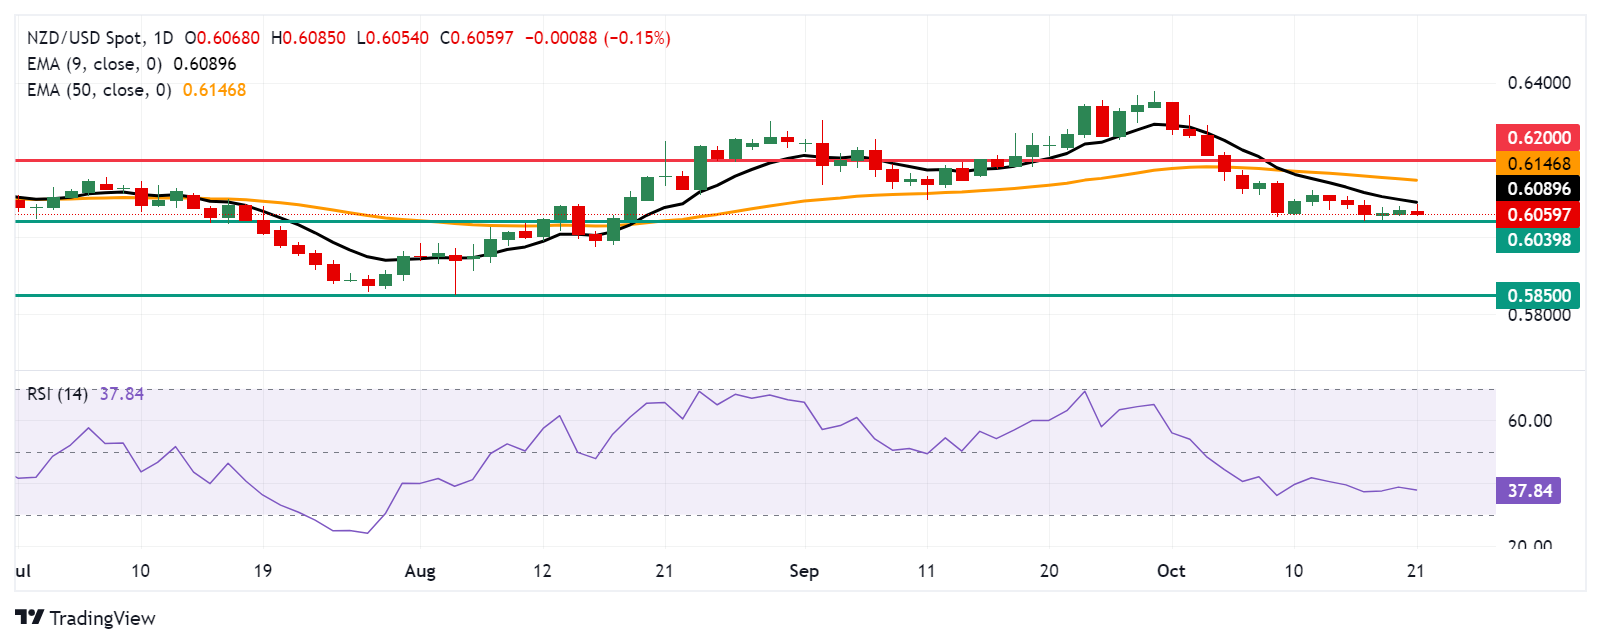
New Zealand Dollar PRICE Today
The table below shows the percentage change of New Zealand Dollar (NZD) against listed major currencies today. New Zealand Dollar was the weakest against the Canadian Dollar.
| USD | EUR | GBP | JPY | CAD | AUD | NZD | CHF | |
|---|---|---|---|---|---|---|---|---|
| USD | 0.11% | 0.20% | 0.27% | 0.00% | 0.23% | 0.13% | 0.07% | |
| EUR | -0.11% | 0.02% | 0.10% | -0.04% | 0.10% | -0.08% | -0.12% | |
| GBP | -0.20% | -0.02% | 0.06% | -0.19% | 0.04% | -0.07% | -0.18% | |
| JPY | -0.27% | -0.10% | -0.06% | -0.27% | -0.04% | -0.09% | -0.26% | |
| CAD | -0.01% | 0.04% | 0.19% | 0.27% | 0.13% | 0.18% | -0.07% | |
| AUD | -0.23% | -0.10% | -0.04% | 0.04% | -0.13% | -0.03% | -0.24% | |
| NZD | -0.13% | 0.08% | 0.07% | 0.09% | -0.18% | 0.03% | -0.12% | |
| CHF | -0.07% | 0.12% | 0.18% | 0.26% | 0.07% | 0.24% | 0.12% |
The heat map shows percentage changes of major currencies against each other. The base currency is picked from the left column, while the quote currency is picked from the top row. For example, if you pick the New Zealand Dollar from the left column and move along the horizontal line to the US Dollar, the percentage change displayed in the box will represent NZD (base)/USD (quote).
- AUD/JPY remains tepid due to a potential for forex intervention by the Japanese authorities.
- The Japanese Yen faced challenges due to uncertainty surrounding the BoJ policy outlook.
- The Australian Dollar may appreciate as a solid labor report has reduced the odds of RBA’s rate cuts this year.
The AUD/JPY pair continues to edge lower for the second consecutive session, trading near 100.20 during European trading hours on Monday. The Japanese Yen (JPY) may have gained some support from the possibility of currency intervention by Japanese authorities.
However, uncertainty surrounding the timing and pace of future rate hikes by the Bank of Japan (BoJ) remains a key factor weighing on the Yen, which could help limit the downside of the AUD/JPY cross.
On Friday, Japan’s Vice Finance Minister for International Affairs, Atsushi Mimura, remarked that recent Yen movements have been "somewhat rapid and one-sided," emphasizing that excessive volatility in the forex market is undesirable.
The downside risk for the AUD/JPY cross appears limited, as the Australian Dollar (AUD) may be buoyed by the hawkish sentiment surrounding the Reserve Bank of Australia (RBA). Last week's strong employment data from Australia has diminished the chances of the RBA cutting interest rates this year.
Additionally, the Aussie Dollar has been supported by China’s recent rate cuts, as China is Australia's largest trading partner. On Monday, the People's Bank of China (PBoC) lowered the 1-year Loan Prime Rate (LPR) from 3.35% to 3.10% and the 5-year LPR from 3.85% to 3.60%, as expected. These reductions in borrowing costs are likely to boost China's domestic economic activity, which could, in turn, drive demand for Australian exports.
RBA Deputy Governor Andrew Hauser addressed the CBA 2024 Global Markets Conference in Sydney on Monday, expressing slight surprise at the strength of employment growth. Hauser noted that the labor participation rate is remarkably high and emphasized that while the RBA is data-dependent, it is not data-obsessed.
Interest rates FAQs
Interest rates are charged by financial institutions on loans to borrowers and are paid as interest to savers and depositors. They are influenced by base lending rates, which are set by central banks in response to changes in the economy. Central banks normally have a mandate to ensure price stability, which in most cases means targeting a core inflation rate of around 2%. If inflation falls below target the central bank may cut base lending rates, with a view to stimulating lending and boosting the economy. If inflation rises substantially above 2% it normally results in the central bank raising base lending rates in an attempt to lower inflation.
Higher interest rates generally help strengthen a country’s currency as they make it a more attractive place for global investors to park their money.
Higher interest rates overall weigh on the price of Gold because they increase the opportunity cost of holding Gold instead of investing in an interest-bearing asset or placing cash in the bank. If interest rates are high that usually pushes up the price of the US Dollar (USD), and since Gold is priced in Dollars, this has the effect of lowering the price of Gold.
The Fed funds rate is the overnight rate at which US banks lend to each other. It is the oft-quoted headline rate set by the Federal Reserve at its FOMC meetings. It is set as a range, for example 4.75%-5.00%, though the upper limit (in that case 5.00%) is the quoted figure. Market expectations for future Fed funds rate are tracked by the CME FedWatch tool, which shapes how many financial markets behave in anticipation of future Federal Reserve monetary policy decisions.
- EUR/USD holds 1.0800, though its outlook remains uncertain on ECB dovish bets.
- The Eurozone's economic growth is expected to remain modest.
- The US Dollar will be influenced by market expectations for US presidential elections.
EUR/USD struggles to extend Friday’s recovery above the immediate resistance of 1.0870 and retraces back to 1.0850 in Monday’s European session. The major currency pair could retreat to its 11-week low near 1.0800 set on Thursday as investors expect the European Central Bank (ECB) to continue easing interest rates further.
With faltering Eurozone economic growth and the inflationary pressures below the bank’s target of 2%, investors expect the ECB to cut its borrowing rates again in December.
ECB policymaker and Estonian central bank Governor Madis Müller argued on Friday that the expectations of modest economic growth would probably tame price pressures further. The confidence of market participants for inflation remaining contained strengthened after the ECB’s own Survey of Professional Forecasters downwardly revised price growth to 1.9% for next year from 2% anticipated a quarter ago.
For more clarity on the interest rate outlook, investors will pay close attention to the two-day ECB President Christine Lagarde’s speech, starting on Tuesday. In her press conference after the central bank’s 25 basis points (bps) rate cut decision on Thursday, Lagarde didn’t offer a specific interest rate path and said decisions would be based on the incoming data.
Daily digest market movers: EUR/USD could resume its downside journey on US Dollar’s upbeat outlook
- EUR/USD will likely resume its downside journey as the US Dollar (USD) is expected to extend its upside after a minor technical correction on Friday. The US Dollar Index (DXY), which tracks the Greenback’s value against six major currencies, posted a fresh 11-week high last week near 104.00 on multiple tailwinds.
- The outlook of the Greenback remains firm as traders are confident that the Federal Reserve (Fed) will pursue a gradual interest rate cut path. According to the CME FedWatch tool, 30-day Federal Funds futures pricing data shows that the market expects 50 basis points (bps) decline in interest rates in the remaining year, suggesting that the Fed will cut its borrowing rates by 25 bps in November and December.
- Market expectations for the Fed opting for a less aggressive policy-easing cycle strengthened after a slew of United States (US) economic data for September pointed to economic resilience. For more cues on the economic outlook, investors will keep an eye on the preliminary S&P Global Purchasing Managers’ Index (PMI) data for October, which will be published on Thursday.
- Meanwhile, the fate of the US Dollar could be highly volatile as US presidential elections are around the corner. The latest national polls have shown Democratic candidate and US Vice President Kamala Harrish has the upper hand over Republican nominee and former US President Donald Trump.
Technical Analysis: EUR/USD strives to hold 1.0800
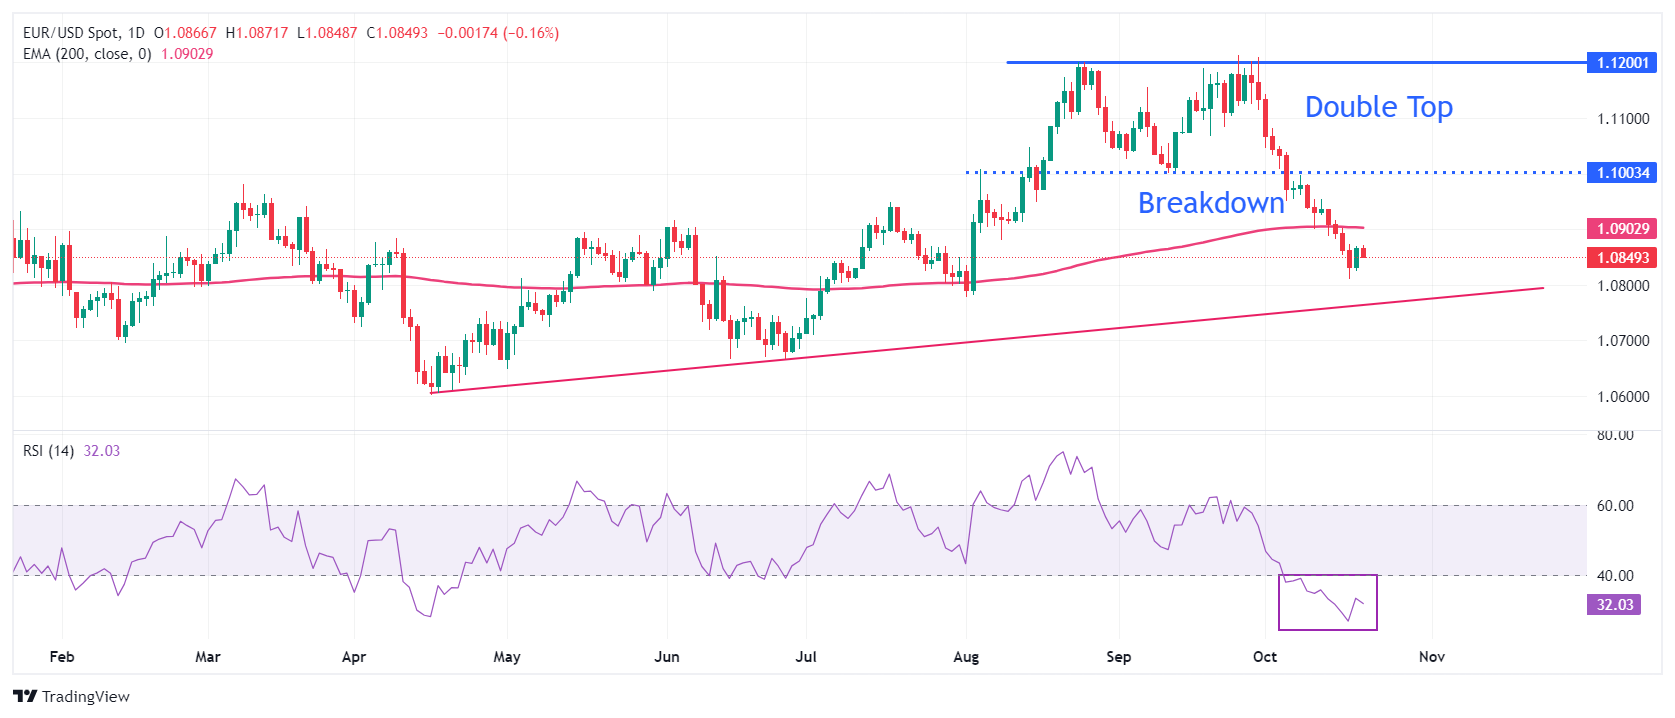
EUR/USD holds the immediate support of 1.0800 in European trading hours. However, the outlook of the major currency pair remains uncertain as it trades below the 200-day Exponential Moving Average (EMA), which trades around 1.0900.
The downside move in the shared currency pair started after a breakdown of a Double Top formation on a daily timeframe below the September 11 low at around 1.1000, which resulted in a bearish reversal.
The 14-day Relative Strength Index (RSI) dives below 30.00, indicating a strong bearish momentum. However, a recovery move remains on the cards as conditions turn oversold.
On the downside, the major could find support near the upward-sloping trendline at 1.0750, which is plotted from the October 3 low around 1.0450. Meanwhile, the 200-day EMA and the psychological figure of 1.1000 will be the key resistance for the pair.
Euro FAQs
The Euro is the currency for the 19 European Union countries that belong to the Eurozone. It is the second most heavily traded currency in the world behind the US Dollar. In 2022, it accounted for 31% of all foreign exchange transactions, with an average daily turnover of over $2.2 trillion a day. EUR/USD is the most heavily traded currency pair in the world, accounting for an estimated 30% off all transactions, followed by EUR/JPY (4%), EUR/GBP (3%) and EUR/AUD (2%).
The European Central Bank (ECB) in Frankfurt, Germany, is the reserve bank for the Eurozone. The ECB sets interest rates and manages monetary policy. The ECB’s primary mandate is to maintain price stability, which means either controlling inflation or stimulating growth. Its primary tool is the raising or lowering of interest rates. Relatively high interest rates – or the expectation of higher rates – will usually benefit the Euro and vice versa. The ECB Governing Council makes monetary policy decisions at meetings held eight times a year. Decisions are made by heads of the Eurozone national banks and six permanent members, including the President of the ECB, Christine Lagarde.
Eurozone inflation data, measured by the Harmonized Index of Consumer Prices (HICP), is an important econometric for the Euro. If inflation rises more than expected, especially if above the ECB’s 2% target, it obliges the ECB to raise interest rates to bring it back under control. Relatively high interest rates compared to its counterparts will usually benefit the Euro, as it makes the region more attractive as a place for global investors to park their money.
Data releases gauge the health of the economy and can impact on the Euro. Indicators such as GDP, Manufacturing and Services PMIs, employment, and consumer sentiment surveys can all influence the direction of the single currency. A strong economy is good for the Euro. Not only does it attract more foreign investment but it may encourage the ECB to put up interest rates, which will directly strengthen the Euro. Otherwise, if economic data is weak, the Euro is likely to fall. Economic data for the four largest economies in the euro area (Germany, France, Italy and Spain) are especially significant, as they account for 75% of the Eurozone’s economy.
Another significant data release for the Euro is the Trade Balance. This indicator measures the difference between what a country earns from its exports and what it spends on imports over a given period. If a country produces highly sought after exports then its currency will gain in value purely from the extra demand created from foreign buyers seeking to purchase these goods. Therefore, a positive net Trade Balance strengthens a currency and vice versa for a negative balance.
- EUR/GBP could face challenges due to dovish sentiment surrounding the ECB.
- Germany's PPI fell by 1.4% YoY in September, extending the decline from a previous 0.8% drop.
- Lower inflation prices raise the odds of the BoE implementing a total rate cut of 50 basis points by 2024.
EUR/GBP holds its position after the release of Germany's Producer Price Index (PPI), trading around 0.8330 during the early European hours on Monday. Producer prices fell by 1.4% year-on-year in September, extending the decline from a 0.8% drop in the previous two months. On a monthly basis, PPI decreased by 0.5%, marking the first decline since February. This drop exceeded expectations of a 0.2% fall and swinging from a 0.2% increase in August.
The Euro faced challenges as the European Central Bank (ECB) decided to cut its interest rates by 25 basis points last week. This could be attributed to a significant drop in inflation, which fell to 1.7% in September, now below the ECB's 2% target.
Additionally, Rabobank's research suggests that the market is interpreting recent comments from European Central Bank (ECB) officials as an indication that they are increasingly comfortable with the Eurozone's inflation outlook. This has fueled speculation about a possible faster pace of ECB easing, including the potential for a larger 50-basis-point interest rate cut.
Declines in both the Consumer Price Index (CPI) and Producer Price Index (PPI) inflation figures, along with weak labor market data in the United Kingdom (UK), are raising expectations that the Bank of England (BoE) may implement a 25 basis point (bps) interest rate cut in November, followed by another quarter-point cut in December. This could weigh on the Pound Sterling (GBP) and support the EUR/GBP cross.
Inflation FAQs
Inflation measures the rise in the price of a representative basket of goods and services. Headline inflation is usually expressed as a percentage change on a month-on-month (MoM) and year-on-year (YoY) basis. Core inflation excludes more volatile elements such as food and fuel which can fluctuate because of geopolitical and seasonal factors. Core inflation is the figure economists focus on and is the level targeted by central banks, which are mandated to keep inflation at a manageable level, usually around 2%.
The Consumer Price Index (CPI) measures the change in prices of a basket of goods and services over a period of time. It is usually expressed as a percentage change on a month-on-month (MoM) and year-on-year (YoY) basis. Core CPI is the figure targeted by central banks as it excludes volatile food and fuel inputs. When Core CPI rises above 2% it usually results in higher interest rates and vice versa when it falls below 2%. Since higher interest rates are positive for a currency, higher inflation usually results in a stronger currency. The opposite is true when inflation falls.
Although it may seem counter-intuitive, high inflation in a country pushes up the value of its currency and vice versa for lower inflation. This is because the central bank will normally raise interest rates to combat the higher inflation, which attract more global capital inflows from investors looking for a lucrative place to park their money.
Formerly, Gold was the asset investors turned to in times of high inflation because it preserved its value, and whilst investors will often still buy Gold for its safe-haven properties in times of extreme market turmoil, this is not the case most of the time. This is because when inflation is high, central banks will put up interest rates to combat it. Higher interest rates are negative for Gold because they increase the opportunity-cost of holding Gold vis-a-vis an interest-bearing asset or placing the money in a cash deposit account. On the flipside, lower inflation tends to be positive for Gold as it brings interest rates down, making the bright metal a more viable investment alternative.
European Central Bank (ECB) Governing Council member Gediminas Šimkus said on Monday, “if disinflation gets entrenched, rates could get lower than the natural level.”
Additional quotes
The disinflation trend is on a stable track.
Services inflation remains high.
Risks to economic growth are skewed to the downside.
The policy will clearly become less restrictive.
I can't predict the outcome of December's meeting.
We'll have much more hard data by December.
Market reaction
These comments fail to move the needle around the Euro, keeping EUR/USD 0.10% lower on the day at 1.10854, as of writing.
Euro PRICE Today
The table below shows the percentage change of Euro (EUR) against listed major currencies today. Euro was the weakest against the New Zealand Dollar.
| USD | EUR | GBP | JPY | CAD | AUD | NZD | CHF | |
|---|---|---|---|---|---|---|---|---|
| USD | 0.11% | 0.17% | 0.15% | 0.02% | 0.22% | 0.08% | 0.12% | |
| EUR | -0.11% | -0.01% | -0.05% | -0.03% | 0.08% | -0.14% | -0.07% | |
| GBP | -0.17% | 0.01% | -0.04% | -0.14% | 0.06% | -0.09% | -0.09% | |
| JPY | -0.15% | 0.05% | 0.04% | -0.13% | 0.08% | -0.01% | -0.08% | |
| CAD | -0.02% | 0.03% | 0.14% | 0.13% | 0.10% | 0.12% | -0.02% | |
| AUD | -0.22% | -0.08% | -0.06% | -0.08% | -0.10% | -0.07% | -0.17% | |
| NZD | -0.08% | 0.14% | 0.09% | 0.01% | -0.12% | 0.07% | -0.01% | |
| CHF | -0.12% | 0.07% | 0.09% | 0.08% | 0.02% | 0.17% | 0.00% |
The heat map shows percentage changes of major currencies against each other. The base currency is picked from the left column, while the quote currency is picked from the top row. For example, if you pick the Euro from the left column and move along the horizontal line to the US Dollar, the percentage change displayed in the box will represent EUR (base)/USD (quote).
- USD/CHF trades in positive territory around 0.8655 in Monday’s early European session.
- The bets of a less aggressive Fed rate cuts support the USD.
- The Middle East geopolitical tensions could boost the Swiss Franc.
The USD/CHF pair trades on a firmer note near 0.8655 on Monday during the early European trading hours. The prospect that the US Federal Reserve (Fed) will proceed with modest rate cuts over the next year underpins the Greenback against the Swiss Franc (CHF). However, the ongoing geopolitical tensions in the Middle East might cap the pair’s upside.
A shift in Fed policy expectations to a more moderate easing phase after a slew of stronger-than-expected US economic data provides some support to the US Dollar (USD) broadly. Meanwhile, the US Dollar Index (DXY), measuring the USD’s value against six major currencies, currently trades near the three-month high of 103.60.
US rate futures have priced in a 95% odds that the Fed will cut rates by 25 basis points (bps) in November, and a 5% chance that the US central bank will hold its rate, according to LSEG estimates. "Speculation that the Fed could follow September's 50 bps rate cut with another similarly sized move has been blown away by a round of data pointing to a resilient U.S. economy," noted Jane Foley, head of FX strategy, at Rabobank in London.
On the Swiss front, the uncertainty surrounding the US election and geopolitical risks might prompt higher demand for safe-haven currencies like the CHF. The local news agency Aljazeera reported early Monday that the Israeli army launched a series of new air strikes across Lebanon, including Beirut’s suburbs, after it announced the targeting of Hezbollah’s al-Qard al-Hassan financial institution’s offices.
Swiss Franc FAQs
The Swiss Franc (CHF) is Switzerland’s official currency. It is among the top ten most traded currencies globally, reaching volumes that well exceed the size of the Swiss economy. Its value is determined by the broad market sentiment, the country’s economic health or action taken by the Swiss National Bank (SNB), among other factors. Between 2011 and 2015, the Swiss Franc was pegged to the Euro (EUR). The peg was abruptly removed, resulting in a more than 20% increase in the Franc’s value, causing a turmoil in markets. Even though the peg isn’t in force anymore, CHF fortunes tend to be highly correlated with the Euro ones due to the high dependency of the Swiss economy on the neighboring Eurozone.
The Swiss Franc (CHF) is considered a safe-haven asset, or a currency that investors tend to buy in times of market stress. This is due to the perceived status of Switzerland in the world: a stable economy, a strong export sector, big central bank reserves or a longstanding political stance towards neutrality in global conflicts make the country’s currency a good choice for investors fleeing from risks. Turbulent times are likely to strengthen CHF value against other currencies that are seen as more risky to invest in.
The Swiss National Bank (SNB) meets four times a year – once every quarter, less than other major central banks – to decide on monetary policy. The bank aims for an annual inflation rate of less than 2%. When inflation is above target or forecasted to be above target in the foreseeable future, the bank will attempt to tame price growth by raising its policy rate. Higher interest rates are generally positive for the Swiss Franc (CHF) as they lead to higher yields, making the country a more attractive place for investors. On the contrary, lower interest rates tend to weaken CHF.
Macroeconomic data releases in Switzerland are key to assessing the state of the economy and can impact the Swiss Franc’s (CHF) valuation. The Swiss economy is broadly stable, but any sudden change in economic growth, inflation, current account or the central bank’s currency reserves have the potential to trigger moves in CHF. Generally, high economic growth, low unemployment and high confidence are good for CHF. Conversely, if economic data points to weakening momentum, CHF is likely to depreciate.
As a small and open economy, Switzerland is heavily dependent on the health of the neighboring Eurozone economies. The broader European Union is Switzerland’s main economic partner and a key political ally, so macroeconomic and monetary policy stability in the Eurozone is essential for Switzerland and, thus, for the Swiss Franc (CHF). With such dependency, some models suggest that the correlation between the fortunes of the Euro (EUR) and the CHF is more than 90%, or close to perfect.
Here is what you need to know on Monday, October 21:
After rising nearly 2.5% in the previous week, Gold (XAU/USD) stretched higher during the Asian trading hours on Monday and touched a new record-high above $2,730 before retreating slightly. The economic calendar will not offer any high-impact macroeconomic data releases on Monday. In the American session, several Federal Reserve (Fed) policymakers will be delivering speeches.
US Dollar PRICE Last 7 days
The table below shows the percentage change of US Dollar (USD) against listed major currencies last 7 days. US Dollar was the strongest against the Swiss Franc.
| USD | EUR | GBP | JPY | CAD | AUD | NZD | CHF | |
|---|---|---|---|---|---|---|---|---|
| USD | 0.79% | 0.29% | 0.34% | 0.36% | 0.96% | 0.85% | 1.01% | |
| EUR | -0.79% | -0.56% | -0.54% | -0.34% | 0.20% | -0.03% | 0.13% | |
| GBP | -0.29% | 0.56% | 0.02% | 0.09% | 0.79% | 0.55% | 0.67% | |
| JPY | -0.34% | 0.54% | -0.02% | 0.00% | 0.63% | 0.55% | 0.65% | |
| CAD | -0.36% | 0.34% | -0.09% | -0.01% | 0.54% | 0.51% | 0.48% | |
| AUD | -0.96% | -0.20% | -0.79% | -0.63% | -0.54% | -0.10% | 0.02% | |
| NZD | -0.85% | 0.03% | -0.55% | -0.55% | -0.51% | 0.10% | 0.10% | |
| CHF | -1.01% | -0.13% | -0.67% | -0.65% | -0.48% | -0.02% | -0.10% |
The heat map shows percentage changes of major currencies against each other. The base currency is picked from the left column, while the quote currency is picked from the top row. For example, if you pick the US Dollar from the left column and move along the horizontal line to the Japanese Yen, the percentage change displayed in the box will represent USD (base)/JPY (quote).
Growing prospects for a globally low interest rate environment and heightened geopolitical tensions fuelled Gold's rally in the previous week. Additionally, easing concerns over an economic downturn in China helped XAU/USD to gather further strength. The People's Bank of China (PBoC) announced on Monday that it cut the one-year Loan Prime Rate (LPR) by 25 basis points (bps) from 3.35% to 3.10%. Markets were forecasting the PBoC to lower that rate by 10 bps to 3.15%. Additionally, the Chinese central bank cut the five-year LPR from 3.85% to 3.60%.
The US Dollar (USD) Index staged a correction heading into the weekend and lost 0.3% on Friday, snapping an eight-day winning streak. The index stays in a consolidation phase at around 103.50 in the European morning on Monday. Meanwhile, US stock index futures trade virtually unchanged on the day.
EUR/USD recovered modestly on Friday but registered third consecutive weekly losses. The pair struggles to hold its ground early Monday and trades marginally lower on the day near 1.0850.
Reserve Bank of Australia (RBA) Deputy Governor Hauser said on Monday that they remain data-dependent, adding that the monetary policy is ready to respond in either direction. AUD/USD stays under modest bearish pressure early Monday and trades in negative territory below 0.6700.
After losing nearly 0.5% on Friday, USD/JPY started the week on the back foot and declined toward 149.00. With the USD holding its ground against its peers, however, the pair reversed its direction and was last seen trading marginally higher on the day above 149.50.
GBP/USD closed in positive territory on Thursday and Friday, erasing a large portion of its weekly losses. The pair holds steady above 1.3000 in the European morning on Monday.
Gold FAQs
Gold has played a key role in human’s history as it has been widely used as a store of value and medium of exchange. Currently, apart from its shine and usage for jewelry, the precious metal is widely seen as a safe-haven asset, meaning that it is considered a good investment during turbulent times. Gold is also widely seen as a hedge against inflation and against depreciating currencies as it doesn’t rely on any specific issuer or government.
Central banks are the biggest Gold holders. In their aim to support their currencies in turbulent times, central banks tend to diversify their reserves and buy Gold to improve the perceived strength of the economy and the currency. High Gold reserves can be a source of trust for a country’s solvency. Central banks added 1,136 tonnes of Gold worth around $70 billion to their reserves in 2022, according to data from the World Gold Council. This is the highest yearly purchase since records began. Central banks from emerging economies such as China, India and Turkey are quickly increasing their Gold reserves.
Gold has an inverse correlation with the US Dollar and US Treasuries, which are both major reserve and safe-haven assets. When the Dollar depreciates, Gold tends to rise, enabling investors and central banks to diversify their assets in turbulent times. Gold is also inversely correlated with risk assets. A rally in the stock market tends to weaken Gold price, while sell-offs in riskier markets tend to favor the precious metal.
The price can move due to a wide range of factors. Geopolitical instability or fears of a deep recession can quickly make Gold price escalate due to its safe-haven status. As a yield-less asset, Gold tends to rise with lower interest rates, while higher cost of money usually weighs down on the yellow metal. Still, most moves depend on how the US Dollar (USD) behaves as the asset is priced in dollars (XAU/USD). A strong Dollar tends to keep the price of Gold controlled, whereas a weaker Dollar is likely to push Gold prices up.
- EUR/JPY edges lower to near 162.15 in Monday’s early European session, down 0.20% on the day.
- A dovish ECB could undermine the shared currency in the near term.
- BOJ policymaker said the bank must scrutinize risks and avoid premature rate hikes.
The EUR/JPY cross attracts some sellers to around 162.15 during the early European session on Monday. The dovish tone of the European Central Bank (ECB) officials continues to weigh on the Euro (EUR) against the Japanese Yen (JPY). Investors will focus on ECB President Christine Lagarde's speech on Tuesday for fresh catalysts.
The rising speculation that the ECB may accelerate its pace of policy easing could exert some selling pressure on the EUR. The ECB lowered the deposit rate by a further 25 basis points (bps) at its October meeting. President Christine Lagarde said during the press conference that there is “probably” more downside than upside risk to the ECB’s inflation forecast.
Lagarde added that the central bank will not pre-commit to any particular rate path and would analyze all available data between now and December before deciding the next steps. ECB policymaker Francois Villeroy de Galhau said on Saturday that the Euro-area consumer price growth probably will be at the ECB’s 2% target in early 2025, per Bloomberg.
On the other hand, the verbal intervention from Japanese authorities supports the JPY. On Friday, Japan's top currency diplomat, Atsushi Mimura, stated that the officials will monitor the foreign exchange moves with a high sense of urgency.
Nonetheless, the uncertainty over the timing and pace of further rate hikes by the Bank of Japan (BoJ) should cap the upside for the JPY and create a tailwind for EUR/JPY. The BoJ policymaker Seiji Adachi said last week that the Japanese central bank must raise interest rates at a "very moderate" pace and avoid hiking prematurely.
Japanese Yen FAQs
The Japanese Yen (JPY) is one of the world’s most traded currencies. Its value is broadly determined by the performance of the Japanese economy, but more specifically by the Bank of Japan’s policy, the differential between Japanese and US bond yields, or risk sentiment among traders, among other factors.
One of the Bank of Japan’s mandates is currency control, so its moves are key for the Yen. The BoJ has directly intervened in currency markets sometimes, generally to lower the value of the Yen, although it refrains from doing it often due to political concerns of its main trading partners. The BoJ ultra-loose monetary policy between 2013 and 2024 caused the Yen to depreciate against its main currency peers due to an increasing policy divergence between the Bank of Japan and other main central banks. More recently, the gradually unwinding of this ultra-loose policy has given some support to the Yen.
Over the last decade, the BoJ’s stance of sticking to ultra-loose monetary policy has led to a widening policy divergence with other central banks, particularly with the US Federal Reserve. This supported a widening of the differential between the 10-year US and Japanese bonds, which favored the US Dollar against the Japanese Yen. The BoJ decision in 2024 to gradually abandon the ultra-loose policy, coupled with interest-rate cuts in other major central banks, is narrowing this differential.
The Japanese Yen is often seen as a safe-haven investment. This means that in times of market stress, investors are more likely to put their money in the Japanese currency due to its supposed reliability and stability. Turbulent times are likely to strengthen the Yen’s value against other currencies seen as more risky to invest in.
FX option expiries for Oct 18 NY cut at 10:00 Eastern Time, via DTCC, can be found below.
EUR/USD: EUR amounts
- 1.0775 535m
- 1.0885 1.4b
- 1.0940 621m
- 1.1000 2.1b
GBP/USD: GBP amounts
- 1.2910 444m
- 1.2945 440m
- 1.3240 509m
USD/JPY: USD amounts
- 150.00 580m
USD/CHF: USD amounts
- 0.8600 554m
AUD/USD: AUD amounts
- 0.6590 2.2b
- 0.6840 1.9b
USD/CAD: USD amounts
- 1.3600 837m
- 1.3800 1.1b
- 1.3900 1.4b
- GBP/USD edges lower at the start of a new week amid a modest USD strength.
- The fundamental backdrop supports prospects for a further depreciating move.
- A slide towards the 1.2960 confluence support looks like a distinct possibility.
The GBP/USD pair struggles to capitalize on a two-day-old recovery move from the 1.2975 area, or a nearly two-month trough touched last Thursday and kicks off the new week on a softer note. Spot prices currently trade just below mid-1.3000s and seem vulnerable to prolonging the recent pullback from the 1.3435 region, or the highest level since March 2022.
The US Dollar (USD) attracts some dip-buyers at the start of a new week and reverses a part of Friday's losses amid expectations that the Federal Reserve (Fed) will proceed with modest rate cuts over the next year. The British Pound (GBP), on the other hand, is undermined by rising bets for interest rate cuts by the Bank of England (BoE) in November and December. This, in turn, adds credence to the near-term negative outlook for the GBP/USD pair.
From a technical perspective, the recent breakdown through the 50-day Simple Moving Average (SMA) and the subsequent fall below the 50% Fibonacci retracement level of the August-September upswing was seen as a fresh trigger for bears. Furthermore, oscillators on the daily chart are holding in negative territory and are still away from being in the oversold territory, suggesting that the path of least resistance for the GBP/USD pair is to the downside.
Hence, some follow-through weakness back below the 1.3000 psychological mark, towards testing the 1.2960-1.2955 confluence support, looks like a distinct possibility. The latter comprises the 100-day SMA and the 61.8% Fibo. level, which if broken should pave the way for a slide towards the 1.2900 round figure en route to the 1.2860 horizontal support.
On the flip side, attempted recovery beyond the 1.3100 mark is likely to confront resistance near the 1.3135 region, or the 38.2% Fibo. level. The said hurdle now coincides with the 50-day SMA and should act as a key pivotal point. A sustained strength beyond might shift the bias in favor of bullish traders and allow the GBP/USD pair to reclaim the 1.3200 mark. The move up could extend further towards the 1.3250 strong horizontal support breakpoint.
GBP/USD daily chart
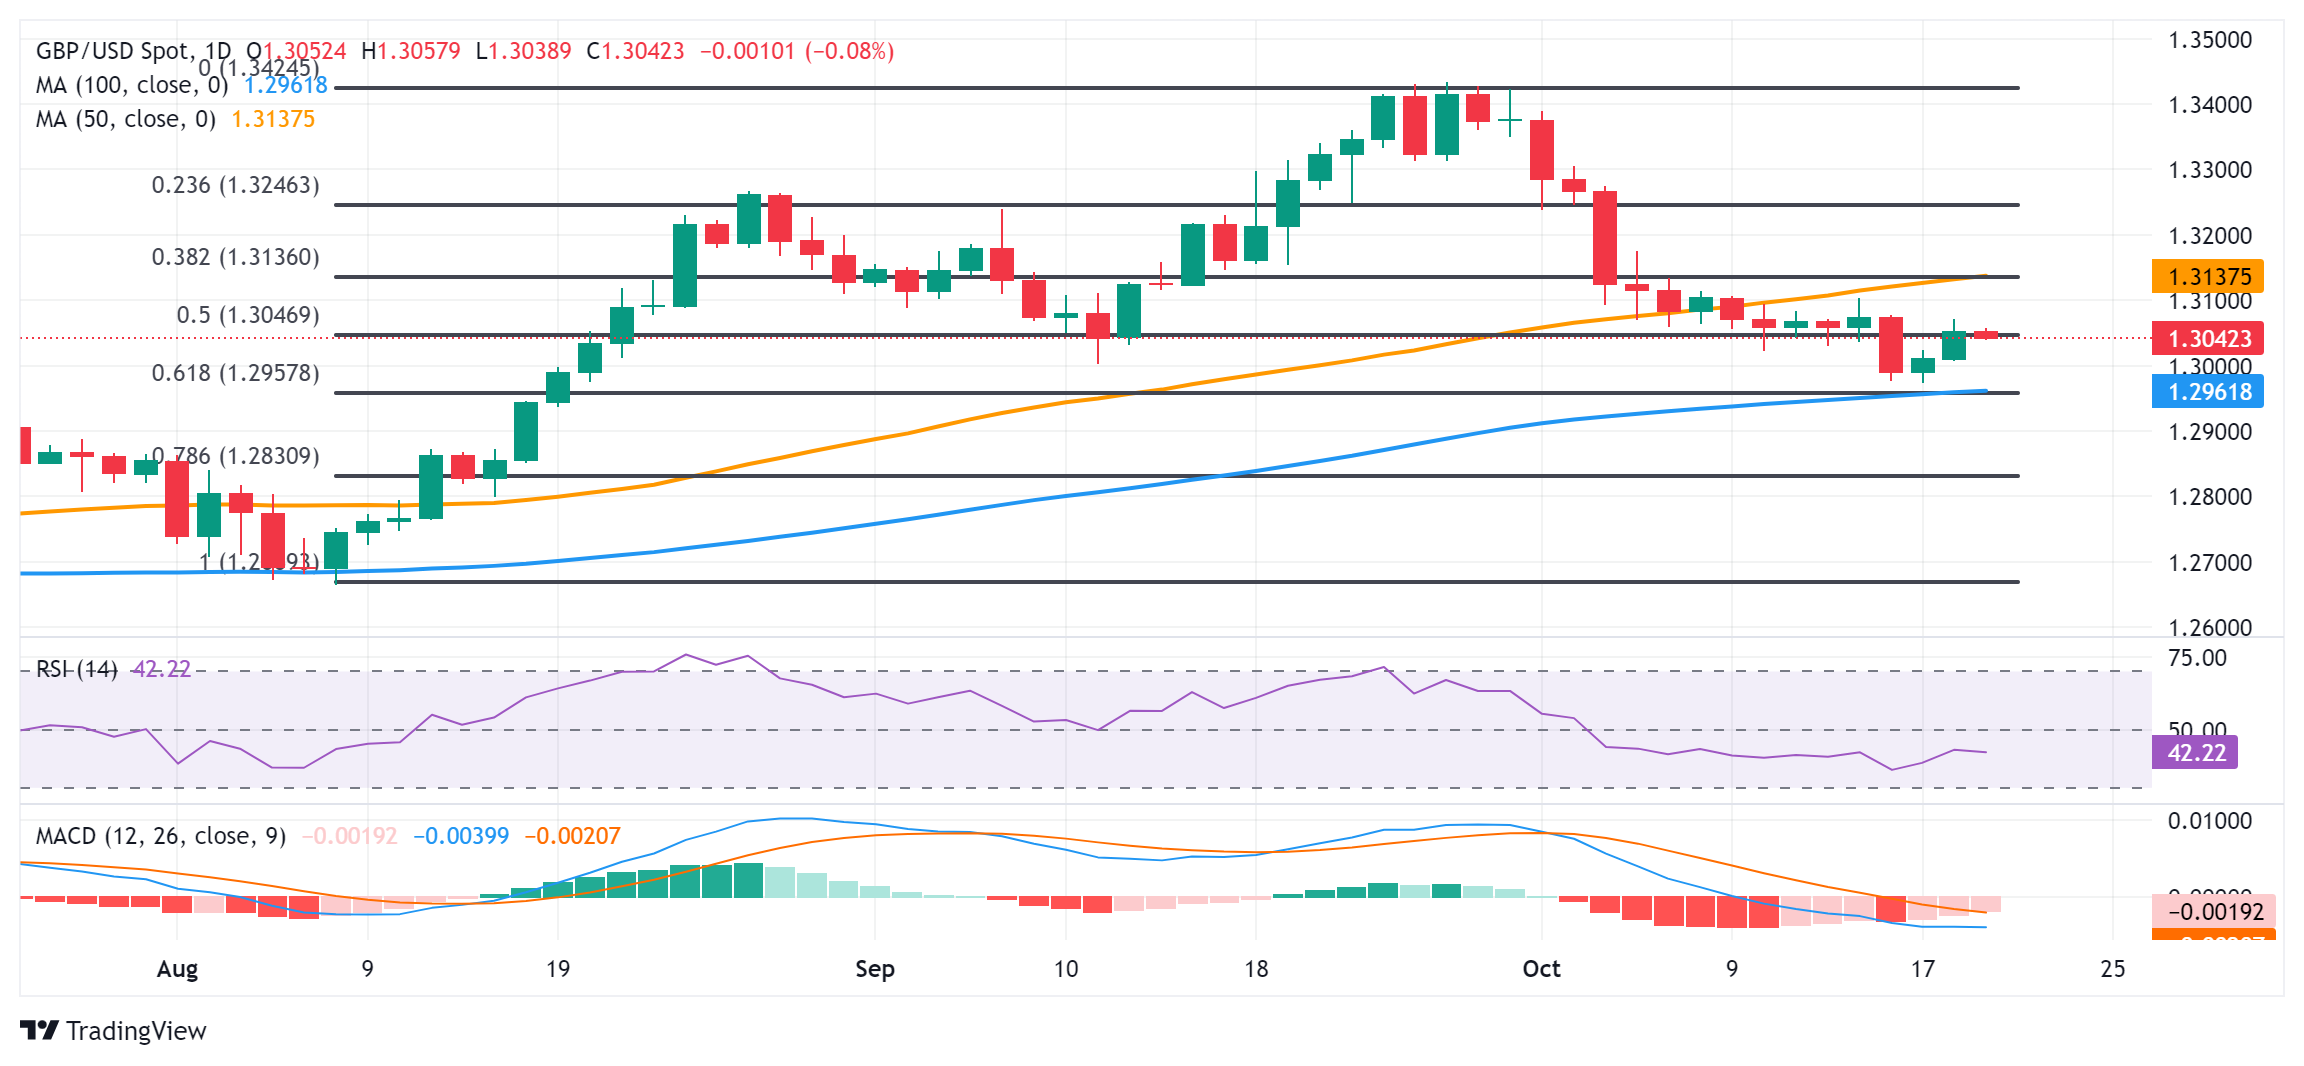
US Dollar PRICE Today
The table below shows the percentage change of US Dollar (USD) against listed major currencies today. US Dollar was the strongest against the Australian Dollar.
| USD | EUR | GBP | JPY | CAD | AUD | NZD | CHF | |
|---|---|---|---|---|---|---|---|---|
| USD | 0.05% | 0.08% | -0.16% | -0.01% | 0.14% | -0.02% | 0.08% | |
| EUR | -0.05% | -0.04% | -0.28% | -0.01% | 0.05% | -0.19% | -0.05% | |
| GBP | -0.08% | 0.04% | -0.23% | -0.09% | 0.07% | -0.11% | -0.05% | |
| JPY | 0.16% | 0.28% | 0.23% | 0.14% | 0.30% | 0.18% | 0.18% | |
| CAD | 0.01% | 0.00% | 0.09% | -0.14% | 0.06% | 0.05% | -0.04% | |
| AUD | -0.14% | -0.05% | -0.07% | -0.30% | -0.06% | -0.09% | -0.14% | |
| NZD | 0.02% | 0.19% | 0.11% | -0.18% | -0.05% | 0.09% | 0.05% | |
| CHF | -0.08% | 0.05% | 0.05% | -0.18% | 0.04% | 0.14% | -0.05% |
The heat map shows percentage changes of major currencies against each other. The base currency is picked from the left column, while the quote currency is picked from the top row. For example, if you pick the US Dollar from the left column and move along the horizontal line to the Japanese Yen, the percentage change displayed in the box will represent USD (base)/JPY (quote).
- EUR/USD could return to the descending channel as a bearish bias is active.
- The pair could approach the "throwback support" near the psychological level of 1.0800.
- The nine-day EMA at 1.0897 appears as the immediate barrier.
EUR/USD inches lower to near 1.0860 during the Asian session on Monday. A review of the daily chart shows that the pair has breached the descending channel pattern. If it re-enters the channel, it could reinforce a bearish bias for the pair.
Additionally, the 14-day Relative Strength Index (RSI), a key momentum indicator, is slightly above the 30 level. A drop below this threshold would indicate an oversold condition, suggesting the possibility of an upward correction for the EUR/USD pair in the near future.
On the downside, if the EUR/USD pair re-enters the descending channel, it could approach the "throwback support" near the psychological level of 1.0800. A break below this key level could increase selling pressure, pushing the pair toward testing the lower boundary of the descending channel around the 1.0770 mark.
In terms of resistance, the EUR/GBP pair may encounter an immediate hurdle around the nine-day Exponential Moving Average (EMA) at 1.0897, which is aligned with the psychological level of 1.0900. A break above this resistance could pave the way for the pair to explore the region around the major level of 1.1000.
EUR/USD: Daily Chart
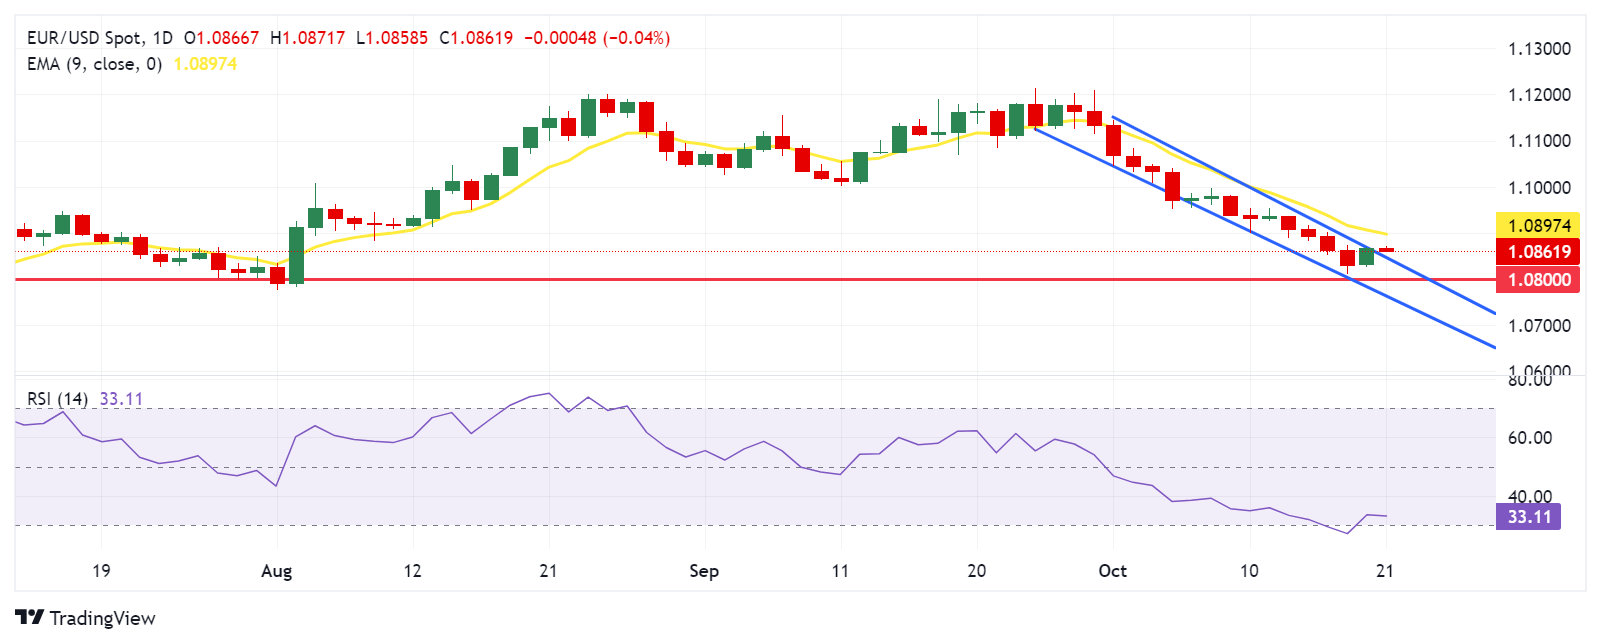
Euro PRICE Today
The table below shows the percentage change of Euro (EUR) against listed major currencies today. Euro was the weakest against the Japanese Yen.
| USD | EUR | GBP | JPY | CAD | AUD | NZD | CHF | |
|---|---|---|---|---|---|---|---|---|
| USD | 0.04% | 0.08% | -0.18% | -0.02% | 0.07% | -0.07% | 0.06% | |
| EUR | -0.04% | -0.03% | -0.31% | -0.00% | 0.00% | -0.22% | -0.08% | |
| GBP | -0.08% | 0.03% | -0.27% | -0.09% | 0.00% | -0.15% | -0.07% | |
| JPY | 0.18% | 0.31% | 0.27% | 0.14% | 0.24% | 0.15% | 0.17% | |
| CAD | 0.02% | 0.00% | 0.09% | -0.14% | 0.00% | 0.01% | -0.06% | |
| AUD | -0.07% | -0.00% | -0.01% | -0.24% | -0.00% | -0.07% | -0.09% | |
| NZD | 0.07% | 0.22% | 0.15% | -0.15% | -0.01% | 0.07% | 0.08% | |
| CHF | -0.06% | 0.08% | 0.07% | -0.17% | 0.06% | 0.09% | -0.08% |
The heat map shows percentage changes of major currencies against each other. The base currency is picked from the left column, while the quote currency is picked from the top row. For example, if you pick the Euro from the left column and move along the horizontal line to the US Dollar, the percentage change displayed in the box will represent EUR (base)/USD (quote).
Gold prices rose in India on Monday, according to data compiled by FXStreet.
The price for Gold stood at 7,381.28 Indian Rupees (INR) per gram, up compared with the INR 7,356.14 it cost on Friday.
The price for Gold increased to INR 86,096.29 per tola from INR 85,800.59 per tola on friday.
| Unit measure | Gold Price in INR |
|---|---|
| 1 Gram | 7,381.28 |
| 10 Grams | 73,813.05 |
| Tola | 86,096.29 |
| Troy Ounce | 229,581.90 |
FXStreet calculates Gold prices in India by adapting international prices (USD/INR) to the local currency and measurement units. Prices are updated daily based on the market rates taken at the time of publication. Prices are just for reference and local rates could diverge slightly.
Gold FAQs
Gold has played a key role in human’s history as it has been widely used as a store of value and medium of exchange. Currently, apart from its shine and usage for jewelry, the precious metal is widely seen as a safe-haven asset, meaning that it is considered a good investment during turbulent times. Gold is also widely seen as a hedge against inflation and against depreciating currencies as it doesn’t rely on any specific issuer or government.
Central banks are the biggest Gold holders. In their aim to support their currencies in turbulent times, central banks tend to diversify their reserves and buy Gold to improve the perceived strength of the economy and the currency. High Gold reserves can be a source of trust for a country’s solvency. Central banks added 1,136 tonnes of Gold worth around $70 billion to their reserves in 2022, according to data from the World Gold Council. This is the highest yearly purchase since records began. Central banks from emerging economies such as China, India and Turkey are quickly increasing their Gold reserves.
Gold has an inverse correlation with the US Dollar and US Treasuries, which are both major reserve and safe-haven assets. When the Dollar depreciates, Gold tends to rise, enabling investors and central banks to diversify their assets in turbulent times. Gold is also inversely correlated with risk assets. A rally in the stock market tends to weaken Gold price, while sell-offs in riskier markets tend to favor the precious metal.
The price can move due to a wide range of factors. Geopolitical instability or fears of a deep recession can quickly make Gold price escalate due to its safe-haven status. As a yield-less asset, Gold tends to rise with lower interest rates, while higher cost of money usually weighs down on the yellow metal. Still, most moves depend on how the US Dollar (USD) behaves as the asset is priced in dollars (XAU/USD). A strong Dollar tends to keep the price of Gold controlled, whereas a weaker Dollar is likely to push Gold prices up.
(An automation tool was used in creating this post.)
- GBP/JPY drifts lower for the second straight day amid modest JPY strength.
- Bets for faster BoE rate cuts undermine the GBP and weigh on the cross.
- The BoJ uncertainty might cap the JPY and help limit losses for spot prices.
The GBP/JPY cross kicks off the new week on a weaker tone and retreats further from its highest level since late July, around the 196.00 mark touched on Friday. Spot prices, however, remain confined in a familiar range held over the past two weeks or so and currently trade around the 194.70 region, down just over 0.20% for the day.
The Japanese Yen (JPY) continues with its relative outperformance for the second straight day amid renewed intervention fears, which, in turn, is seen as a key factor weighing on the GBP/JPY cross. In fact, Japan's top currency diplomat, Atsushi Mimura, warned against speculative trading and said on Friday that authorities are watching FX moves with a high sense of urgency. Adding to this, Japan's Deputy Chief Cabinet Secretary Kazuhiko Aoki noted that it is important for currencies to move in a stable manner reflecting economic fundamentals.
Meanwhile, a surprise fall in the UK Consumer Price Index (CPI) to the lowest level since April 2021 and below the Bank of England's (BoE) 2% target lifted bets for a 25 basis point (bps) interest rate cut at the November 7 meeting. Moreover, the money markets are pricing in the possibility of another BoE rate cut in December, which acts as a headwind for the British Pound (GBP) and exerts additional pressure on the GBP/JPY cross lower. That said, the uncertainty about the Bank of Japan's (BoJ) rate-hike plans should cap the JPY and offer support to the cross.
BoJ Governor Kazuo Ueda said on Friday that the central bank must focus on the economic impact of unstable markets and risks from overseas. This comes on top of Japanese Prime Minister Shigeru Ishiba's surprise opposition to additional rate hikes and suggests the BoJ was in no rush to tighten its policy further ahead of the general election on October 27. Apart from this, the risk-on mood should cap the safe-haven JPY and limit losses for the GBP/JPY cross, warranting caution before placing aggressive bearish bets in the absence of any relevant macro data.
BoE FAQs
The Bank of England (BoE) decides monetary policy for the United Kingdom. Its primary goal is to achieve ‘price stability’, or a steady inflation rate of 2%. Its tool for achieving this is via the adjustment of base lending rates. The BoE sets the rate at which it lends to commercial banks and banks lend to each other, determining the level of interest rates in the economy overall. This also impacts the value of the Pound Sterling (GBP).
When inflation is above the Bank of England’s target it responds by raising interest rates, making it more expensive for people and businesses to access credit. This is positive for the Pound Sterling because higher interest rates make the UK a more attractive place for global investors to park their money. When inflation falls below target, it is a sign economic growth is slowing, and the BoE will consider lowering interest rates to cheapen credit in the hope businesses will borrow to invest in growth-generating projects – a negative for the Pound Sterling.
In extreme situations, the Bank of England can enact a policy called Quantitative Easing (QE). QE is the process by which the BoE substantially increases the flow of credit in a stuck financial system. QE is a last resort policy when lowering interest rates will not achieve the necessary result. The process of QE involves the BoE printing money to buy assets – usually government or AAA-rated corporate bonds – from banks and other financial institutions. QE usually results in a weaker Pound Sterling.
Quantitative tightening (QT) is the reverse of QE, enacted when the economy is strengthening and inflation starts rising. Whilst in QE the Bank of England (BoE) purchases government and corporate bonds from financial institutions to encourage them to lend; in QT, the BoE stops buying more bonds, and stops reinvesting the principal maturing on the bonds it already holds. It is usually positive for the Pound Sterling.
- Silver price receives support from safe-haven flows amid rising Middle-East tensions.
- Israel targeted the offices of Hezbollah's al-Qard al-Hassan financial institution in southern Beirut.
- The non-yielding Silver gains ground due to easing monetary policies from major central banks.
Silver price (XAG/USD) extends its winning streak for the fifth consecutive day, trading around $34.10 during the Asian session on Monday. This upward trend is driven by safe-haven demand amidst escalating geopolitical tensions in the Middle East.
Lebanese media report that Israel has launched a new series of airstrikes on southern Beirut, targeting the offices of Hezbollah's al-Qard al-Hassan financial institution. Furthermore, the US government has initiated an investigation into the unauthorized release of classified documents that outline Israel's military preparations for a potential strike on Iran.
Furthermore, easing monetary policies from major central banks are bolstering non-yielding Silver prices. On Monday, the People's Bank of China (PBoC) reduced the 1-year Loan Prime Rate (LPR) from 3.35% to 3.10% and the 5-year LPR from 3.85% to 3.60%. Last week, the European Central Bank (ECB) also opted to cut its interest rates by 25 basis points.
The Bank of Canada (BoC) is widely anticipated to implement a significant interest rate cut of 50 basis points at its upcoming monetary policy meeting on Wednesday. Recent inflation data suggests that both the Bank of England (BoE) and the Reserve Bank of New Zealand (RBNZ) may consider potential rate cuts next month. Additionally, the US Federal Reserve (Fed) is expected to lower interest rates by 50 basis points by the end of 2024.
Regarding the US elections, markets appear optimistic about Republican nominee Donald Trump winning the 2024 presidential election. Trump's fiscal and trade policies are viewed as inflationary and favorable for the US Dollar (USD), which could negatively impact Silver demand. A stronger US Dollar makes Silver more expensive for buyers using foreign currencies, potentially dampening their purchasing power.
Silver FAQs
Silver is a precious metal highly traded among investors. It has been historically used as a store of value and a medium of exchange. Although less popular than Gold, traders may turn to Silver to diversify their investment portfolio, for its intrinsic value or as a potential hedge during high-inflation periods. Investors can buy physical Silver, in coins or in bars, or trade it through vehicles such as Exchange Traded Funds, which track its price on international markets.
Silver prices can move due to a wide range of factors. Geopolitical instability or fears of a deep recession can make Silver price escalate due to its safe-haven status, although to a lesser extent than Gold's. As a yieldless asset, Silver tends to rise with lower interest rates. Its moves also depend on how the US Dollar (USD) behaves as the asset is priced in dollars (XAG/USD). A strong Dollar tends to keep the price of Silver at bay, whereas a weaker Dollar is likely to propel prices up. Other factors such as investment demand, mining supply – Silver is much more abundant than Gold – and recycling rates can also affect prices.
Silver is widely used in industry, particularly in sectors such as electronics or solar energy, as it has one of the highest electric conductivity of all metals – more than Copper and Gold. A surge in demand can increase prices, while a decline tends to lower them. Dynamics in the US, Chinese and Indian economies can also contribute to price swings: for the US and particularly China, their big industrial sectors use Silver in various processes; in India, consumers’ demand for the precious metal for jewellery also plays a key role in setting prices.
Silver prices tend to follow Gold's moves. When Gold prices rise, Silver typically follows suit, as their status as safe-haven assets is similar. The Gold/Silver ratio, which shows the number of ounces of Silver needed to equal the value of one ounce of Gold, may help to determine the relative valuation between both metals. Some investors may consider a high ratio as an indicator that Silver is undervalued, or Gold is overvalued. On the contrary, a low ratio might suggest that Gold is undervalued relative to Silver.
- Gold price prolongs its upward trajectory and touches a fresh record high on Monday.
- Major central banks remain in rate-cut mode and continue to benefit the XAU/USD.
- Middle East tensions and US political uncertainty further underpin the precious metal.
Gold price (XAU/USD) builds on Friday's breakout momentum above the $2,700 mark and gains some follow-through traction for the fifth successive day at the start of a new week. This also marks the seventh day of a positive move in the previous eight and lifts the commodity to a fresh record high, beyond the $2,730 region during the Asian session. Persistent geopolitical risks stemming from the ongoing conflicts in the Middle East, along with the US political uncertainty ahead of the Presidential election on November 5, continue to underpin the safe-haven precious metal.
Apart from this, the easing monetary policy environment and the expected interest rate cuts by major central banks contribute to driving flows towards the non-yielding Gold price. The supporting factors, to a large extent, overshadow the prevalent risk-on environment and the recent US Dollar (USD) upswing to its highest level since early August, which tends to dent demand for the XAU/USD. That said, slightly overbought conditions on the daily chart might cap any further appreciating move for the yellow metal amid bets for less aggressive easing by the Federal Reserve (Fed).
Daily Digest Market Movers: Gold price benefits from geopolitical risks, rate cut expectations and the US political uncertainty
- A combination of supporting factors assists the Gold price to prolong its recent well-established uptrend and touch a fresh all-time peak during the Asian session on Monday.
- Tensions and conflicts in the Middle East show no signs of abating despite the killing of Hamas leader Yahya Sinwar as Israel prepares to respond to Iran’s early-October strike.
- Israel's Prime Minister Benjamin Netanyahu said that the attack on his private residence by Iran's Lebanese proxy Hezbollah would not deter him from continuing the war.
- The Israeli army launched a series of air strikes across Lebanon and also intensified attacks across Gaza, raising the risk of a full-blown regional war in the Middle East.
- Recent polls indicate a close contest between Donald Trump and Vice President Kamala Harris, adding a layer of uncertainty and benefiting the safe-haven XAU/USD.
- The European Central Bank last week decided to lower interest rates for the third time this year – marking the first back-to-back rate cut in 13 years – and eyes more cuts.
- The Federal Reserve is also anticipated to lower borrowing costs further, while weak inflation data from the UK solidified bets for a more aggressive easing by the Bank of England.
- Investors have fully priced out the possibility of another jumbo interest rate cut by the Fed in November as the incoming macro data continue to point to a resilient US economy.
- Atlanta Fed President Raphael Bostic said that he is not in a rush to cut rates and see the case for a reduction in the policy rate to somewhere between 3% and 3.5% by the end of next year.
- The yield on the benchmark 10-year US government bond holds above 4% and acts as a tailwind for the USD, albeit does little to hinder the commodity's positive move.
- Investors continue to cheer the launch of two funding schemes on Friday by the People's Bank of China aimed at supporting the development of capital markets.
Technical Outlook: Gold price needs to consolidate amid slightly overbought RSI on the daily chart, bullish bias remains
From a technical perspective, last week's sustained strength and close above the $2,700 mark could be seen as a fresh trigger for bullish traders. That said, the Relative Strength Index (RSI) on the daily chart has moved beyond the 70 mark, flashing slightly overbought conditions. This, in turn, makes it prudent to wait for some near-term consolidation or a modest pullback before positioning for an extension of the recent well-established uptrend.
Meanwhile, the $2,700 round figure now seems to protect the immediate downside, below which the Gold price could accelerate the corrective decline towards the $2,662-2,660 zone. The next relevant support is pegged near the $2,647-2,646 area. A convincing break below the latter might prompt some technical selling and expose the $2,600 mark with some intermediate support near the $2,630 region.
Gold FAQs
Gold has played a key role in human’s history as it has been widely used as a store of value and medium of exchange. Currently, apart from its shine and usage for jewelry, the precious metal is widely seen as a safe-haven asset, meaning that it is considered a good investment during turbulent times. Gold is also widely seen as a hedge against inflation and against depreciating currencies as it doesn’t rely on any specific issuer or government.
Central banks are the biggest Gold holders. In their aim to support their currencies in turbulent times, central banks tend to diversify their reserves and buy Gold to improve the perceived strength of the economy and the currency. High Gold reserves can be a source of trust for a country’s solvency. Central banks added 1,136 tonnes of Gold worth around $70 billion to their reserves in 2022, according to data from the World Gold Council. This is the highest yearly purchase since records began. Central banks from emerging economies such as China, India and Turkey are quickly increasing their Gold reserves.
Gold has an inverse correlation with the US Dollar and US Treasuries, which are both major reserve and safe-haven assets. When the Dollar depreciates, Gold tends to rise, enabling investors and central banks to diversify their assets in turbulent times. Gold is also inversely correlated with risk assets. A rally in the stock market tends to weaken Gold price, while sell-offs in riskier markets tend to favor the precious metal.
The price can move due to a wide range of factors. Geopolitical instability or fears of a deep recession can quickly make Gold price escalate due to its safe-haven status. As a yield-less asset, Gold tends to rise with lower interest rates, while higher cost of money usually weighs down on the yellow metal. Still, most moves depend on how the US Dollar (USD) behaves as the asset is priced in dollars (XAU/USD). A strong Dollar tends to keep the price of Gold controlled, whereas a weaker Dollar is likely to push Gold prices up.
- The Indian Rupee strengthens in Monday’s Asian session.
- Substantial equity outflows could undermine the INR, but likely RBI intervention might cap its losses.
- Investors await Fedspeak on Monday for fresh impetus.
The Indian Rupee (INR) recovers on Monday amid the decline in crude oil prices and softer US Dollar (USD). Persistent outflows from Indian equities might exert some selling pressure on the local currency in the near term.
However, the interventions by the Reserve Bank of India (RBI) through USD sales could help limit the INR’s losses. Looking ahead, Investors will monitor the Federal Reserve (Fed) Neel Kashkari and Jeffrey Schmid speeches on Monday for fresh impetus.
Daily Digest Market Movers: Indian Rupee rebounds, the potential upside seems limited
- Foreign portfolio investors have sold a net amount of $8.4 billion so far in October, surpassing the previous record outflow of $8.35 billion set in March 2020.
- Atlanta Fed President Raphael Bostic said on Friday that he is not in a rush on rate cuts and sees the case for rate reduction in the central bank's policy rate to somewhere between 3% and 3.5% by the end of next year, per Reuters.
- According to the CME FedWatch tool, traders have priced in a nearly 92.6% chance of a 25 basis points (bps) Fed rate cut in November.
- The US Building Permits fell by 2.9% to 1.428 million in September from 1.47 million in August, missing estimates of 1.46 million.
- Housing Starts for September declined by 0.5% to 1.354 millionversus 1.361 million prior, above the consensus of 1.35 million.
Technical Analysis: USD/INR keeps the positive picture in the longer term
The Indian Rupee edges higher on the day. Technically, the bullish outlook of the USD/INR pair prevails on the daily timeframe, with the price holding above the ascending trend line and the key 100-day Exponential Moving Average (EMA). The 14-day Relative Strength Index (RSI) stands above the midline near 60.00, suggesting the further upside looks favorable.
Consistent demand above the all-time high of 84.15 could lead to a bullish upswing that could take USD/INR to 84.50, en route to the 85.00 psychological level.
On the downside, a decisive break below the rising trend line of 84.00 could revisit the previous support level at 83.71, the 100-day EMA. The next contention level to watch is 83.00, representing the round mark and the low of May 24.
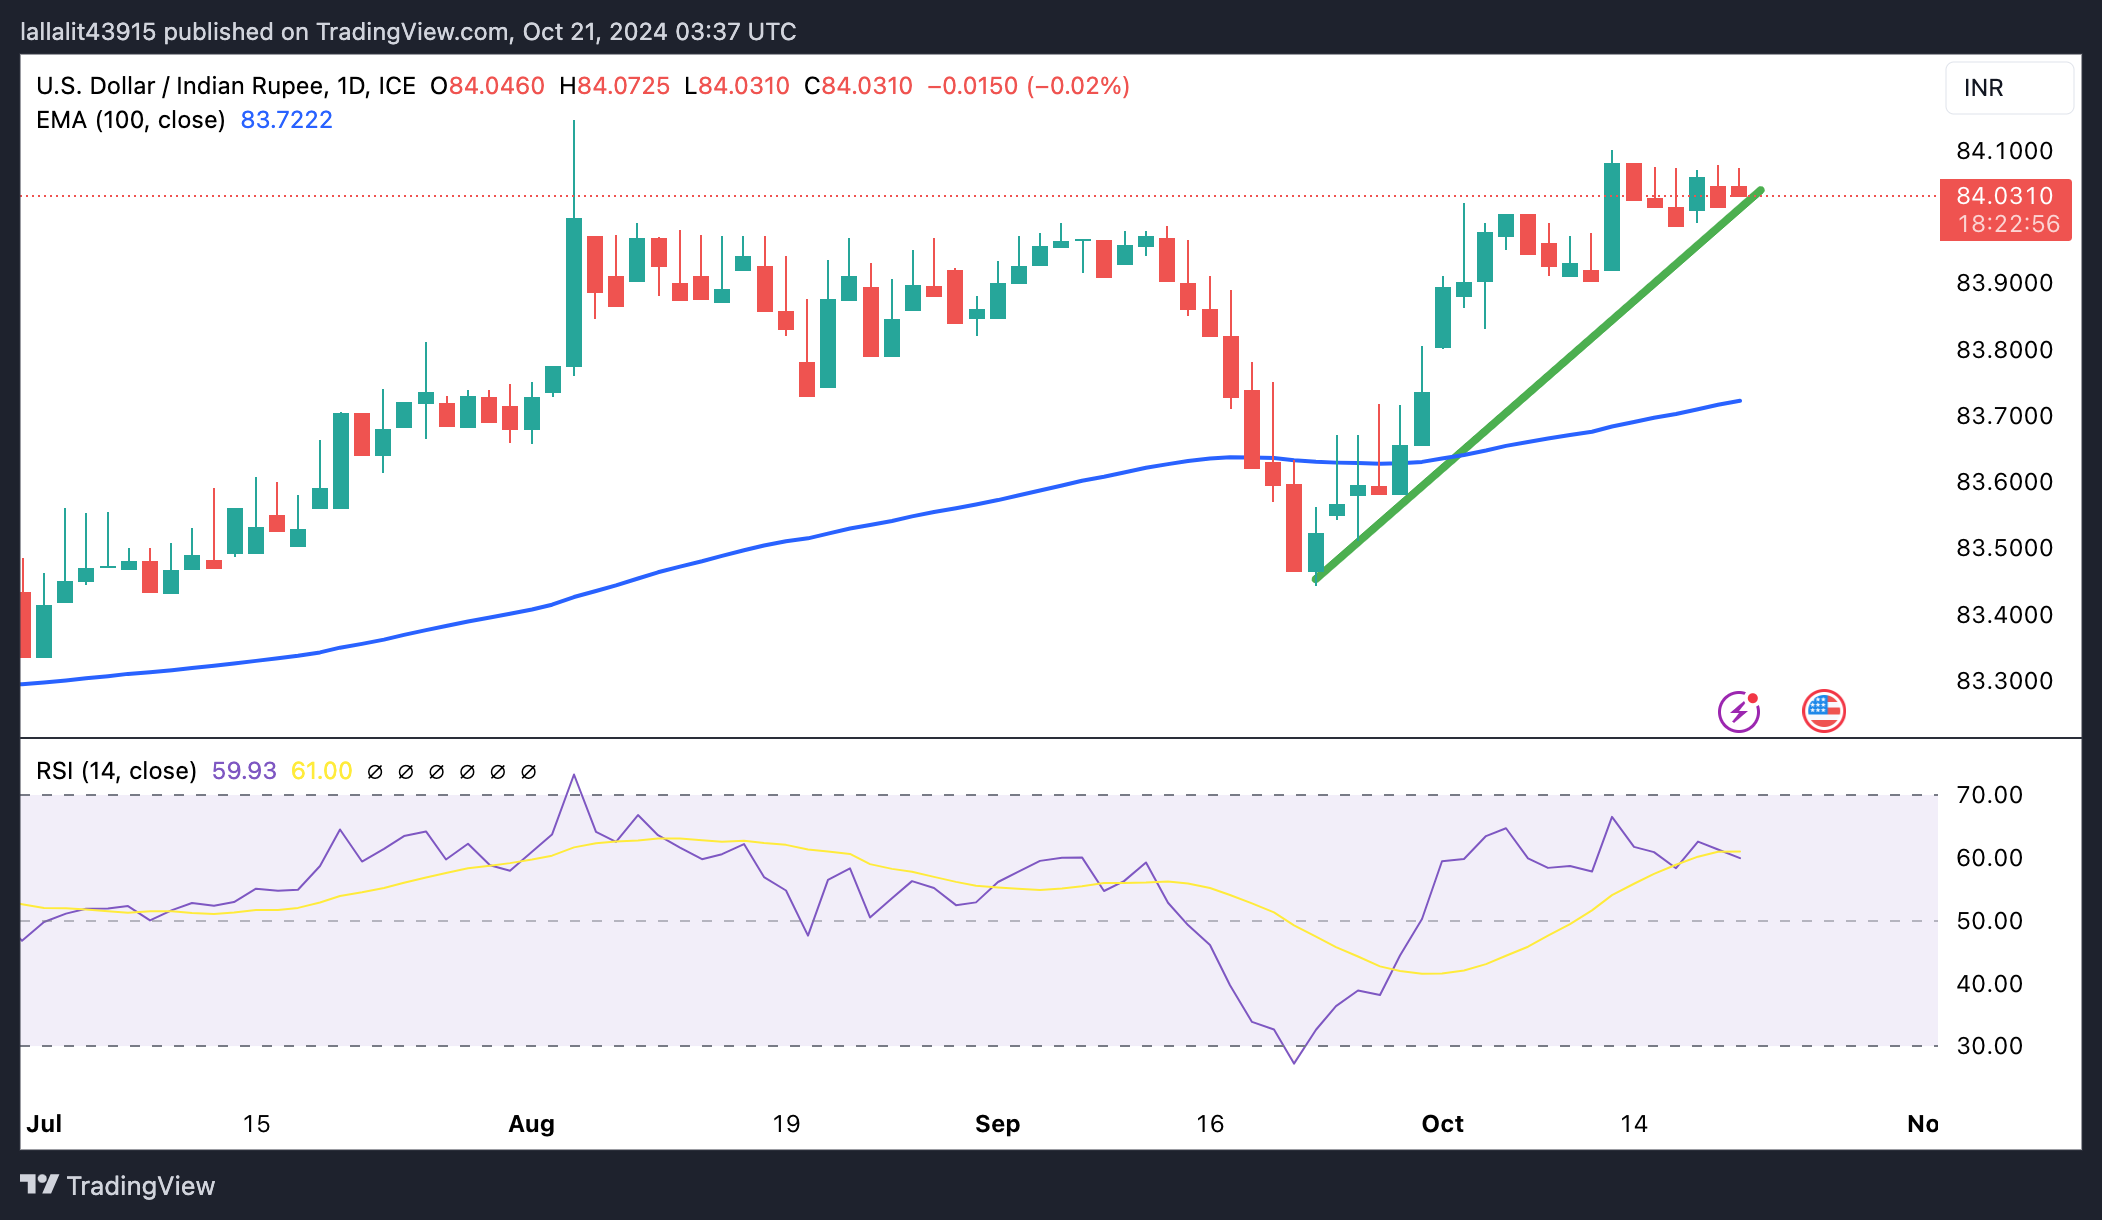
Indian Rupee FAQs
The Indian Rupee (INR) is one of the most sensitive currencies to external factors. The price of Crude Oil (the country is highly dependent on imported Oil), the value of the US Dollar – most trade is conducted in USD – and the level of foreign investment, are all influential. Direct intervention by the Reserve Bank of India (RBI) in FX markets to keep the exchange rate stable, as well as the level of interest rates set by the RBI, are further major influencing factors on the Rupee.
The Reserve Bank of India (RBI) actively intervenes in forex markets to maintain a stable exchange rate, to help facilitate trade. In addition, the RBI tries to maintain the inflation rate at its 4% target by adjusting interest rates. Higher interest rates usually strengthen the Rupee. This is due to the role of the ‘carry trade’ in which investors borrow in countries with lower interest rates so as to place their money in countries’ offering relatively higher interest rates and profit from the difference.
Macroeconomic factors that influence the value of the Rupee include inflation, interest rates, the economic growth rate (GDP), the balance of trade, and inflows from foreign investment. A higher growth rate can lead to more overseas investment, pushing up demand for the Rupee. A less negative balance of trade will eventually lead to a stronger Rupee. Higher interest rates, especially real rates (interest rates less inflation) are also positive for the Rupee. A risk-on environment can lead to greater inflows of Foreign Direct and Indirect Investment (FDI and FII), which also benefit the Rupee.
Higher inflation, particularly, if it is comparatively higher than India’s peers, is generally negative for the currency as it reflects devaluation through oversupply. Inflation also increases the cost of exports, leading to more Rupees being sold to purchase foreign imports, which is Rupee-negative. At the same time, higher inflation usually leads to the Reserve Bank of India (RBI) raising interest rates and this can be positive for the Rupee, due to increased demand from international investors. The opposite effect is true of lower inflation.
- USD/CAD receives support as BoC is widely expected to reduce interest rates by 50 basis points on Wednesday.
- The commodity-linked CAD faced challenges due to lower crude Oil prices.
- The US Dollar gains ground as the economy's resilience has increased the odds of nominal rate cuts by the Fed.
USD/CAD continues to gain ground as the Canadian Dollar (CAD) receives downward pressure ahead of the Bank of Canada (BoC) interest rate decision scheduled for Wednesday. The USD/CAD pair moves above 1.3800 during Monday’s Asian trading hours.
Decreasing price pressures, combined with a notable decline in labor growth and household spending, have fueled expectations that the Bank of Canada (BoC) will implement a significant interest rate cut of 50 basis points (bps) at its upcoming monetary policy meeting.
Additionally, lower Oil prices have put pressure on the commodity-linked Loonie Dollar as Canada is the largest Oil exporter to the United States (US). Last week, crude Oil prices depreciated by more than 7%, partly due to slowing economic growth in China and easing Middle-East tensions. West Texas Intermediate (WTI) Oil price trades around $69.00 per barrel at the time of writing.
US Dollar (USD) receives support due to fading odds of further aggressive rate cuts by the US Federal Reserve (Fed) in 2024. Last week’s data showed the US economy's resilience, which has strengthened the likelihood of a nominal rate cut by the Federal Reserve (Fed) in November.
According to the CME FedWatch Tool, the probability of a 25-basis-point rate cut in November has risen to 99.3%, up from 89.5% a week earlier.
The monthly US Retail Sales rose by 0.4% in September, surpassing the 0.1% increase recorded in August and the expected gain of 0.3%. Additionally, US Initial Jobless Claims fell by 19,000 during the week ending October 11, the largest decline in three months. The total number of claims dropped to 241,000, significantly below the anticipated 260,000.
Canadian Dollar FAQs
The key factors driving the Canadian Dollar (CAD) are the level of interest rates set by the Bank of Canada (BoC), the price of Oil, Canada’s largest export, the health of its economy, inflation and the Trade Balance, which is the difference between the value of Canada’s exports versus its imports. Other factors include market sentiment – whether investors are taking on more risky assets (risk-on) or seeking safe-havens (risk-off) – with risk-on being CAD-positive. As its largest trading partner, the health of the US economy is also a key factor influencing the Canadian Dollar.
The Bank of Canada (BoC) has a significant influence on the Canadian Dollar by setting the level of interest rates that banks can lend to one another. This influences the level of interest rates for everyone. The main goal of the BoC is to maintain inflation at 1-3% by adjusting interest rates up or down. Relatively higher interest rates tend to be positive for the CAD. The Bank of Canada can also use quantitative easing and tightening to influence credit conditions, with the former CAD-negative and the latter CAD-positive.
The price of Oil is a key factor impacting the value of the Canadian Dollar. Petroleum is Canada’s biggest export, so Oil price tends to have an immediate impact on the CAD value. Generally, if Oil price rises CAD also goes up, as aggregate demand for the currency increases. The opposite is the case if the price of Oil falls. Higher Oil prices also tend to result in a greater likelihood of a positive Trade Balance, which is also supportive of the CAD.
While inflation had always traditionally been thought of as a negative factor for a currency since it lowers the value of money, the opposite has actually been the case in modern times with the relaxation of cross-border capital controls. Higher inflation tends to lead central banks to put up interest rates which attracts more capital inflows from global investors seeking a lucrative place to keep their money. This increases demand for the local currency, which in Canada’s case is the Canadian Dollar.
Macroeconomic data releases gauge the health of the economy and can have an impact on the Canadian Dollar. Indicators such as GDP, Manufacturing and Services PMIs, employment, and consumer sentiment surveys can all influence the direction of the CAD. A strong economy is good for the Canadian Dollar. Not only does it attract more foreign investment but it may encourage the Bank of Canada to put up interest rates, leading to a stronger currency. If economic data is weak, however, the CAD is likely to fall.
- WTI could receive support as PBoC rate cuts could stimulate China’s economic activity, potentially increasing Oil demand.
- US President Joe Biden stated that there is an opportunity to end the conflict between Israel and Iran for a while.
- Shell and Singapore's Maritime and Port Authority have implemented clean-up measures in response to a leak from a land-based pipeline.
West Texas Intermediate (WTI) Oil price edges higher following a more than 7% decline registered in the previous week, trading around $68.90 per barrel during the Asian hours on Monday. However, the downside may be limited as rate cuts in China, the largest Oil importer, are expected to stimulate domestic economic activity, potentially increasing demand for Oil. The People's Bank of China (PBoC) lowered the 1-year Loan Prime Rate (LPR) to 3.10% from 3.35% and the 5-year LPR to 3.6% from 3.85%, aligning with expectations.
However, crude Oil prices received downward pressure, partly due to slowing economic growth in China. On Friday, China’s Gross Domestic Product (GDP) grew at an annual rate of 4.6% in the third quarter of 2024, slightly down from the 4.7% growth recorded in the second quarter but surpassing market expectations of 4.5%.
Additionally, easing geopolitical tensions in the Middle East have lessened concerns over supply disruptions from the region. US President Joe Biden stated on Friday that there is an opportunity to "deal with Israel and Iran in a way that ends the conflict for a while." However, on Sunday, Israel announced that it was preparing to target sites in Beirut linked to Hezbollah's financial operations, according to Reuters.
In another development, Reuters reported that Shell and Singapore's Maritime and Port Authority implemented clean-up measures following a leak from a land-based pipeline. The leak has reportedly been contained at the source, with no impact on navigation safety. A Shell spokesperson confirmed the leak at the Shell Energy and Chemicals Park, stating that emergency response specialists had been dispatched to manage the situation.
WTI Oil FAQs
WTI Oil is a type of Crude Oil sold on international markets. The WTI stands for West Texas Intermediate, one of three major types including Brent and Dubai Crude. WTI is also referred to as “light” and “sweet” because of its relatively low gravity and sulfur content respectively. It is considered a high quality Oil that is easily refined. It is sourced in the United States and distributed via the Cushing hub, which is considered “The Pipeline Crossroads of the World”. It is a benchmark for the Oil market and WTI price is frequently quoted in the media.
Like all assets, supply and demand are the key drivers of WTI Oil price. As such, global growth can be a driver of increased demand and vice versa for weak global growth. Political instability, wars, and sanctions can disrupt supply and impact prices. The decisions of OPEC, a group of major Oil-producing countries, is another key driver of price. The value of the US Dollar influences the price of WTI Crude Oil, since Oil is predominantly traded in US Dollars, thus a weaker US Dollar can make Oil more affordable and vice versa.
The weekly Oil inventory reports published by the American Petroleum Institute (API) and the Energy Information Agency (EIA) impact the price of WTI Oil. Changes in inventories reflect fluctuating supply and demand. If the data shows a drop in inventories it can indicate increased demand, pushing up Oil price. Higher inventories can reflect increased supply, pushing down prices. API’s report is published every Tuesday and EIA’s the day after. Their results are usually similar, falling within 1% of each other 75% of the time. The EIA data is considered more reliable, since it is a government agency.
OPEC (Organization of the Petroleum Exporting Countries) is a group of 12 Oil-producing nations who collectively decide production quotas for member countries at twice-yearly meetings. Their decisions often impact WTI Oil prices. When OPEC decides to lower quotas, it can tighten supply, pushing up Oil prices. When OPEC increases production, it has the opposite effect. OPEC+ refers to an expanded group that includes ten extra non-OPEC members, the most notable of which is Russia.
| Raw materials | Closed | Change, % |
|---|---|---|
| Silver | 33.717 | 6.37 |
| Gold | 272.2 | 1.07 |
| Palladium | 1080.38 | 3.55 |
- NZD/USD gains ground to around 0.6075 in Monday’s Asian session.
- The Chinese central bank reduced the 1-year Loan Prime Rate to 3.10% from 3.35%, bigger than expected.
- Expectations for a less aggressive Fed easing might support the USD.
The NZD/USD pair trades in positive territory near 0.6075 during the early Asian session on Monday. The pair edges higher amid the softer US Dollar (USD) broadly and the announcement of China rate cuts. Later on Monday, the Federal Reserve (Fed) Neel Kashkari and Jeffrey Schmid are scheduled to speak.
On Monday, the People's Bank of China (PBoC) decided to cut the one-year Loan Prime Rate (LPR) by 25 basis points (bps) from 3.35% to 3.10% and cut the five-year LPR from 3.85% to 3.60%. China’s latest move to revive growth and fight off deflation is likely to support New Zealand (NZD) as China is a major trading partner for New Zealand.
However, the rising expectation of more aggressive easing from the Reserve Bank of New Zealand (RBNZ) amid a fall in inflation to the central bank's target range of 1% to 3% in the third quarter could cap the upside for the NZD.
On the other hand, bets for a less aggressive Fed policy easing might lift the Greenback against the Kiwi. The chance of an additional quarter-point rate cut in November stands at more than 90%. Financial markets have priced in two 25 basis points (bps) interest rate cuts before the end of 2024 and further rate cuts next year, likely bringing the policy rate to a 3.25%-3.5% range by September 2025, per Reuters.
New Zealand Dollar FAQs
The New Zealand Dollar (NZD), also known as the Kiwi, is a well-known traded currency among investors. Its value is broadly determined by the health of the New Zealand economy and the country’s central bank policy. Still, there are some unique particularities that also can make NZD move. The performance of the Chinese economy tends to move the Kiwi because China is New Zealand’s biggest trading partner. Bad news for the Chinese economy likely means less New Zealand exports to the country, hitting the economy and thus its currency. Another factor moving NZD is dairy prices as the dairy industry is New Zealand’s main export. High dairy prices boost export income, contributing positively to the economy and thus to the NZD.
The Reserve Bank of New Zealand (RBNZ) aims to achieve and maintain an inflation rate between 1% and 3% over the medium term, with a focus to keep it near the 2% mid-point. To this end, the bank sets an appropriate level of interest rates. When inflation is too high, the RBNZ will increase interest rates to cool the economy, but the move will also make bond yields higher, increasing investors’ appeal to invest in the country and thus boosting NZD. On the contrary, lower interest rates tend to weaken NZD. The so-called rate differential, or how rates in New Zealand are or are expected to be compared to the ones set by the US Federal Reserve, can also play a key role in moving the NZD/USD pair.
Macroeconomic data releases in New Zealand are key to assess the state of the economy and can impact the New Zealand Dollar’s (NZD) valuation. A strong economy, based on high economic growth, low unemployment and high confidence is good for NZD. High economic growth attracts foreign investment and may encourage the Reserve Bank of New Zealand to increase interest rates, if this economic strength comes together with elevated inflation. Conversely, if economic data is weak, NZD is likely to depreciate.
The New Zealand Dollar (NZD) tends to strengthen during risk-on periods, or when investors perceive that broader market risks are low and are optimistic about growth. This tends to lead to a more favorable outlook for commodities and so-called ‘commodity currencies’ such as the Kiwi. Conversely, NZD tends to weaken at times of market turbulence or economic uncertainty as investors tend to sell higher-risk assets and flee to the more-stable safe havens.
- The Japanese Yen attracts some follow-through buying amid fears of a government intervention.
- The uncertainty over the BoJ’s rate-hike plans and the upbeat mood could cap the safe-haven JPY.
- Bets for a less aggressive Fed easing may underpin the USD and lend support to the USD/JPY pair.
The Japanese Yen (JPY) kicks off the new week on a slightly positive note against its American counterpart and looks to build on Friday's modest recovery from the vicinity of the lowest level since early August. The JPY draws some support from the recent verbal intervention from Japanese authorities, though the uncertainty over the timing and pace of further interest rate hikes by the Bank of Japan (BoJ) should cap any meaningful appreciating move.
BoJ Governor Kazuo Ueda warned on Friday about the still high uncertainty surrounding the country's recovery prospects and stressed the need to keep a close eye out for the impact of market volatility on the economy. This comes on top of Japanese Prime Minister Shigeru Ishiba's surprise opposition to additional rate hikes and suggests that the BoJ will not rush to tighten its policy further ahead of the general election in Japan on October 27.
This, along with the prevalent risk-on environment, should cap the safe-haven JPY. Meanwhile, expectations that the Federal Reserve (Fed) will proceed with modest interest rate cuts over the next year keep the US Treasury bond yields elevated and limit the US Dollar (USD) corrective decline from over a two-month high. This could further undermine the low-yielding JPY and support prospects for the emergence of dip-buying around the USD/JPY pair.
Daily Digest Market Movers: Japanese Yen draws support from intervention fears, BoJ uncertainty is likely to cap gains
- Japan's top currency diplomat, Atsushi Mimura, warned against speculative trading and said on Friday that authorities are watching FX moves with a high sense of urgency.
- Adding to this, Japan's Deputy Chief Cabinet Secretary Kazuhiko Aoki noted that it is important for currencies to move in a stable manner reflecting economic fundamentals.
- The comments fueled speculations about a possible government intervention to prop up the domestic currency and underpin the Japanese Yen at the start of a new week.
- Bank of Japan Governor Kazuo Ueda said on Friday that the economy was recovering moderately and the underlying inflation is likely to gradually accelerate to the 2% target.
- Ueda added that the central bank must focus on the economic impact of unstable markets and risks from overseas, suggesting the BoJ was in no rush to raise interest rates further.
- Investors cheered the launch of two funding schemes by the People's Bank of China (PBOC) aimed at supporting the development of capital markets, lifting global equity markets.
- The Israeli army launched a series of air strikes across Lebanon and also intensified attacks across Gaza, raising the risk of a further escalation of tensions in the Middle East.
- The yield on the benchmark 10-year US government bond holds above the 4% mark amid bets for a regular 25 basis points rate cut by the Federal Reserve in November.
- The US Dollar stalls its corrective pullback from the highest level touched since early August last Thursday, which, in turn, might act as a tailwind for the USD/JPY pair.
Technical Outlook: USD/JPY could accelerate the corrective decline once the 148.85 horizontal support is broken
From a technical perspective, oscillators on the daily chart are holding in positive territory and warrant caution before placing aggressive bearish bets. That said, weakness below the 149.00 mark and the 148.85 horizontal support could drag the USD/JPY pair further towards the 148.20 region. This is closely followed by the 148.00 round figure, below which the corrective decline could extend further towards the 147.35-147.30 area en route to sub-147.00 levels. That said,
On the flip side, the 149.70-149.75 region now seems to act as an immediate hurdle ahead of the 150.00 psychological mark and the 150.30 area, or the monthly peak touched last week. A sustained strength beyond should pave the way for a move towards the August swing high, around the 150.85-150.90 zone. Some follow-through buying will be seen as a fresh trigger for bullish traders and allow the USD/JPY pair to reclaim the 152.00 before targeting the next relevant hurdle near the 152.70-152.75 area.
Japanese Yen FAQs
The Japanese Yen (JPY) is one of the world’s most traded currencies. Its value is broadly determined by the performance of the Japanese economy, but more specifically by the Bank of Japan’s policy, the differential between Japanese and US bond yields, or risk sentiment among traders, among other factors.
One of the Bank of Japan’s mandates is currency control, so its moves are key for the Yen. The BoJ has directly intervened in currency markets sometimes, generally to lower the value of the Yen, although it refrains from doing it often due to political concerns of its main trading partners. The BoJ ultra-loose monetary policy between 2013 and 2024 caused the Yen to depreciate against its main currency peers due to an increasing policy divergence between the Bank of Japan and other main central banks. More recently, the gradually unwinding of this ultra-loose policy has given some support to the Yen.
Over the last decade, the BoJ’s stance of sticking to ultra-loose monetary policy has led to a widening policy divergence with other central banks, particularly with the US Federal Reserve. This supported a widening of the differential between the 10-year US and Japanese bonds, which favored the US Dollar against the Japanese Yen. The BoJ decision in 2024 to gradually abandon the ultra-loose policy, coupled with interest-rate cuts in other major central banks, is narrowing this differential.
The Japanese Yen is often seen as a safe-haven investment. This means that in times of market stress, investors are more likely to put their money in the Japanese currency due to its supposed reliability and stability. Turbulent times are likely to strengthen the Yen’s value against other currencies seen as more risky to invest in.
- The Australian Dollar appreciates following the PBoC’s rate cuts on Monday.
- The PBoC has reduced the 1- and 5-year Loan Prime Rate to 3.10% and 3.6%, respectively.
- The Aussie Dollar appreciated as domestic upbeat labor data has lowered the odds of the RBA’s rate cut this year.
The Australian Dollar (AUD) extended its winning streak against the US Dollar (USD) for the third consecutive session on Monday. The upside of the Aussie Dollar could be attributed to the rate cuts in China, its largest trading partner.
The People's Bank of China (PBoC) reduced the 1-year Loan Prime Rate (LPR) to 3.10% from 3.35% and the 5-year LPR to 3.6% from 3.85%, in line with expectations. Lower interest rates are anticipated to stimulate China's domestic economic activity, potentially increasing demand for Australian exports.
Australia’s upbeat employment data, released last week, has reduced the likelihood of the Reserve Bank of Australia (RBA) implementing an interest rate cut this year. This outlook has bolstered the AUD, providing continued support to the AUD/USD pair.
RBA Deputy Governor Andrew Hauser addressed the CBA 2024 Global Markets Conference in Sydney on Monday, expressing slight surprise at the strength of employment growth. Hauser noted that the labor participation rate is remarkably high and emphasized that while the RBA is data-dependent, it is not data-obsessed.
Daily Digest Market Movers: Australian Dollar appreciates due to diminishing odds of RBA rate cuts
- The US Dollar gained support as recent data highlighting the resilience of the US economy has dispelled speculation of a 50-basis-point rate cut by the Federal Reserve (Fed) in November. According to the CME FedWatch Tool, the probability of a 25-basis-point rate cut in November stands at 94.3%, with no possibility of a 50-basis-point cut.
- National Australia Bank revised its projection for the Reserve Bank of Australia (RBA) in a note last week. "We have brought forward our expectations for the timing of rate cuts, now anticipating the first cut in February 2025, instead of May," the bank stated. They continue to foresee a gradual pace of cuts, with rates expected to decrease to 3.10% by early 2026.
- On Friday, People's Bank of China (PBOC) Governor Pan Gongsheng stated that the Chinese central bank has "issued specific guidelines for stock buybacks and reloans to boost holdings, emphasizing that credit funds must not illegally flow into the stock market."
- China’s Gross Domestic Product (GDP) grew at an annual rate of 4.6% in the third quarter of 2024, slightly down from the 4.7% growth recorded in the second quarter but exceeding market expectations of 4.5%. On a quarterly basis, GDP rose by 0.9% in Q3 2024, up from 0.7% in the previous quarter but falling short of the 1.0% forecast. China’s Retail Sales in September increased by 3.2% year-over-year, outperforming both the expected 2.5% growth and the prior figure of 2.1%.
- US Retail Sales rose by 0.4% month-over-month in September, surpassing the 0.1% gain recorded in August and market expectations of a 0.3% increase. Additionally, US Initial Jobless Claims fell by 19,000 during the week ending October 11, the largest decline in three months. The total number of claims dropped to 241,000, significantly below the anticipated 260,000.
- The seasonally adjusted Employment Change in Australia surged by 64.1K in September, bringing the total employment to a record 14.52 million. This far surpassed market expectations of a 25.0K increase, following a revised rise of 42.6K in the previous month. Meanwhile, the Unemployment Rate remained steady at 4.1% in September, matching the revised figure for August and coming in lower than the anticipated 4.2%.
- Last week, Reserve Bank of Australia (RBA) Deputy Governor Sarah Hunter reiterated the central bank's commitment to curbing inflation, emphasizing that although inflation expectations remain well-anchored, ongoing price pressures continue to present significant challenges.
Technical Analysis: Australian Dollar remains above 0.6700; barrier at nine-day EMA
The AUD/USD pair trades around 0.6720 on Monday. A technical analysis of the daily chart indicates that the pair is positioned below the nine-day Exponential Moving Average (EMA), suggesting a short-term bearish bias. Additionally, the 14-day Relative Strength Index (RSI) remains below 50, confirming the prevailing bearish sentiment.
In terms of support, the immediate level to watch is the psychological barrier at 0.6700. A break below this level could exert downward pressure on the AUD/USD pair, pushing it toward the eight-week low of 0.6622, last seen on September 11.
On the upside, the AUD/USD pair may test the nine-day EMA at 0.6723, followed by the 50-day EMA at 0.6740. A break above the latter could support the pair to test the psychological level of 0.6800.
AUD/USD: Daily Chart
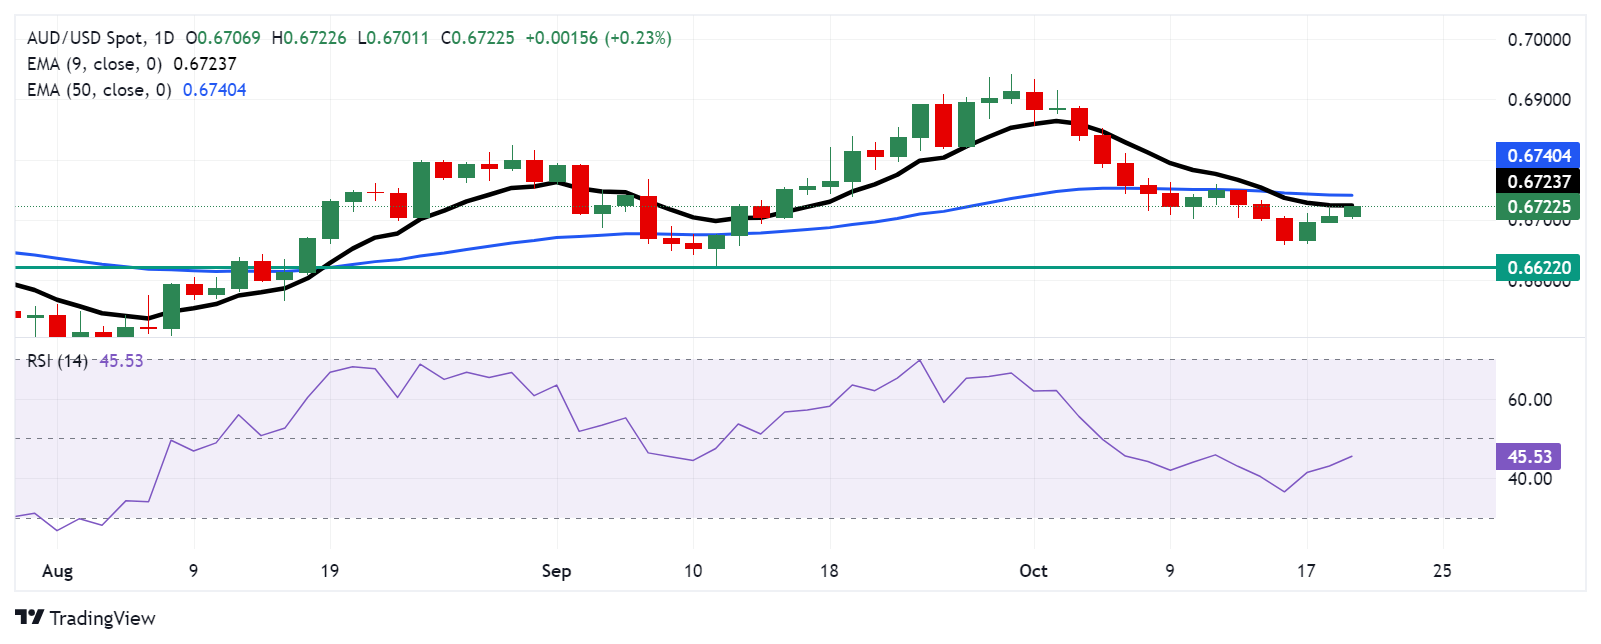
Australian Dollar PRICE Today
The table below shows the percentage change of Australian Dollar (AUD) against listed major currencies today. Australian Dollar was the strongest against the Canadian Dollar.
| USD | EUR | GBP | JPY | CAD | AUD | NZD | CHF | |
|---|---|---|---|---|---|---|---|---|
| USD | 0.00% | 0.03% | -0.21% | -0.06% | -0.21% | -0.18% | 0.08% | |
| EUR | -0.01% | -0.05% | -0.31% | -0.01% | -0.25% | -0.29% | -0.01% | |
| GBP | -0.03% | 0.05% | -0.27% | -0.08% | -0.24% | -0.20% | 0.00% | |
| JPY | 0.21% | 0.31% | 0.27% | 0.15% | 0.00% | 0.09% | 0.24% | |
| CAD | 0.06% | 0.00% | 0.08% | -0.15% | -0.25% | -0.06% | 0.00% | |
| AUD | 0.21% | 0.25% | 0.24% | -0.01% | 0.25% | 0.12% | 0.22% | |
| NZD | 0.18% | 0.29% | 0.20% | -0.09% | 0.06% | -0.12% | 0.21% | |
| CHF | -0.08% | 0.00% | -0.01% | -0.24% | -0.01% | -0.22% | -0.21% |
The heat map shows percentage changes of major currencies against each other. The base currency is picked from the left column, while the quote currency is picked from the top row. For example, if you pick the Australian Dollar from the left column and move along the horizontal line to the US Dollar, the percentage change displayed in the box will represent AUD (base)/USD (quote).
Economic Indicator
PBoC Interest Rate Decision
The People’s Bank of China’s (PBoC) Monetary Policy Committee (MPC) holds scheduled meetings on a quarterly basis. However, China’s benchmark interest rate – the loan prime rate (LPR), a pricing reference for bank lending – is fixed every month. If the PBoC forecasts high inflation (hawkish) it raises interest rates, which is bullish for the Renminbi (CNY). Likewise, if the PBoC sees inflation in the Chinese economy falling (dovish) and cuts or keeps interest rates unchanged, it is bearish for CNY. Still, China’s currency doesn’t have a floating exchange rate determined by markets and its value against the US Dollar is fixed mainly by the PBoC on a daily basis.
Read more.Last release: Mon Oct 21, 2024 01:00
Frequency: Irregular
Actual: 3.1%
Consensus: 3.15%
Previous: 3.35%
Source: The People's Bank of China
Reserve Bank of Australia (RBA) Deputy Governor Hauser spoke at the CBA 2024 Global Markets Conference in Sydney on Monday.
Key quotes
Slightly surprised employment growth has been so strong.
Labour participation rate is strikingly high.
RBA is data-dependent but not data-obsessed.
Will take into account Q3 CPI and other data to form a view on policy.
Acutely conscious that the outlook is uncertain.
Policy is ready to respond in either direction.
We are alert and ready to act.
Market reaction
At the time of writing, AUD/USD is holding higher ground near 0.6715, adding 0.13% on the day.
RBA FAQs
The Reserve Bank of Australia (RBA) sets interest rates and manages monetary policy for Australia. Decisions are made by a board of governors at 11 meetings a year and ad hoc emergency meetings as required. The RBA’s primary mandate is to maintain price stability, which means an inflation rate of 2-3%, but also “..to contribute to the stability of the currency, full employment, and the economic prosperity and welfare of the Australian people.” Its main tool for achieving this is by raising or lowering interest rates. Relatively high interest rates will strengthen the Australian Dollar (AUD) and vice versa. Other RBA tools include quantitative easing and tightening.
While inflation had always traditionally been thought of as a negative factor for currencies since it lowers the value of money in general, the opposite has actually been the case in modern times with the relaxation of cross-border capital controls. Moderately higher inflation now tends to lead central banks to put up their interest rates, which in turn has the effect of attracting more capital inflows from global investors seeking a lucrative place to keep their money. This increases demand for the local currency, which in the case of Australia is the Aussie Dollar.
Macroeconomic data gauges the health of an economy and can have an impact on the value of its currency. Investors prefer to invest their capital in economies that are safe and growing rather than precarious and shrinking. Greater capital inflows increase the aggregate demand and value of the domestic currency. Classic indicators, such as GDP, Manufacturing and Services PMIs, employment, and consumer sentiment surveys can influence AUD. A strong economy may encourage the Reserve Bank of Australia to put up interest rates, also supporting AUD.
Quantitative Easing (QE) is a tool used in extreme situations when lowering interest rates is not enough to restore the flow of credit in the economy. QE is the process by which the Reserve Bank of Australia (RBA) prints Australian Dollars (AUD) for the purpose of buying assets – usually government or corporate bonds – from financial institutions, thereby providing them with much-needed liquidity. QE usually results in a weaker AUD.
Quantitative tightening (QT) is the reverse of QE. It is undertaken after QE when an economic recovery is underway and inflation starts rising. Whilst in QE the Reserve Bank of Australia (RBA) purchases government and corporate bonds from financial institutions to provide them with liquidity, in QT the RBA stops buying more assets, and stops reinvesting the principal maturing on the bonds it already holds. It would be positive (or bullish) for the Australian Dollar.
Atlanta Federal Reserve Bank President Raphael Bostic said on Friday that he is not in a rush on rate cuts and see the case for rate reduction in the central bank's policy rate to somewhere between 3% and 3.5% by the end of next year, per Reuters.
Key quotes
"I'm not in a rush to get to neutral.”
"We must get inflation back to our 2% target; I don't want us to get to a place where inflation stalls out because we haven't been restrictive for long enough, so I'm going to be patient.”
"If the economy continues to evolve as it does — if inflation continues to fall, labor markets remain robust, and we still see positive production — we will be able to continue on the path back to neutral.”
"A recession has never been in my outlook.”
"I've always felt that there was enough momentum in this economy to absorb the restrictiveness of our policy and drive inflation back down to its 2% target. I'm grateful that that's been playing out so well. But the job is not done.”
Market reaction
The US Dollar Index (DXY) is trading 0.01% higher on the day at 103.47, as of writing.
Fed FAQs
Monetary policy in the US is shaped by the Federal Reserve (Fed). The Fed has two mandates: to achieve price stability and foster full employment. Its primary tool to achieve these goals is by adjusting interest rates. When prices are rising too quickly and inflation is above the Fed’s 2% target, it raises interest rates, increasing borrowing costs throughout the economy. This results in a stronger US Dollar (USD) as it makes the US a more attractive place for international investors to park their money. When inflation falls below 2% or the Unemployment Rate is too high, the Fed may lower interest rates to encourage borrowing, which weighs on the Greenback.
The Federal Reserve (Fed) holds eight policy meetings a year, where the Federal Open Market Committee (FOMC) assesses economic conditions and makes monetary policy decisions. The FOMC is attended by twelve Fed officials – the seven members of the Board of Governors, the president of the Federal Reserve Bank of New York, and four of the remaining eleven regional Reserve Bank presidents, who serve one-year terms on a rotating basis.
In extreme situations, the Federal Reserve may resort to a policy named Quantitative Easing (QE). QE is the process by which the Fed substantially increases the flow of credit in a stuck financial system. It is a non-standard policy measure used during crises or when inflation is extremely low. It was the Fed’s weapon of choice during the Great Financial Crisis in 2008. It involves the Fed printing more Dollars and using them to buy high grade bonds from financial institutions. QE usually weakens the US Dollar.
Quantitative tightening (QT) is the reverse process of QE, whereby the Federal Reserve stops buying bonds from financial institutions and does not reinvest the principal from the bonds it holds maturing, to purchase new bonds. It is usually positive for the value of the US Dollar.
On Monday, the People’s Bank of China (PBoC) set the USD/CNY central rate for the trading session ahead at 7.0982, as compared to Friday's fix of 7.1274 and 7.0990 Reuters estimates.
The People's Bank of China (PBoC) announced on Monday that it cut the one-year Loan Prime Rate (LPR) by 25 basis points (bps) from 3.35% to 3.10% and cut the five-year LPR from 3.85% to 3.60%.
Market reaction
At the time of writing, AUD/USD is holding higher ground near 0.6711, adding 0.07% on the day.
Australian Dollar FAQs
One of the most significant factors for the Australian Dollar (AUD) is the level of interest rates set by the Reserve Bank of Australia (RBA). Because Australia is a resource-rich country another key driver is the price of its biggest export, Iron Ore. The health of the Chinese economy, its largest trading partner, is a factor, as well as inflation in Australia, its growth rate and Trade Balance. Market sentiment – whether investors are taking on more risky assets (risk-on) or seeking safe-havens (risk-off) – is also a factor, with risk-on positive for AUD.
The Reserve Bank of Australia (RBA) influences the Australian Dollar (AUD) by setting the level of interest rates that Australian banks can lend to each other. This influences the level of interest rates in the economy as a whole. The main goal of the RBA is to maintain a stable inflation rate of 2-3% by adjusting interest rates up or down. Relatively high interest rates compared to other major central banks support the AUD, and the opposite for relatively low. The RBA can also use quantitative easing and tightening to influence credit conditions, with the former AUD-negative and the latter AUD-positive.
China is Australia’s largest trading partner so the health of the Chinese economy is a major influence on the value of the Australian Dollar (AUD). When the Chinese economy is doing well it purchases more raw materials, goods and services from Australia, lifting demand for the AUD, and pushing up its value. The opposite is the case when the Chinese economy is not growing as fast as expected. Positive or negative surprises in Chinese growth data, therefore, often have a direct impact on the Australian Dollar and its pairs.
Iron Ore is Australia’s largest export, accounting for $118 billion a year according to data from 2021, with China as its primary destination. The price of Iron Ore, therefore, can be a driver of the Australian Dollar. Generally, if the price of Iron Ore rises, AUD also goes up, as aggregate demand for the currency increases. The opposite is the case if the price of Iron Ore falls. Higher Iron Ore prices also tend to result in a greater likelihood of a positive Trade Balance for Australia, which is also positive of the AUD.
The Trade Balance, which is the difference between what a country earns from its exports versus what it pays for its imports, is another factor that can influence the value of the Australian Dollar. If Australia produces highly sought after exports, then its currency will gain in value purely from the surplus demand created from foreign buyers seeking to purchase its exports versus what it spends to purchase imports. Therefore, a positive net Trade Balance strengthens the AUD, with the opposite effect if the Trade Balance is negative.
- GBP/USD remains close to a one-month low touched last week amid a bullish USD.
- Bets for a less aggressive Fed policy easing and geopolitical risks underpin the buck.
- Expectations for a faster BoE rate-cutting cycle weigh the GBP and favor bears.
The GBP/USD pair struggles to capitalize on modest recovery gains registered over the past two days and oscillates in a narrow range, around the 1.3050-1.3045 region during the Asian session on Monday. Spot prices remain well within striking distance of a one-month low touched last Thursday and seem vulnerable to prolong the recent retracement slide from the 1.3435 area, or the highest level since March 2022.
A surprise fall in the UK Consumer Price Index (CPI) to the lowest level since April 2021 and below the Bank of England's (BoE) 2% target lifted bets for a 25 basis point (bps) interest rate cut at the November 7 meeting. Furthermore, the money markets are pricing in the possibility of another BoE rate cut in December, which might continue to undermine the British Pound (GBP). This, along with the underlying bullish sentiment surrounding the US Dollar (USD) validates the negative outlook for the GBP/USD pair.
The USD Index (DXY), which tracks the Greenback against a basket of currencies, kicks off the new week on a positive note and for now, seems to have stalled its modest pullback from its highest level since early August touched last week. Growing market conviction that the Federal Reserve (Fed) will proceed with modest rate cuts over the next year keep the US Treasury bond yields elevated and act as a tailwind for the buck. Apart from this, geopolitical risks turn out to be another factor underpinning the safe-haven USD.
In the absence of any relevant market-moving economic releases, either from the UK or the US, the aforementioned fundamental backdrop suggests that the path of least resistance for the GBP/USD pair is to the downside. Hence, any intraday move-up could be seen as a selling opportunity. Bearish traders, however, might wait for acceptance below the 1.3000 psychological mark before placing fresh bets and positioning for a slide towards the 100-day Simple Moving Average (SMA) support, currently near the 1.2960 region.
Pound Sterling FAQs
The Pound Sterling (GBP) is the oldest currency in the world (886 AD) and the official currency of the United Kingdom. It is the fourth most traded unit for foreign exchange (FX) in the world, accounting for 12% of all transactions, averaging $630 billion a day, according to 2022 data. Its key trading pairs are GBP/USD, also known as ‘Cable’, which accounts for 11% of FX, GBP/JPY, or the ‘Dragon’ as it is known by traders (3%), and EUR/GBP (2%). The Pound Sterling is issued by the Bank of England (BoE).
The single most important factor influencing the value of the Pound Sterling is monetary policy decided by the Bank of England. The BoE bases its decisions on whether it has achieved its primary goal of “price stability” – a steady inflation rate of around 2%. Its primary tool for achieving this is the adjustment of interest rates. When inflation is too high, the BoE will try to rein it in by raising interest rates, making it more expensive for people and businesses to access credit. This is generally positive for GBP, as higher interest rates make the UK a more attractive place for global investors to park their money. When inflation falls too low it is a sign economic growth is slowing. In this scenario, the BoE will consider lowering interest rates to cheapen credit so businesses will borrow more to invest in growth-generating projects.
Data releases gauge the health of the economy and can impact the value of the Pound Sterling. Indicators such as GDP, Manufacturing and Services PMIs, and employment can all influence the direction of the GBP. A strong economy is good for Sterling. Not only does it attract more foreign investment but it may encourage the BoE to put up interest rates, which will directly strengthen GBP. Otherwise, if economic data is weak, the Pound Sterling is likely to fall.
Another significant data release for the Pound Sterling is the Trade Balance. This indicator measures the difference between what a country earns from its exports and what it spends on imports over a given period. If a country produces highly sought-after exports, its currency will benefit purely from the extra demand created from foreign buyers seeking to purchase these goods. Therefore, a positive net Trade Balance strengthens a currency and vice versa for a negative balance.
- EUR/USD may face challenges due to market perception changes regarding central banks’ policy outlooks.
- The US Dollar gained ground due to the fading likelihood of an aggressive rate cut by the Fed in November.
- The ECB may accelerate its pace of policy easing to bolster growth in the Eurozone.
EUR/USD remains steady after gains in the previous session, hovering around 1.0860 during Monday's Asian trading hours. A potential downside looms as speculation about a 50-basis-point rate cut by the Federal Reserve (Fed) in November has been dispelled by recent data showing the US economy's resilience.
According to the CME FedWatch Tool, the probability of a 25-basis-point rate cut in November has risen to 99.3%, up from 89.5% a week earlier. US Retail Sales rose by 0.4% month-over-month in September, surpassing the 0.1% gain recorded in August and market expectations of a 0.3% increase. Additionally, US Initial Jobless Claims fell by 19,000 during the week ending October 11, the largest decline in three months. The total number of claims dropped to 241,000, significantly below the anticipated 260,000.
Rabobank's research suggests that the market is interpreting recent comments from European Central Bank (ECB) officials as an indication that they are increasingly comfortable with the Eurozone's inflation outlook. As a result, the ECB seems to be shifting its focus toward supporting regional growth. This has fueled speculation about a possible faster pace of ECB easing, including the potential for a larger 50-basis-point interest rate cut. Such a move could weigh on the Euro and exert downward pressure on the EUR/USD pair.
The Euro faced downward pressure following the European Central Bank's (ECB) decision to cut its interest rates by 25 basis points last week. The move is in response to a significant drop in inflation, which had surged to a high of 10.6% in October 2022 but has since fallen to 1.7% in September, now below the ECB's 2% target.
Euro FAQs
The Euro is the currency for the 19 European Union countries that belong to the Eurozone. It is the second most heavily traded currency in the world behind the US Dollar. In 2022, it accounted for 31% of all foreign exchange transactions, with an average daily turnover of over $2.2 trillion a day. EUR/USD is the most heavily traded currency pair in the world, accounting for an estimated 30% off all transactions, followed by EUR/JPY (4%), EUR/GBP (3%) and EUR/AUD (2%).
The European Central Bank (ECB) in Frankfurt, Germany, is the reserve bank for the Eurozone. The ECB sets interest rates and manages monetary policy. The ECB’s primary mandate is to maintain price stability, which means either controlling inflation or stimulating growth. Its primary tool is the raising or lowering of interest rates. Relatively high interest rates – or the expectation of higher rates – will usually benefit the Euro and vice versa. The ECB Governing Council makes monetary policy decisions at meetings held eight times a year. Decisions are made by heads of the Eurozone national banks and six permanent members, including the President of the ECB, Christine Lagarde.
Eurozone inflation data, measured by the Harmonized Index of Consumer Prices (HICP), is an important econometric for the Euro. If inflation rises more than expected, especially if above the ECB’s 2% target, it obliges the ECB to raise interest rates to bring it back under control. Relatively high interest rates compared to its counterparts will usually benefit the Euro, as it makes the region more attractive as a place for global investors to park their money.
Data releases gauge the health of the economy and can impact on the Euro. Indicators such as GDP, Manufacturing and Services PMIs, employment, and consumer sentiment surveys can all influence the direction of the single currency. A strong economy is good for the Euro. Not only does it attract more foreign investment but it may encourage the ECB to put up interest rates, which will directly strengthen the Euro. Otherwise, if economic data is weak, the Euro is likely to fall. Economic data for the four largest economies in the euro area (Germany, France, Italy and Spain) are especially significant, as they account for 75% of the Eurozone’s economy.
Another significant data release for the Euro is the Trade Balance. This indicator measures the difference between what a country earns from its exports and what it spends on imports over a given period. If a country produces highly sought after exports then its currency will gain in value purely from the extra demand created from foreign buyers seeking to purchase these goods. Therefore, a positive net Trade Balance strengthens a currency and vice versa for a negative balance.
The Israeli army launched a series of new air strikes across Lebanon, including Beirut’s suburbs, after it announced the targeting of Hezbollah’s al-Qard al-Hassan financial institution’s offices, per the local news agency Aljazeera.
Lebanon's National News Agency reported that Israeli warplanes carried out at least nine attacks in an hour, targeting the association's branches in Hayy al Sellum, Borj al Barajneh, and Ghobeiry in the southern suburb of Beirut.
Market reaction
At the time of press, the XAU/USD pair was up 0.09% on the day at $2,722.
Gold FAQs
Gold has played a key role in human’s history as it has been widely used as a store of value and medium of exchange. Currently, apart from its shine and usage for jewelry, the precious metal is widely seen as a safe-haven asset, meaning that it is considered a good investment during turbulent times. Gold is also widely seen as a hedge against inflation and against depreciating currencies as it doesn’t rely on any specific issuer or government.
Central banks are the biggest Gold holders. In their aim to support their currencies in turbulent times, central banks tend to diversify their reserves and buy Gold to improve the perceived strength of the economy and the currency. High Gold reserves can be a source of trust for a country’s solvency. Central banks added 1,136 tonnes of Gold worth around $70 billion to their reserves in 2022, according to data from the World Gold Council. This is the highest yearly purchase since records began. Central banks from emerging economies such as China, India and Turkey are quickly increasing their Gold reserves.
Gold has an inverse correlation with the US Dollar and US Treasuries, which are both major reserve and safe-haven assets. When the Dollar depreciates, Gold tends to rise, enabling investors and central banks to diversify their assets in turbulent times. Gold is also inversely correlated with risk assets. A rally in the stock market tends to weaken Gold price, while sell-offs in riskier markets tend to favor the precious metal.
The price can move due to a wide range of factors. Geopolitical instability or fears of a deep recession can quickly make Gold price escalate due to its safe-haven status. As a yield-less asset, Gold tends to rise with lower interest rates, while higher cost of money usually weighs down on the yellow metal. Still, most moves depend on how the US Dollar (USD) behaves as the asset is priced in dollars (XAU/USD). A strong Dollar tends to keep the price of Gold controlled, whereas a weaker Dollar is likely to push Gold prices up.
| Index | Change, points | Closed | Change, % |
|---|---|---|---|
| NIKKEI 225 | 70.56 | 38981.75 | 0.18 |
| Hang Seng | 725.01 | 20804.11 | 3.61 |
| KOSPI | -15.48 | 2593.82 | -0.59 |
| ASX 200 | -72.7 | 8283.2 | -0.87 |
| DAX | 73.98 | 19657.37 | 0.38 |
| CAC 40 | 29.32 | 7613.05 | 0.39 |
| Dow Jones | 36.86 | 43275.91 | 0.09 |
| S&P 500 | 23.2 | 5864.67 | 0.4 |
| NASDAQ Composite | 115.94 | 18489.55 | 0.63 |
| Pare | Closed | Change, % |
|---|---|---|
| AUDUSD | 0.67052 | 0.13 |
| EURJPY | 162.481 | -0.12 |
| EURUSD | 1.08668 | 0.32 |
| GBPJPY | 195.095 | -0.16 |
| GBPUSD | 1.30479 | 0.27 |
| NZDUSD | 0.60707 | 0.2 |
| USDCAD | 1.38027 | 0.06 |
| USDCHF | 0.86471 | -0.13 |
| USDJPY | 149.52 | -0.43 |
The European Central Bank (ECB) Governing Council member Francois Villeroy de Galhau said on Saturday that the Euro-area consumer-price growth probably will be at the ECB’s 2% target in early 2025, per Bloomberg.
Key quotes
“We’re on a good way to defeat inflation and this is actually good news.”
“There may be some temporary rebounds in coming months, but that’s a technical effect. Baring large external shocks, we’ll be a 2% of inflation next year, probably rather toward the beginning of next year.”
“There will probably be other rate cuts.”
Market reaction
At the time of press, the EUR/USD pair was up 0.02% on the day at 1.0868.
ECB FAQs
The European Central Bank (ECB) in Frankfurt, Germany, is the reserve bank for the Eurozone. The ECB sets interest rates and manages monetary policy for the region. The ECB primary mandate is to maintain price stability, which means keeping inflation at around 2%. Its primary tool for achieving this is by raising or lowering interest rates. Relatively high interest rates will usually result in a stronger Euro and vice versa. The ECB Governing Council makes monetary policy decisions at meetings held eight times a year. Decisions are made by heads of the Eurozone national banks and six permanent members, including the President of the ECB, Christine Lagarde.
In extreme situations, the European Central Bank can enact a policy tool called Quantitative Easing. QE is the process by which the ECB prints Euros and uses them to buy assets – usually government or corporate bonds – from banks and other financial institutions. QE usually results in a weaker Euro. QE is a last resort when simply lowering interest rates is unlikely to achieve the objective of price stability. The ECB used it during the Great Financial Crisis in 2009-11, in 2015 when inflation remained stubbornly low, as well as during the covid pandemic.
Quantitative tightening (QT) is the reverse of QE. It is undertaken after QE when an economic recovery is underway and inflation starts rising. Whilst in QE the European Central Bank (ECB) purchases government and corporate bonds from financial institutions to provide them with liquidity, in QT the ECB stops buying more bonds, and stops reinvesting the principal maturing on the bonds it already holds. It is usually positive (or bullish) for the Euro.
- Gold price gains momentum to near $2,720 in Monday’s early Asian session.
- Uncertainty surrounding the US election and geopolitical risks prompted higher demand for safe-haven assets like Gold.
- The fear of a Chinese economic slowdown could weigh on the XAU/USD.
The Gold price (XAU/USD) extends its upside to around $2,720 during the early Asian session on Monday. The uncertainty surrounding tensions in the Middle East and the US presidential election boosts the safe haven flows.
The uptick in the precious metal is bolstered by ongoing geopolitical tensions in the Middle East, uncertainties around the US elections and easing monetary policy expectations from the US Federal Reserve (Fed). "With the conflict intensifying – particularly following Hezbollah's announcement to escalate the war with Israel – investors are flocking to gold, a traditional safe-haven asset," noted Alexander Zumpfe, a precious metals trader at Heraeus Metals Germany. "Adding to the momentum, concerns around the U.S. presidential election and anticipation of looser monetary policies have further fuelled the rally," Zumpfe added.
Furthermore, the prospects of further Fed rate cuts continue to underpin the Gold price. The US central bank lowered its interest rates for the first time in more than four years in the September meeting. According to the CME FedWatch Tool, the odds of an additional quarter-point rate cut in November stand at more than 90%. Lower interest rates generally reduce the opportunity cost of holding non-yielding bullion, lifting the Gold price.
On the other hand, China’s sluggish economy could undermine the precious metal. China's economy grew in the third quarter (Q3) at the slowest pace since early last year. The National Bureau of Statistics reported on Friday that the GDP expanded 4.6% YoY in Q3 versus 4.7% prior. This figure was below the government's "around 5%" target for this year. This, in turn, might weigh on the yellow metal as China is the world's largest gold consumer.
Gold FAQs
Gold has played a key role in human’s history as it has been widely used as a store of value and medium of exchange. Currently, apart from its shine and usage for jewelry, the precious metal is widely seen as a safe-haven asset, meaning that it is considered a good investment during turbulent times. Gold is also widely seen as a hedge against inflation and against depreciating currencies as it doesn’t rely on any specific issuer or government.
Central banks are the biggest Gold holders. In their aim to support their currencies in turbulent times, central banks tend to diversify their reserves and buy Gold to improve the perceived strength of the economy and the currency. High Gold reserves can be a source of trust for a country’s solvency. Central banks added 1,136 tonnes of Gold worth around $70 billion to their reserves in 2022, according to data from the World Gold Council. This is the highest yearly purchase since records began. Central banks from emerging economies such as China, India and Turkey are quickly increasing their Gold reserves.
Gold has an inverse correlation with the US Dollar and US Treasuries, which are both major reserve and safe-haven assets. When the Dollar depreciates, Gold tends to rise, enabling investors and central banks to diversify their assets in turbulent times. Gold is also inversely correlated with risk assets. A rally in the stock market tends to weaken Gold price, while sell-offs in riskier markets tend to favor the precious metal.
The price can move due to a wide range of factors. Geopolitical instability or fears of a deep recession can quickly make Gold price escalate due to its safe-haven status. As a yield-less asset, Gold tends to rise with lower interest rates, while higher cost of money usually weighs down on the yellow metal. Still, most moves depend on how the US Dollar (USD) behaves as the asset is priced in dollars (XAU/USD). A strong Dollar tends to keep the price of Gold controlled, whereas a weaker Dollar is likely to push Gold prices up.


© 2000-2026. All rights reserved.
This site is managed by Teletrade D.J. LLC 2351 LLC 2022 (Euro House, Richmond Hill Road, Kingstown, VC0100, St. Vincent and the Grenadines).
The information on this website is for informational purposes only and does not constitute any investment advice.
The company does not serve or provide services to customers who are residents of the US, Canada, Iran, The Democratic People's Republic of Korea, Yemen and FATF blacklisted countries.
Making transactions on financial markets with marginal financial instruments opens up wide possibilities and allows investors who are willing to take risks to earn high profits, carrying a potentially high risk of losses at the same time. Therefore you should responsibly approach the issue of choosing the appropriate investment strategy, taking the available resources into account, before starting trading.
Use of the information: full or partial use of materials from this website must always be referenced to TeleTrade as the source of information. Use of the materials on the Internet must be accompanied by a hyperlink to teletrade.org. Automatic import of materials and information from this website is prohibited.
Please contact our PR department if you have any questions or need assistance at pr@teletrade.global.
transfers