- Analytics
- News and Tools
- Market News
Analytics, News, and Forecasts for CFD Markets: stock news — 05-05-2020.
The Institute for Supply Management (ISM) reported on Tuesday its non-manufacturing index (NMI) came in at 41.8 in April, which was 10.7 percentage points lower than the March reading of 52.2 percent. The April reading pointed to the first contraction in the services sector since December 2009 and the steepest decline since March 2009.
A reading above 50 signals expansion, while a reading below 50 indicates contraction.
Of the 18 manufacturing industries, 16 reported decreases last month, the ISM said, adding that respondents were concerned about the continuing coronavirus impacts on the supply chain, operational capacity, human resources and finances, as well as the uncertain timelines for the resumption of business and a return to normality.
According to the report, the ISM's non-manufacturing business activity measure fell to its record low of 26 percent, 22 percentage points lower than the March reading. The new orders gauge came in at 39.2 percent, 20 percentage points below February's reading. The Employment Index fell by 17 percentage points to 30 percent from the February reading. The Prices Index of 50 percent was 0.8 percentage point lower than the February reading of 50.8 percent, indicating that prices were unchanged in March. Meanwhile, the Supplier Deliveries Index registered an all-time high of 78.3 percent, up 16.2 percentage points from the March reading, limiting the drop in the composite NMI
Commenting on the data, the Chair of the ISM Non-Manufacturing Business Survey Committee, Anthony Nieves, noted, "The past relationship between the NMI and the overall economy indicates that the NMI for April (41.8 percent) corresponds to a 2.3-percent decrease in real gross domestic product (GDP) on an annualized basis."
U.S. stock-index futures rose on Tuesday, as oil prices demonstrated recovery and major economies around the world began reopening.
Global Stocks:
| Index/commodity | Last | Today's Change, points | Today's Change, % |
| Nikkei | - | - | - |
| Hang Seng | 23,868.66 | +254.86 | +1.08% |
| Shanghai | - | - | - |
| S&P/ASX | 5,407.10 | +87.30 | +1.64% |
| FTSE | 5,849.42 | +95.64 | +1.66% |
| CAC | 4,461.47 | +83.24 | +1.90% |
| DAX | 10,637.52 | +170.72 | +1.63% |
| Crude oil | $23.12 | | +13.39% |
| Gold | $1,700.20 | | -0.76% |
FXStreet reports that analysts at Credit Suisse apprise that the S&P 500 has again managed to hold support on a closing basis from its rising 13-day average, currently seen at 2831.
"Near-term, we see scope for a rebound to test resistance from the price gap seen Friday, seen starting at 2869 and stretching up to 2912."
"With the 63-day average also in this zone at 2874 and with the rally having essentially been capped as expected at the 61.8% retracement of the Q1 collapse at 2934, we continue to look for this to cap to add weight to our topping scenario."
"A close below the aforementioned 13-day average at 2831 is needed to add weight to this view with support then seen next at 2798, then 2776/75 - the 23.6% retracement of the entire March/April recovery. At the end of the day though, below 2733/27 remains needed to mark a more important top."
(company / ticker / price / change ($/%) / volume)
| 3M Co | MMM | 149.8 | 1.40(0.94%) | 2643 |
| ALCOA INC. | AA | 8.04 | 0.24(3.08%) | 49703 |
| ALTRIA GROUP INC. | MO | 38.49 | 0.48(1.26%) | 8030 |
| Amazon.com Inc., NASDAQ | AMZN | 2,331.00 | 15.01(0.65%) | 37186 |
| American Express Co | AXP | 88.65 | 2.27(2.63%) | 24078 |
| AMERICAN INTERNATIONAL GROUP | AIG | 25.65 | 1.58(6.56%) | 17147 |
| Apple Inc. | AAPL | 295.75 | 2.59(0.88%) | 247012 |
| AT&T Inc | T | 29.92 | 0.32(1.08%) | 78347 |
| Boeing Co | BA | 133.7 | 2.24(1.70%) | 332806 |
| Caterpillar Inc | CAT | 109.3 | 1.58(1.47%) | 160937 |
| Chevron Corp | CVX | 94.5 | 3.06(3.35%) | 67154 |
| Cisco Systems Inc | CSCO | 41.7 | 0.35(0.85%) | 25539 |
| Citigroup Inc., NYSE | C | 46.38 | 1.26(2.79%) | 81108 |
| Deere & Company, NYSE | DE | 135.78 | 2.84(2.14%) | 502 |
| E. I. du Pont de Nemours and Co | DD | 45.6 | 0.88(1.97%) | 35738 |
| Exxon Mobil Corp | XOM | 46.34 | 1.46(3.25%) | 192047 |
| Facebook, Inc. | FB | 207.55 | 2.29(1.12%) | 93571 |
| FedEx Corporation, NYSE | FDX | 117.98 | 2.13(1.84%) | 2193 |
| Ford Motor Co. | F | 4.98 | 0.12(2.47%) | 813116 |
| Freeport-McMoRan Copper & Gold Inc., NYSE | FCX | 8.9 | 0.20(2.30%) | 36474 |
| General Electric Co | GE | 6.29 | 0.08(1.29%) | 1271628 |
| General Motors Company, NYSE | GM | 21.2 | 0.45(2.17%) | 31432 |
| Goldman Sachs | GS | 178.72 | 2.69(1.53%) | 11737 |
| Google Inc. | GOOG | 1,341.00 | 14.20(1.07%) | 7507 |
| Hewlett-Packard Co. | HPQ | 15.15 | 0.25(1.68%) | 2456 |
| Home Depot Inc | HD | 223.64 | 1.80(0.81%) | 9621 |
| HONEYWELL INTERNATIONAL INC. | HON | 138.21 | 3.01(2.22%) | 1026 |
| Intel Corp | INTC | 58.8 | 0.81(1.40%) | 44455 |
| International Business Machines Co... | IBM | 123.98 | 2.30(1.89%) | 18818 |
| International Paper Company | IP | 34 | 0.63(1.89%) | 11027 |
| Johnson & Johnson | JNJ | 148.62 | 0.35(0.24%) | 149818 |
| JPMorgan Chase and Co | JPM | 94 | 1.86(2.02%) | 65886 |
| McDonald's Corp | MCD | 183.24 | 1.37(0.75%) | 6929 |
| Merck & Co Inc | MRK | 77.4 | 0.54(0.70%) | 9770 |
| Microsoft Corp | MSFT | 181.3 | 2.46(1.38%) | 377642 |
| Nike | NKE | 86.6 | 0.85(0.99%) | 49789 |
| Pfizer Inc | PFE | 38.35 | 0.73(1.94%) | 291005 |
| Procter & Gamble Co | PG | 116.37 | 0.60(0.52%) | 5826 |
| Starbucks Corporation, NASDAQ | SBUX | 74.67 | 2.78(3.87%) | 70363 |
| Tesla Motors, Inc., NASDAQ | TSLA | 782.75 | 21.56(2.83%) | 309068 |
| The Coca-Cola Co | KO | 45.45 | 0.31(0.69%) | 49373 |
| Travelers Companies Inc | TRV | 97.44 | 0.53(0.55%) | 1339 |
| Twitter, Inc., NYSE | TWTR | 28.65 | 0.42(1.49%) | 121619 |
| UnitedHealth Group Inc | UNH | 289.48 | 1.94(0.67%) | 2036 |
| Verizon Communications Inc | VZ | 56.6 | 0.36(0.64%) | 32410 |
| Visa | V | 178.4 | 2.25(1.28%) | 42835 |
| Wal-Mart Stores Inc | WMT | 123.66 | -0.04(-0.03%) | 15163 |
| Walt Disney Co | DIS | 102.48 | -0.70(-0.68%) | 173904 |
| Yandex N.V., NASDAQ | YNDX | 38.4 | 0.40(1.05%) | 2116 |
The U.S. Commerce Department reported on Tuesday that U.S. the goods and services trade deficit widened to $44.4 billion in March from a revised $39.8 billion in the previous month (originally a gap of $39.9 billion).
Economists had expected a deficit of $44.0 billion.
According to the report, the March advance in the goods and services deficit reflected an increase in the goods deficit of $4.6 billion to $65.6 billion and a decline in the services surplus of $0.1 billion to $21.2 billion.
Exports of goods and services from the U.S. fell 9.6 percent m-o-m to $187.7 billion in March, while imports dropped 6.2 percent m-o-m to $232.2 billion, in part, due to the impact of COVID-19, as many businesses were operating at limited capacity or ceased operations completely, and the movement of travelers across borders was restricted.
Year-to-date, the goods and services deficit tumbled 17.8 percent from the same period in 2019. Exports decreased 3.5 percent, while imports dropped 6.4 percent.
Fiat Chrysler (FCAU) reported Q1 FY 2020 loss of EUR0.30 per share (versus earnings of EUR0.36 per share in Q1 FY 2019), worse than analysts' consensus estimate of earnings of EUR0.05 per share.
The company's quarterly revenues amounted to EUR20.567 bln (-16.0% y/y), missing analysts' consensus estimate of EUR21.121 bln.
FCAU rose to $8.37 (+0.84%) in pre-market trading.

FXStreet reports that according to Liz Ann Sonders from Charles Schwab, the ‘dumb money’ and the ‘smart money’ are beginning to converge and would represent a risk if they continue to reach opposite extremes again.
“The stock market’s rally has been fueled by Fed-provided liquidity, but the 62% retracement between March 23 and April 29 suggests stocks were pricing in a V-shaped recovery in the economy. That is unlikely.”
“In contrast to the more bullish outlook being expressed by the ‘dumb money’ and the still fairly bullish positioning of the ‘smart money,’ investor sentiment in opinion surveys is significantly more subdued.”
“From an investor perspective, unlike consumer confidence vs. consumer spending, investors are saying they’re more bearish, but acting more bullish.”
“The percentage of S&P 500 stocks trading above their 200-day moving average remains extremely low at only 20%. That is significantly lower than 70-80% at this point last year (when the S&P was at about the same level as today).”
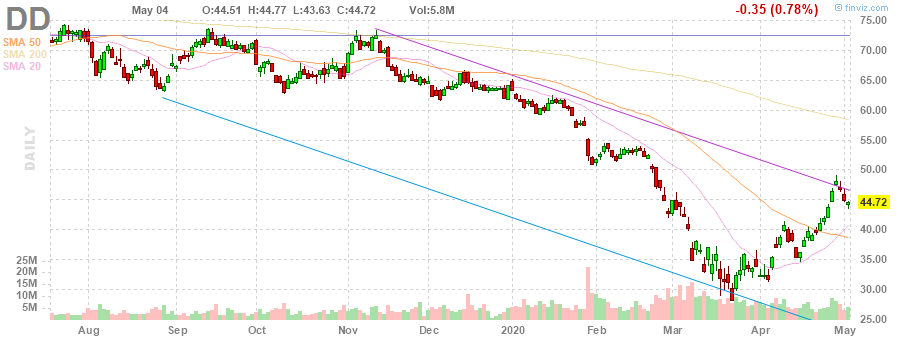
DuPont (DD) reported Q1 FY 2020 earnings of $0.84 per share, beating analysts' consensus estimate of $0.77 per share.
The company's quarterly revenues amounted to $5.221 bln (-3.6% y/y), beating analysts' consensus estimate of $5.143 bln.
DD rose to $45.15 (+0.96%) in pre-market trading.
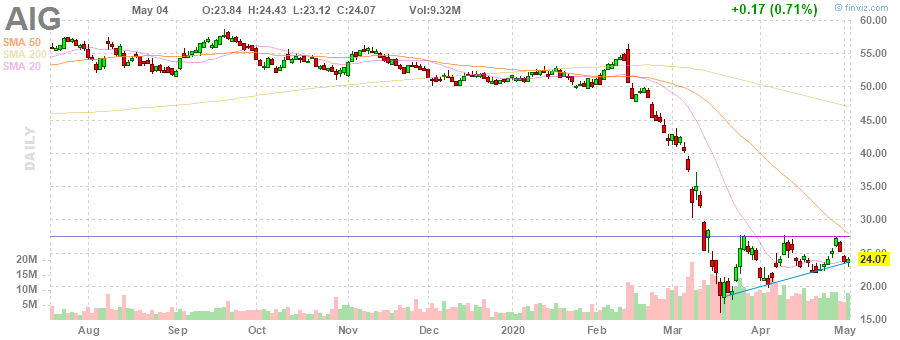
American Intl (AIG) reported Q1 FY 2020 earnings of $0.11 per share (versus $1.58 per share in Q1 FY 2019), missing analysts' consensus estimate of $0.82 per share.
The company withdrew its previously issued guidance as the COVID-19 crisis had created significant uncertainty, and it would take time to understand its broader ramifications.
AIG closed Monday's trading session at $24.07 (+0.71%).
| Index | Change, points | Closed | Change, % |
|---|---|---|---|
| Hang Seng | -1029.79 | 23613.8 | -4.18 |
| KOSPI | -52.19 | 1895.37 | -2.68 |
| ASX 200 | 73.9 | 5319.8 | 1.41 |
| FTSE 100 | -9.28 | 5753.78 | -0.16 |
| DAX | -394.84 | 10466.8 | -3.64 |
| CAC 40 | -193.95 | 4378.23 | -4.24 |
| Dow Jones | 26.07 | 23749.76 | 0.11 |
| S&P 500 | 12.03 | 2842.74 | 0.42 |
| NASDAQ Composite | 104.82 | 8709.77 | 1.22 |


© 2000-2026. All rights reserved.
This site is managed by Teletrade D.J. LLC 2351 LLC 2022 (Euro House, Richmond Hill Road, Kingstown, VC0100, St. Vincent and the Grenadines).
The information on this website is for informational purposes only and does not constitute any investment advice.
The company does not serve or provide services to customers who are residents of the US, Canada, Iran, The Democratic People's Republic of Korea, Yemen and FATF blacklisted countries.
Making transactions on financial markets with marginal financial instruments opens up wide possibilities and allows investors who are willing to take risks to earn high profits, carrying a potentially high risk of losses at the same time. Therefore you should responsibly approach the issue of choosing the appropriate investment strategy, taking the available resources into account, before starting trading.
Use of the information: full or partial use of materials from this website must always be referenced to TeleTrade as the source of information. Use of the materials on the Internet must be accompanied by a hyperlink to teletrade.org. Automatic import of materials and information from this website is prohibited.
Please contact our PR department if you have any questions or need assistance at pr@teletrade.global.
transfers