- Analytics
- News and Tools
- Market News
Analytics, News, and Forecasts for CFD Markets: stock news — 14-04-2020.
FXStreet notes that with the equity market having hit its last new high on February 19th of this year, the depth and speed of the market drop have been ferocious. Investors are getting increasingly used to market volatility reflecting the massive amount of uncertainty in light of COVID-19, per JP Morgan Asset Management.
"On average, the stock market bottoms around 1.5 months before the peak in jobless claims and 4.5 months before the end of the recession."
"Market timing is always excruciatingly difficult, and trying to gauge when markets will bottom in this environment is no exception. Given this, even if it takes 5 years to recover to the market peak, the average annual return over that period would be 7%. If the market recovers faster, say in 3 years, that implies a 10% average annual return."
"We are in unprecedented times and with volatility expected to be elevated over the short-term, investors should be positioned with a high-quality bias throughout portfolios. Looking ahead, regardless of how long it takes, returns during the rebound are likely to be strong."
U.S. stock-index futures rose on Tuesday as investors grew more optimistic about the coronavirus outlook amid signs that some countries were preparing to ease coronavirus restrictions, even as the first batch of Q1 earnings reports underlined the negative impact of the virus outbreak on the companies' results/guidance.
Global Stocks:
| Index/commodity | Last | Today's Change, points | Today's Change, % |
| Nikkei | 19,638.81 | +595.41 | +3.13% |
| Hang Seng | 24,435.40 | +135.07 | +0.56% |
| Shanghai | 2,827.28 | +44.24 | +1.59% |
| S&P/ASX | 5,488.10 | +100.80 | +1.87% |
| FTSE | 5,804.40 | -38.26 | -0.65% |
| CAC | 4,524.21 | +17.36 | +0.39% |
| DAX | 10,687.63 | +122.89 | +1.16% |
| Crude oil | $21.39 | | -4.55% |
| Gold | $1,769.40 | | +0.45% |
(company / ticker / price / change ($/%) / volume)
| 3M Co | MMM | 148.5 | 2.10(1.43%) | 10107 |
| ALCOA INC. | AA | 7.82 | 0.27(3.58%) | 58386 |
| ALTRIA GROUP INC. | MO | 40.75 | 0.31(0.77%) | 8835 |
| Amazon.com Inc., NASDAQ | AMZN | 2,209.40 | 40.53(1.87%) | 128561 |
| American Express Co | AXP | 92.26 | 1.93(2.14%) | 16873 |
| AMERICAN INTERNATIONAL GROUP | AIG | 26.85 | 1.22(4.76%) | 12143 |
| Apple Inc. | AAPL | 279.06 | 5.81(2.13%) | 555395 |
| AT&T Inc | T | 30.62 | 0.43(1.42%) | 75916 |
| Boeing Co | BA | 151.67 | 4.34(2.95%) | 438040 |
| Caterpillar Inc | CAT | 115.33 | 1.19(1.04%) | 28028 |
| Chevron Corp | CVX | 84.5 | -0.41(-0.48%) | 64626 |
| Cisco Systems Inc | CSCO | 42.01 | 0.79(1.92%) | 263692 |
| Citigroup Inc., NYSE | C | 47.85 | 1.17(2.51%) | 285536 |
| Deere & Company, NYSE | DE | 140.59 | 0.79(0.57%) | 1690 |
| E. I. du Pont de Nemours and Co | DD | 38.9 | 0.58(1.51%) | 2194 |
| Exxon Mobil Corp | XOM | 43 | 0.24(0.56%) | 210726 |
| Facebook, Inc. | FB | 178.88 | 4.09(2.34%) | 139237 |
| FedEx Corporation, NYSE | FDX | 125.9 | 2.37(1.92%) | 4988 |
| Ford Motor Co. | F | 5.32 | 0.16(3.10%) | 559732 |
| Freeport-McMoRan Copper & Gold Inc., NYSE | FCX | 8.5 | 0.20(2.41%) | 62161 |
| General Electric Co | GE | 7.14 | 0.12(1.71%) | 1256127 |
| General Motors Company, NYSE | GM | 23.52 | 0.51(2.22%) | 13564 |
| Goldman Sachs | GS | 182.25 | 3.07(1.71%) | 16638 |
| Google Inc. | GOOG | 1,250.00 | 32.44(2.66%) | 30210 |
| Hewlett-Packard Co. | HPQ | 15.86 | 0.32(2.06%) | 15691 |
| Home Depot Inc | HD | 203.5 | 4.71(2.37%) | 17126 |
| HONEYWELL INTERNATIONAL INC. | HON | 141 | 3.06(2.22%) | 2063 |
| Intel Corp | INTC | 59.77 | 1.07(1.82%) | 169767 |
| International Business Machines Co... | IBM | 123.43 | 2.28(1.88%) | 10218 |
| International Paper Company | IP | 34.94 | 0.53(1.54%) | 225 |
| Johnson & Johnson | JNJ | 144.62 | 4.85(3.47%) | 187427 |
| JPMorgan Chase and Co | JPM | 99.71 | 1.52(1.55%) | 661480 |
| McDonald's Corp | MCD | 183.22 | 3.10(1.72%) | 13629 |
| Merck & Co Inc | MRK | 81.5 | 0.96(1.19%) | 8148 |
| Microsoft Corp | MSFT | 168.96 | 3.45(2.08%) | 626048 |
| Nike | NKE | 85.8 | 1.34(1.59%) | 167445 |
| Pfizer Inc | PFE | 35.75 | 0.61(1.74%) | 44005 |
| Procter & Gamble Co | PG | 116.5 | 0.55(0.47%) | 16465 |
| Starbucks Corporation, NASDAQ | SBUX | 73.65 | 1.89(2.63%) | 82872 |
| Tesla Motors, Inc., NASDAQ | TSLA | 701.4 | 50.45(7.75%) | 796117 |
| The Coca-Cola Co | KO | 48.05 | 1.12(2.39%) | 82195 |
| Twitter, Inc., NYSE | TWTR | 27.99 | 0.78(2.87%) | 181589 |
| UnitedHealth Group Inc | UNH | 268 | 4.49(1.70%) | 6996 |
| Verizon Communications Inc | VZ | 57.23 | 0.56(0.99%) | 18445 |
| Visa | V | 174.47 | 5.48(3.24%) | 54761 |
| Wal-Mart Stores Inc | WMT | 125.87 | 0.57(0.45%) | 26963 |
| Walt Disney Co | DIS | 106.5 | 3.00(2.90%) | 336454 |
| Yandex N.V., NASDAQ | YNDX | 36.87 | 0.17(0.46%) | 9208 |
Tesla (TSLA) upgraded to Neutral from Underperform at Credit Suisse; target raised to $580
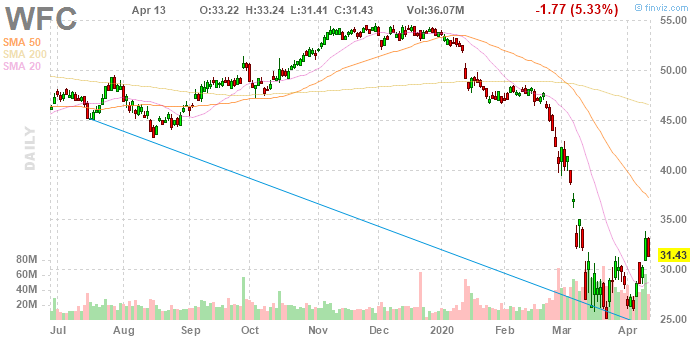
Wells Fargo (WFC) reported Q1 FY 2020 earnings of $0.01 per share (versus $1.20 per share in Q1 FY 2019), missing analysts' consensus estimate of $0.62 per share.
The company's quarterly revenues amounted to $17.717 bln (-18.0% y/y), missing analysts' consensus estimate of $19.398 bln.
The company noted it included the impact of a reserve build of $3.1 bln, or -$0.56 per share, and an impairment of securities of $950 mln, or -$0.17 per share, driven by economic and market conditions. EPS was also reduced by $0.06 due to the redemption of Series K preferred stock. Without these items, EPS would have been $0.80.
WFC rose to $32.16 (+2.32%) in pre-market trading.
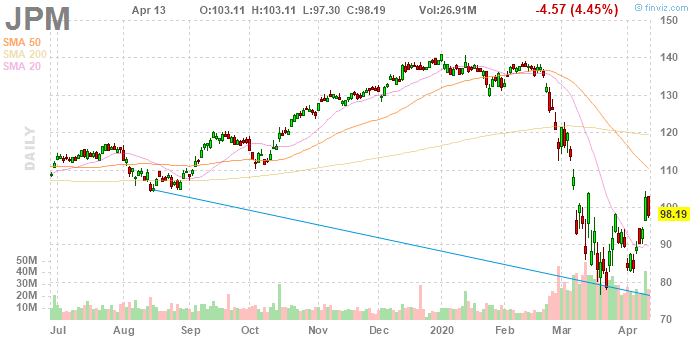
JPMorgan Chase (JPM) reported Q1 FY 2020 earnings of $0.78 per share (versus $2.65 per share in Q1 FY 2019), missing analysts' consensus estimate of $2.20 per share.
The company's quarterly revenues amounted to $28.251 bln (-3.0% y/y), missing analysts' consensus estimate of $29.453 bln.
The company noted the provision for credit losses was $8.3 bln, up $6.8 bln from the prior year, driven by reserve builds which reflect deterioration in the macro-economic environment as a result of the impact of COVID-19 and continued pressure on oil prices.
JPM rose to $98.70 (+0.52%) in pre-market trading.
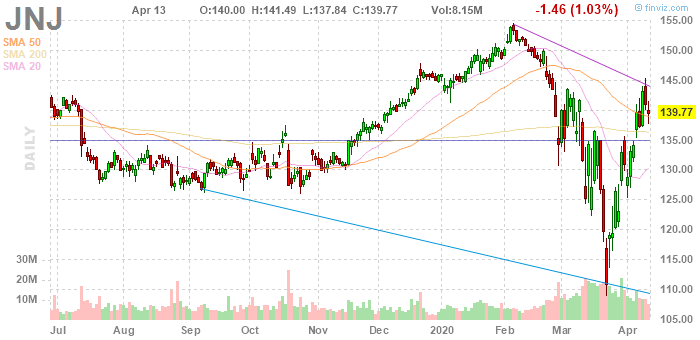
Johnson & Johnson (JNJ) reported Q1 FY 2020 earnings of $2.30 per share (versus $2.10 per share in Q1 FY 2019), beating analysts' consensus estimate of $2.00 per share.
The company's quarterly revenues amounted to $20.691 bln (+3.3% y/y), beating analysts' consensus estimate of $19.476 bln.
The company also issued lowered guidance for FY 2020, projecting EPS of $7.50-7.90 (down from $8.95-9.15 previously) versus analysts' consensus estimate of $8.08 and revenues of $79.2-82.2 bln (down from $85.8-86.6 bln previously) versus analysts' consensus estimate of $79.54 bln.
JNJ rose to $144.00 (+3.03 %) in pre-market trading.
FXStreet reports that analysts at Westpac Institutional Bank underscore the large disconnect between the U.S. GDP growth expectations and US equities.
“The latest consensus median estimate for Q2 GDP (sourced from Bloomberg) is for a 25% qoq annualised decline, though the tail includes a handful of forecasters expecting an epic 40% to 60% qoq annualised contraction. Consensus expects a ‘muted’ 7.2% increase in Q3 GDP and 5.7% in Q4.”
“With GDP expected to decline at least as much as 2008/09 S&P500 earnings per share could understandably be down anywhere from 40% to 60% on levels a year ago.”
“On the S&P 500 forward PE ratio vs GDP growth metric, the one-year ahead expected PE (currently 14.4) can be expected to be down 4-6 points vs year ago levels. At a minimum, these metrics should cap upside potential for US stocks.”
“It would not be unprecedented going forward if stocks decoupled from less disrupted funding and credit markets. While funding and credit markets were anything but ‘normal’ in early 2009 spreads nevertheless had returned to pre-crisis levels then, thanks to central bank intervention. Yet equities continued to fall.”
| Index | Change, points | Closed | Change, % |
|---|---|---|---|
| NIKKEI 225 | -455.1 | 19043.4 | -2.33 |
| KOSPI | -34.94 | 1825.76 | -1.88 |
| Dow Jones | -328.6 | 23390.77 | -1.39 |
| S&P 500 | -28.19 | 2761.63 | -1.01 |
| NASDAQ Composite | 38.84 | 8192.42 | 0.48 |


© 2000-2026. All rights reserved.
This site is managed by Teletrade D.J. LLC 2351 LLC 2022 (Euro House, Richmond Hill Road, Kingstown, VC0100, St. Vincent and the Grenadines).
The information on this website is for informational purposes only and does not constitute any investment advice.
The company does not serve or provide services to customers who are residents of the US, Canada, Iran, The Democratic People's Republic of Korea, Yemen and FATF blacklisted countries.
Making transactions on financial markets with marginal financial instruments opens up wide possibilities and allows investors who are willing to take risks to earn high profits, carrying a potentially high risk of losses at the same time. Therefore you should responsibly approach the issue of choosing the appropriate investment strategy, taking the available resources into account, before starting trading.
Use of the information: full or partial use of materials from this website must always be referenced to TeleTrade as the source of information. Use of the materials on the Internet must be accompanied by a hyperlink to teletrade.org. Automatic import of materials and information from this website is prohibited.
Please contact our PR department if you have any questions or need assistance at pr@teletrade.global.
transfers