- TeleTrade
- Сooperation
- News
- Forex Charting the Easy Way
Forex Charting the Easy Way
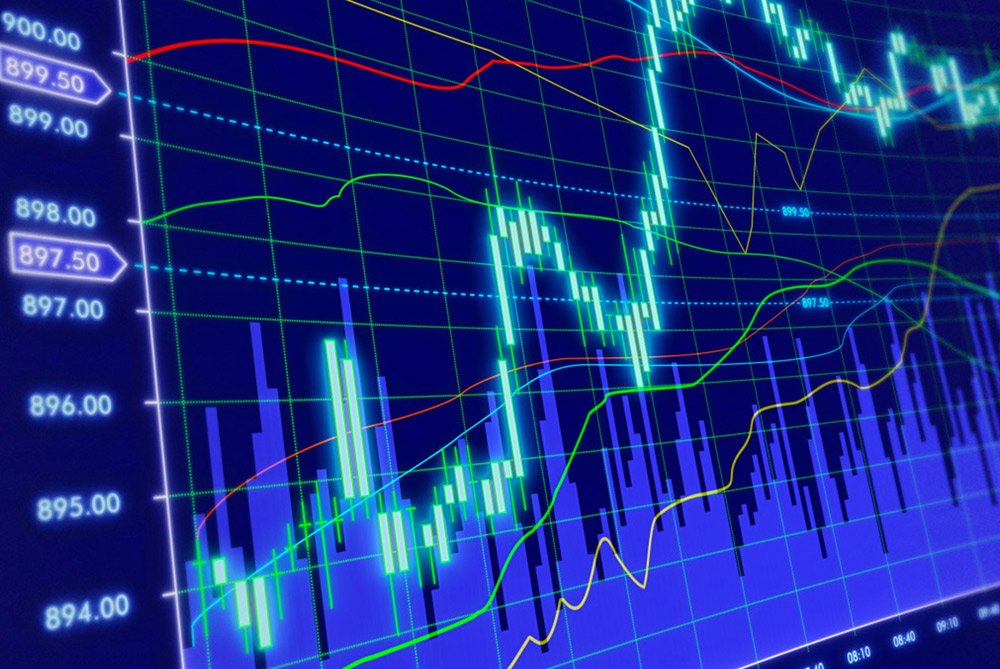 Traders have deployed various methods over the years to help them predict the movement of financial instruments. Forex charts are a very useful trading tool that facilitates individuals to conduct technical analysis, as well as fundamental analysis with great success. Charting tools enable traders to view historical data on price movements, pinpoint trends and identify key price points to enter and exit a trade.
In this article, we look at the Forex charts essentials, so we can read the various types of charts and identify trend lines.
What is a Forex chart?
A Forex chart is a graphical depiction of historical market moves within a given timeframe. There are various types of charts available for traders to use. Their aim is to assist traders to form a market overview, provide for better forecasting and spot the market’s patterns and behaviour.
Forex charts are beneficial for both technical and fundamental traders. The technical trader concentrates on the actual advent of events by reading common chart patterns, whereas the fundamental trader attempts to analyse the association between trends detectable on the chart and macro events, such as interest rates, inflation, employment, economic growth and political risk.
Which are the most important types of charts?
- Line Chart
A line chart is the most basic type of chart used in Forex. It is formed by connecting the points, representing the closing rates of the instrument, over a time frame together with a homogeneous line. This form of chart offers the simplest way to chart the resistance and support levels. A line chart can give a trader a fairly good idea of where the price of a financial instrument has travelled over an interval of time, as it provides a panoramic overview of the overall trend. As the closing prices are frequently seen as the most significant ones to keep track of, it is not hard to see why line charts have become so widely-used.
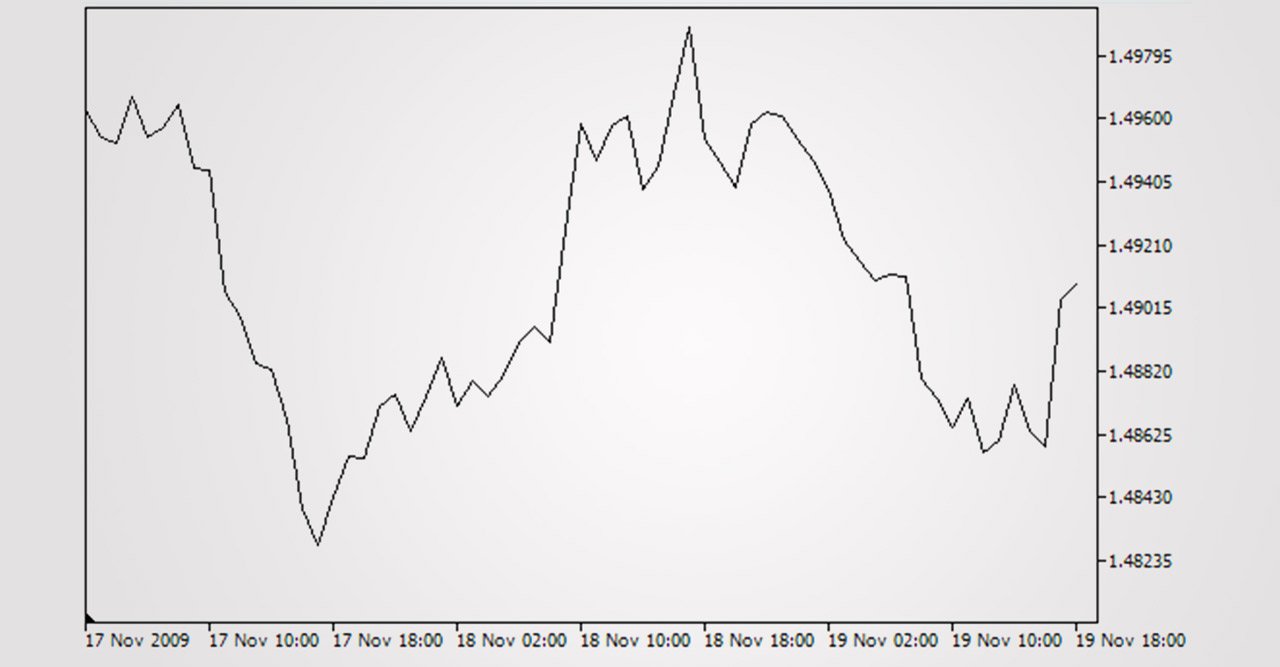
Fig.1 Line Chart
- Bar Chart
A bar chart is highly popular among the Forex world. In addition to the closing rate, each bar indicates the opening rate, as well as the high and low of the selected time frame in order to see the strength of a movement. The bar chart is formulated by a series of vertical lines that represent each data point. The top of the vertical line shows the highest price an instrument traded at during the period, while the bottom line indicates the lowest price. The closing and opening prices are represented on the vertical line by two horizontal dashes. The opening price is displayed with the dash on the left side of the vertical line, while the closing price is represented with the dash on the right side.
In general, if the left dash (opening price) is lower than the right dash (closing price), then the bar will be shaded black, indicating an up period for the instrument, meaning that it has gained value. Conversely, when the right dash (closing) is lower than the left dash (opening), it marks that the asset has fallen in value over that period. When looking, for example, at a weekly/daily/15 minute chart, each bar indicates one week/day/15 minute period of trading activity. This visual depiction of price activity over a certain timeframe provides detailed information of the price movement and it is used to pinpoint trends and patterns.
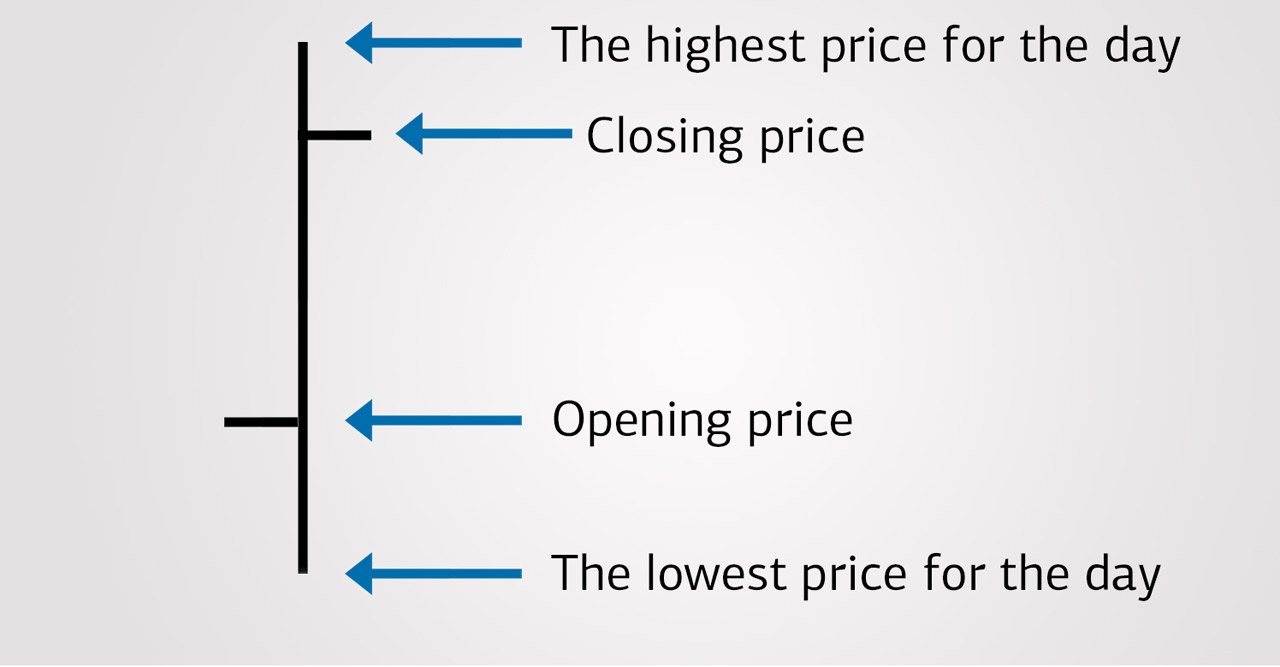
Fig.2 Bar Chart
- Candlestick Chart
Candlestick charts have been used for around 300 years and present a wealth of information over a small amount of time. Similar to the bar chart, the candlestick chart represents the opening, closing, high and low prices of an instrument for a selected time period. The wide part of the candle is called the “real body” and it shows the range between the opening and closing prices of the period’s trading. A transparent body dictates that the specific period closed higher than the open price (bullish). A filled in body means that it closed below the open price (bearish).
Just above and below the real body are the “shadows”. Traders think of them as the wicks of the candle and they indicate the time interval’s high and low. When the upper shadow on a bearish time frame is short it means that the opening price was closer to the high of the period. A short upper shadow on a bullish time frame means that the closing price was near the high. The shapes of the candlesticks differ according to the relationship between the period’s high, low, opening and closing rates.
Candlestick charts are used to identify when to enter and exit a trade. By viewing a series of candlesticks, you are also able to see another crucial concept of charting: the trend.
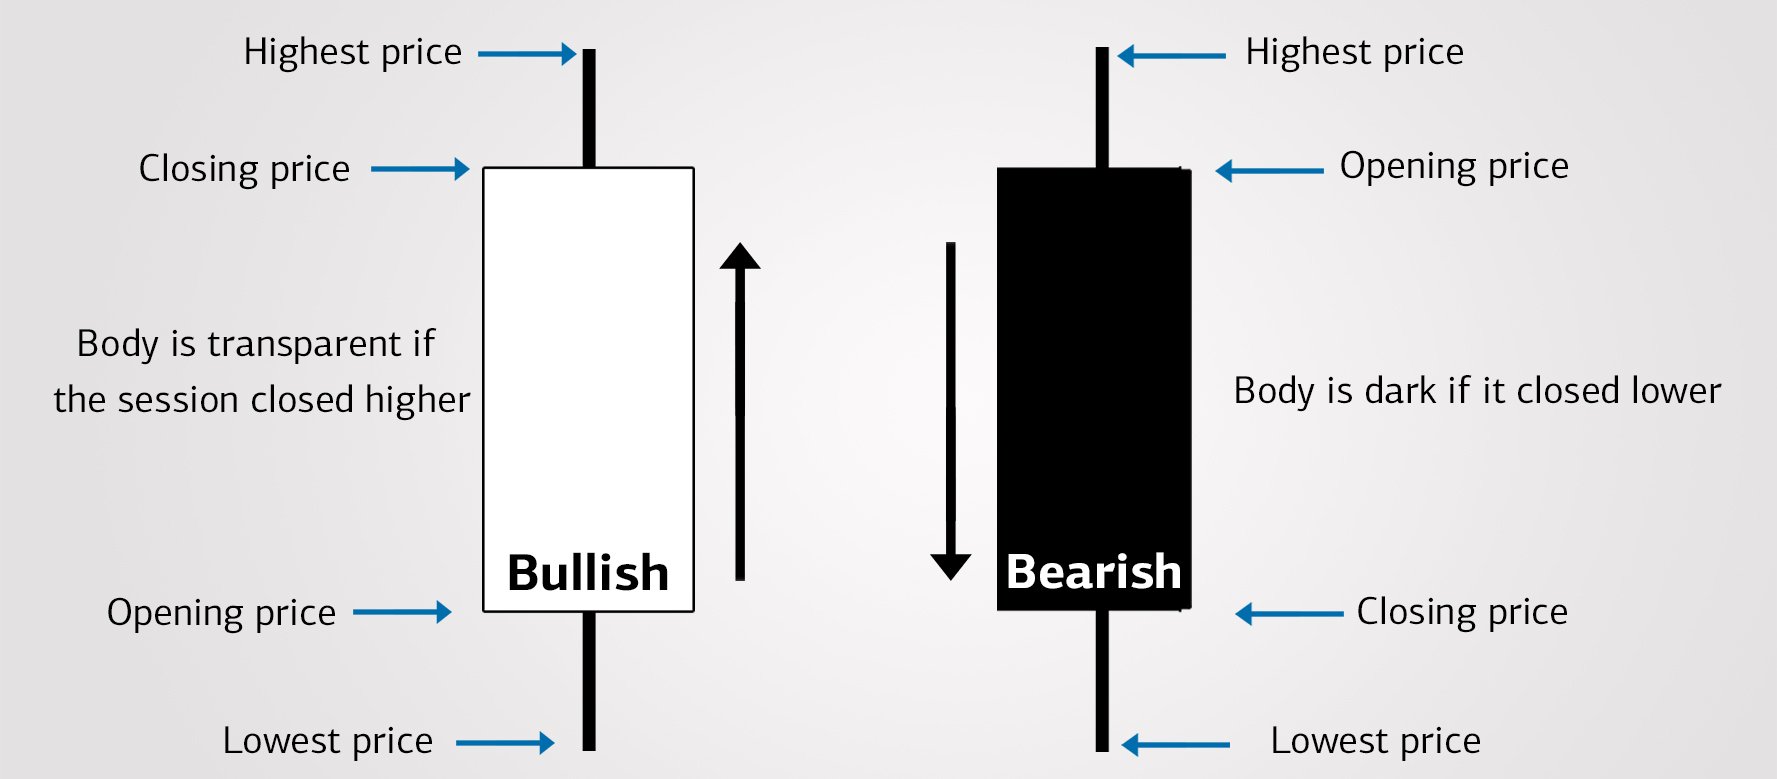
Fig.3 Candlestick Chart
- What is a trend?
A trend is the main direction in which a financial instrument is headed towards. Usually, prices trend in a sequence of progressively moving highs and lows. There are three types of trends; uptrend (bull market), downtrend (bear market) or sideways (range bound market). An uptrend is a sequence of rising high and low points, a downtrend is a sequence of declining low and high points, while sideways trend arises when there is negligible shift up or down.
In conjunction with the three types of trends, there are also three trend lengths that relate with the time interval in which the trend occurs. A term of any trend can be categorised as long-term, intermediate or short-term. A long-term trend consists of various intermediate trends, while short-term trends form intermediate and long-term trends.
Trend lines are used to assist traders to visually acknowledge which trend direction is in place. Until the trend is broken, traders can logically anticipate the trend to continue. Trend lines can also be used in identifying trend reversals. A trend reversal occurs when each successive high or low falls below or climbs above the previous point of the trend.
Drawing a trend line is simply drawing a straight line that connects two or more extreme highs or lows that follow the generic trend. An upward trend line connects the low points of an upward trend. This will indicate the support level where the price tends to find support as it is moving down. This means that the price is likely to bounce off this level rather than break through it. A downward trend line, on the other hand, connects the high points of a downward trend. This will dictate where the price tends to find resistance as it is going up. Similarly, this means that the price is more likely to bounce off this level, rather than break through it.
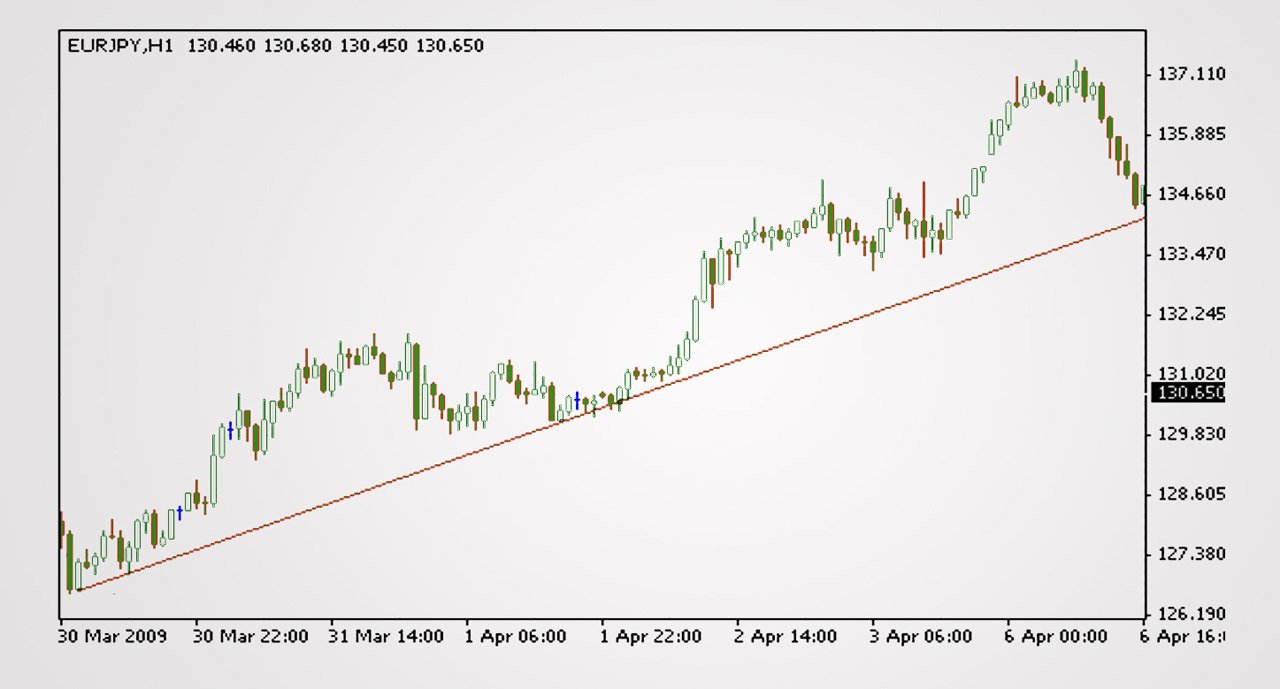
Fig. 4 Upward Trend Line – Support Level
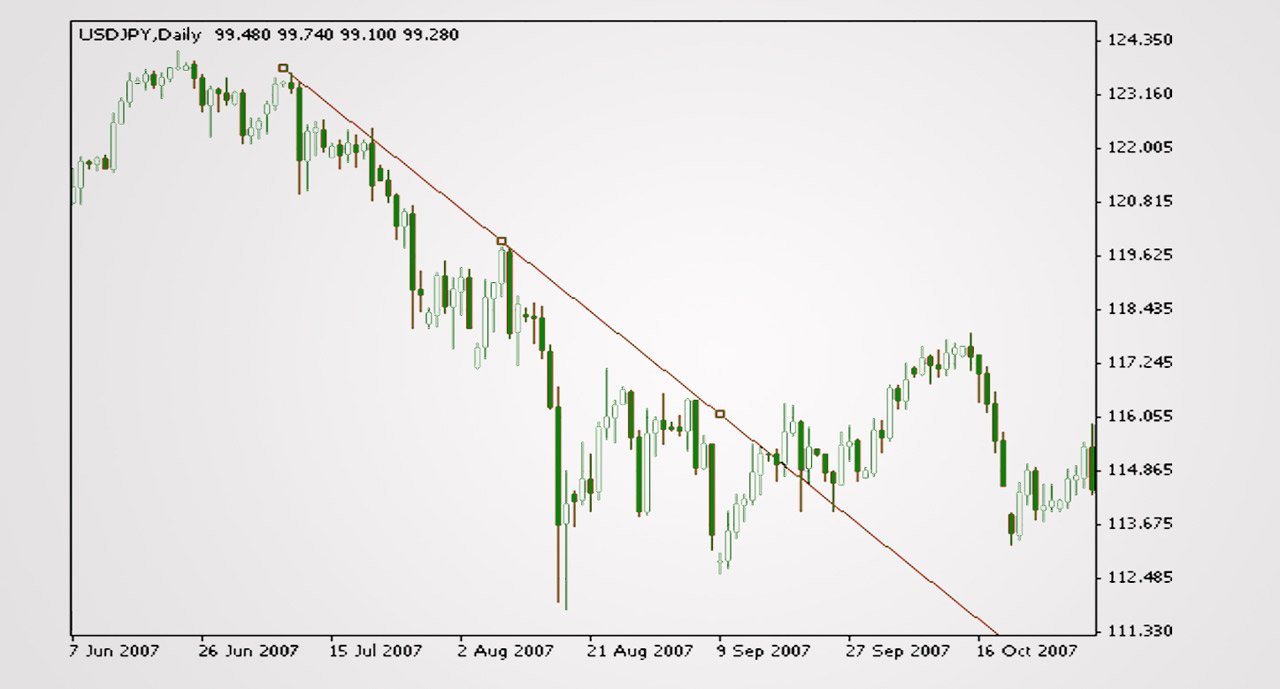
Fig. 5 Downward Trend Line – Resistance Level
It is imperative that you know how to read charts and identify trends in order to form a successful Forex trading strategy and consistently profit in financial markets.
© 2000-2026. All rights reserved.
This site is managed by Teletrade D.J. LLC 2351 LLC 2022 (Euro House, Richmond Hill Road, Kingstown, VC0100, St. Vincent and the Grenadines).
The information on this website is for informational purposes only and does not constitute any investment advice.
The company does not serve or provide services to customers who are residents of the US, Canada, Iran, The Democratic People's Republic of Korea, Yemen and FATF blacklisted countries.
Making transactions on financial markets with marginal financial instruments opens up wide possibilities and allows investors who are willing to take risks to earn high profits, carrying a potentially high risk of losses at the same time. Therefore you should responsibly approach the issue of choosing the appropriate investment strategy, taking the available resources into account, before starting trading.
Use of the information: full or partial use of materials from this website must always be referenced to TeleTrade as the source of information. Use of the materials on the Internet must be accompanied by a hyperlink to teletrade.org. Automatic import of materials and information from this website is prohibited.
Please contact our PR department if you have any questions or need assistance at pr@teletrade.global.


