- TeleTrade
- Сooperation
- News
- Rock your trading strategy with these powerful technical tools
Rock your trading strategy with these powerful technical tools
 One of the fundamental axioms of technical analysis is that historical price movement predicts future price movement. However, since the Forex market operates round-the-clock, there tends to be a vast amount of data that a trader needs to take into account in order to gauge future price action accurately. Savvy traders, who want to keep up with the market, spice up their technical analysis by applying indicators, thus enhancing the statistical importance of their forecast.
Here, we discuss the use of technical indicators and introduce moving averages to help you equip you trading arsenal with the most powerful weapons for making accurate predictions.
Move along the market
A vast number of traders utilize technical analysis, as it presumes that all the elements that affect a price - be it of economic, political or psychological nature – have already been factored into the current market rates. With so many technical traders and so much capital exchanging hands every day, what turns out to be important is the trend of the market and flow of funds.
The market may be moving in a trend or in a range, with no clear direction. A trending market is where the price moves in a single direction, either up or down. Several price reversals may occur, but nothing big enough to impede the price action from resuming its initial direction. A trend in a daily chart may last for a few minutes or hours and a trend in a longer-term chart my last for several weeks or months.
On the other hand, a ranging market is where the price bounces between a higher price and a lower price. The higher price acts as resistance, thus preventing the price from heading above it and the lower price acts as support, thus preventing it from moving below it. The price range can be small or large. In case that the range is too small, the market is regarded to be moving sideways, with minimal upward or downward movement.
A trader’s primary objective is to determine whether the price will trend in a specific direction or remain range-bound. The most common way to identify this characteristic is to plot lines to connect the historical levels of the price’s movement. These levels of support and resistance are used to establish whether or not the trend or range-bound movement will continue.
Tracking the trend with indicators
Traders employ a number of different indicators in combination with chart patterns to help them predict the future movement of the traded instrument. Indicators are mathematically-based technical analysis tools that are used to analyze the previous and forecast future price trends and patterns. Where fundamentalists monitor economic reports and financial events, technical traders use indicators to assist them in interpreting the market. The objective in utilizing indicators is to spot trading opportunities.
There are many reliable indicators that can be used effectively by a trader. Each indicator is suitable for different conditions, thus you have to know which works best under different situations and make the right choice according to the particular conditions. Some work best in trending markets, while others are suitable for pinpointing trend reversal points. Therefore, it is essential before selecting an indicator to first identify the market situation.
Once you have conducted this small analysis, you may select the best indicator for your needs. Novice traders’ most common mistake is using the same indicators during all market conditions. This often generates conflicting signals and poses difficulties in correctly identifying good entry and exit points.
Introducing moving averages
Moving averages are among the most widely used indicators in technical analysis. A moving average (MA) represents the average value of a particular set of information. It can use data, such as the closing price, over a specific time interval, for example of the previous 10 days. In this instance, the MA calculates the closing prices over the last 10 trading days and divides them by 10 to generate an average value. It is greatly helpful in assisting traders to smooth out price movement, by removing the ‘noise’ from arbitrary price fluctuations in order to track a trend.
Trend following indicator
A moving average is a trend following indicator, as it generally moves with the price. When the price changes direction, it crosses the MA. It is also a lagging indicator, since it is generated based on previous prices and signals the beginning of a trend, only after it already occurred. The figure that is most commonly used in gauging a MA is the closing price, as it is considered the most significant price level of the trading day.
Let us assume that we are calculating a 10-period MA on a 10-minute chart. Every point of the MA is gauged from the average closing price of 10 ten-minute candles. With every new ten-minute candle, the MA will continue to use the average close price of the most recent ten periods, thus resulting in a continuous line. Traders may compare moving averages of different time frames to see market momentum.
There are three types of moving averages; simple, exponential and weighted moving averages. The basic difference between these types of MAs lies in the way they are measured. Due to this feature, they appear differently on a price chart. The Simple Moving Average uses each period with equal weighting in its calculations, while the Exponential and Weighted Moving Averages put weight on most recent prices in their calculations.
Time period
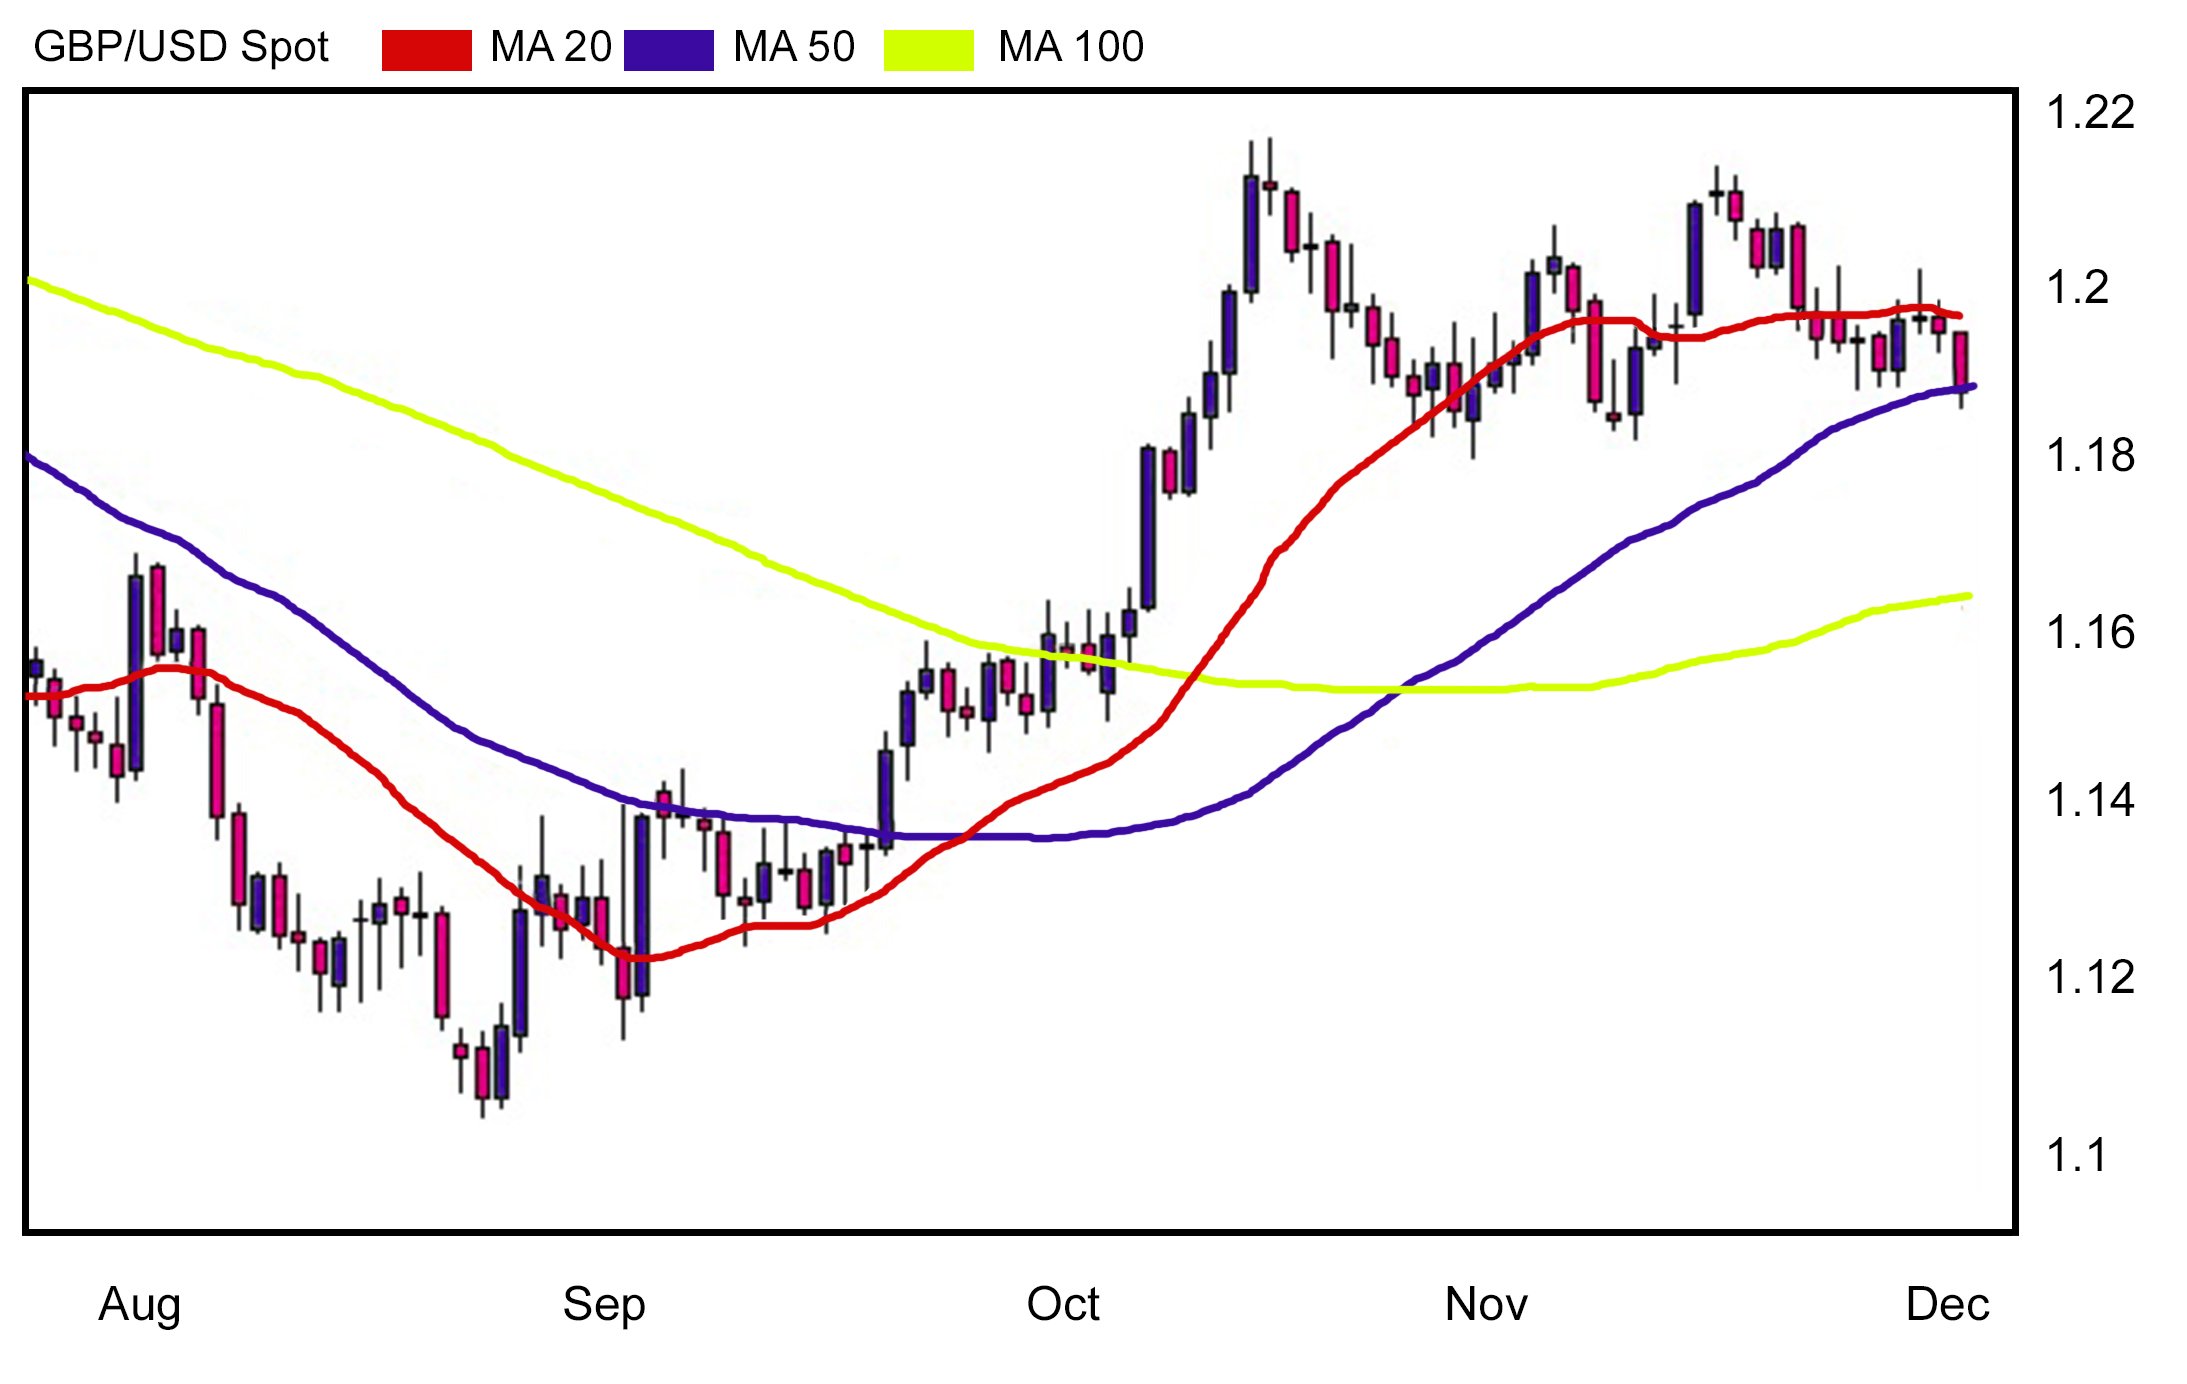
There are no particular rules to choose the time period for a moving average, so the choice is based on each trader’s preference. As different periods are used, a trader may categorise them into short-term averages (10-30 periods), medium-term averages (30-80 periods) and long-term averages (100-200 periods). The shorter the period, the more quickly the MA will change with price movement. The longer the period, the more slowly it will change with price movement. Nevertheless, the signals produced by longer-term averages are more reliable.
A 20-period moving average will take into account the last 20 periods, therefore it will respond to the change in price direction very fast. However, a trader may receive false signals in the trend change, as short-term spikes – relatively large upward or downward price moves in a short period - may appear. Conversely, a 100-period moving average will need a longer period to respond, but will probably generate a fewer number of false signals. Generated signals, however, may be less frequent, because of the slower reaction.
Dynamic support and resistance
Aside from pinpointing trends, MAs can also signal entry or exit points. When the price touches the moving average, an investor after carefully observing the chart, may open a long or short position. In this case, MAs act the same way as horizontal support or resistance lines and that is why they are also known as dynamic support and resistance. If the current price action is above the moving average, the latter will operate as support, while if the price is below the moving average, it will operate as resistance.
MAs convey significant trading signals on their own or when two of them cross over. A rising MA shows that the price is trending upwards, whereas a falling MA shows that it is trending downwards. In the same way, an upward trend can be confirmed with a bullish crossover, which takes place when a short-term MA crosses above a longer-term MA. Conversely, downward trend can be confirmed with a bearish crossover, which happens when a short-term MA crosses below a longer-term MA.
Trend is your friend
Make the trend work in your favour and increase the number of your successful trades, by integrating indictors in your trading strategy.


© 2000-2026. All rights reserved.
This site is managed by Teletrade D.J. LLC 2351 LLC 2022 (Euro House, Richmond Hill Road, Kingstown, VC0100, St. Vincent and the Grenadines).
The information on this website is for informational purposes only and does not constitute any investment advice.
The company does not serve or provide services to customers who are residents of the US, Canada, Iran, The Democratic People's Republic of Korea, Yemen and FATF blacklisted countries.
Making transactions on financial markets with marginal financial instruments opens up wide possibilities and allows investors who are willing to take risks to earn high profits, carrying a potentially high risk of losses at the same time. Therefore you should responsibly approach the issue of choosing the appropriate investment strategy, taking the available resources into account, before starting trading.
Use of the information: full or partial use of materials from this website must always be referenced to TeleTrade as the source of information. Use of the materials on the Internet must be accompanied by a hyperlink to teletrade.org. Automatic import of materials and information from this website is prohibited.
Please contact our PR department if you have any questions or need assistance at pr@teletrade.global.
transfers