- Analytics
- News and Tools
- Market News
- EUR/JPY Price Analysis: Bears look to 130.20/50 price targets
EUR/JPY Price Analysis: Bears look to 130.20/50 price targets
- EUR/JPY bearish confluences point to an imminent downside correction.
- EUR/JPY bears are looking for an optimal entry point.
EUR/JPY has rallied as the Yen takes up the last position according to the CSI indicators. The market is getting behind the inflation theme which is seeing flows driven towards the commodity complex and higher-yielding currencies. This leaves the euro vulnerable and the yen is potentially due for a positive correction making EUR/JPY's recent rally a potential shorting opportunity. The following illustrates the bearish confluence on both the weekly and daily time frames with prospects of a 1-hour trade set-up.
Weekly chart
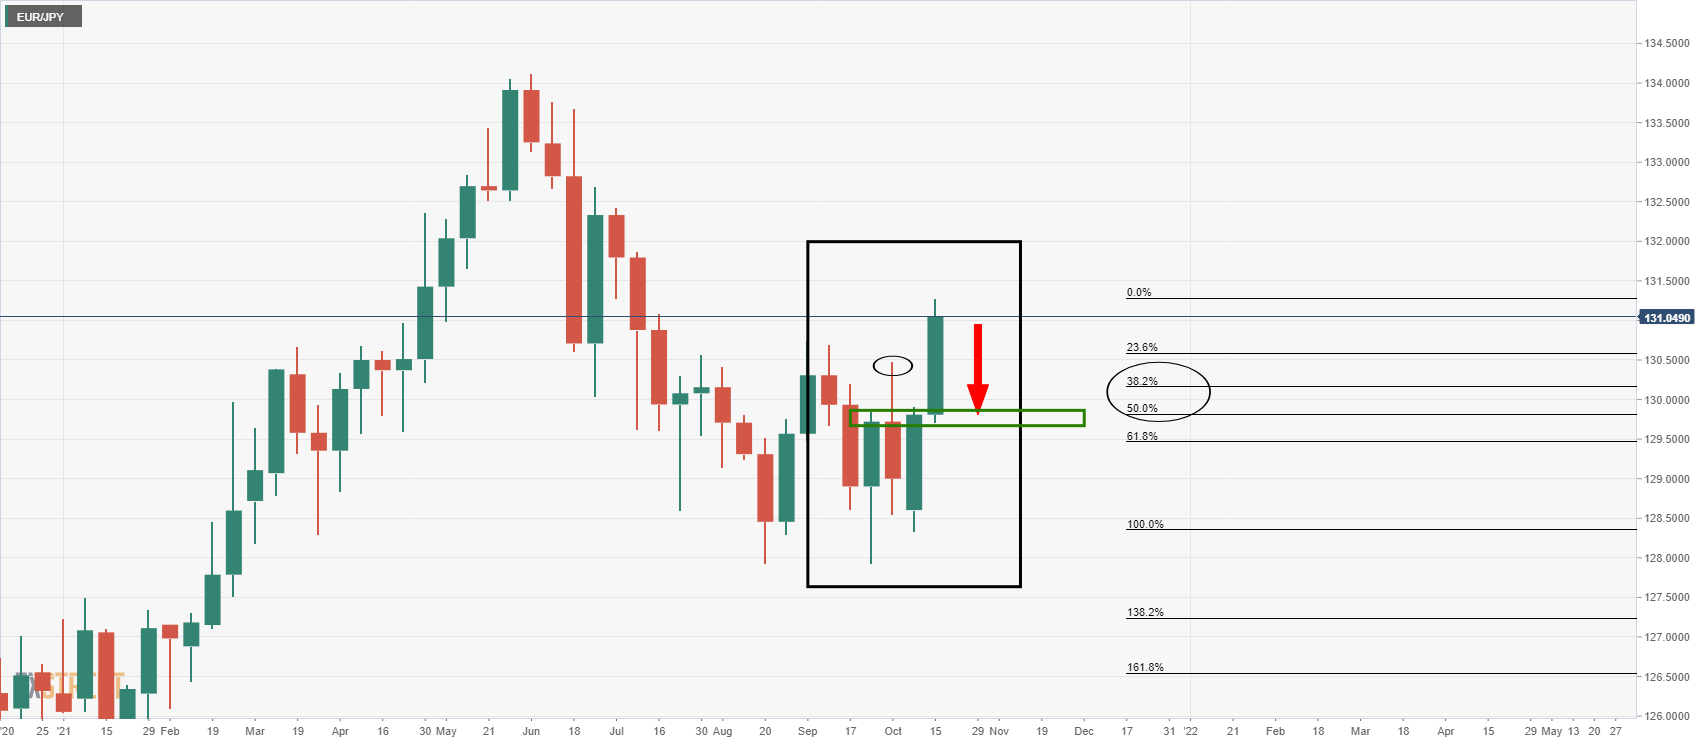
From a weekly perspective, the price is firmly bid and it can easily move higher. However, when examining the price action on the lower time frames, it makes the W-formation on both the weekly and daily charts compelling.
The W and M harmonic patterns are reversion patterns by nature and have a high completion rate. Therefore, the price would be expected to retrace some of the recent bids in due course. Examining the daily chart, that reversion could be imminent.
Daily chart
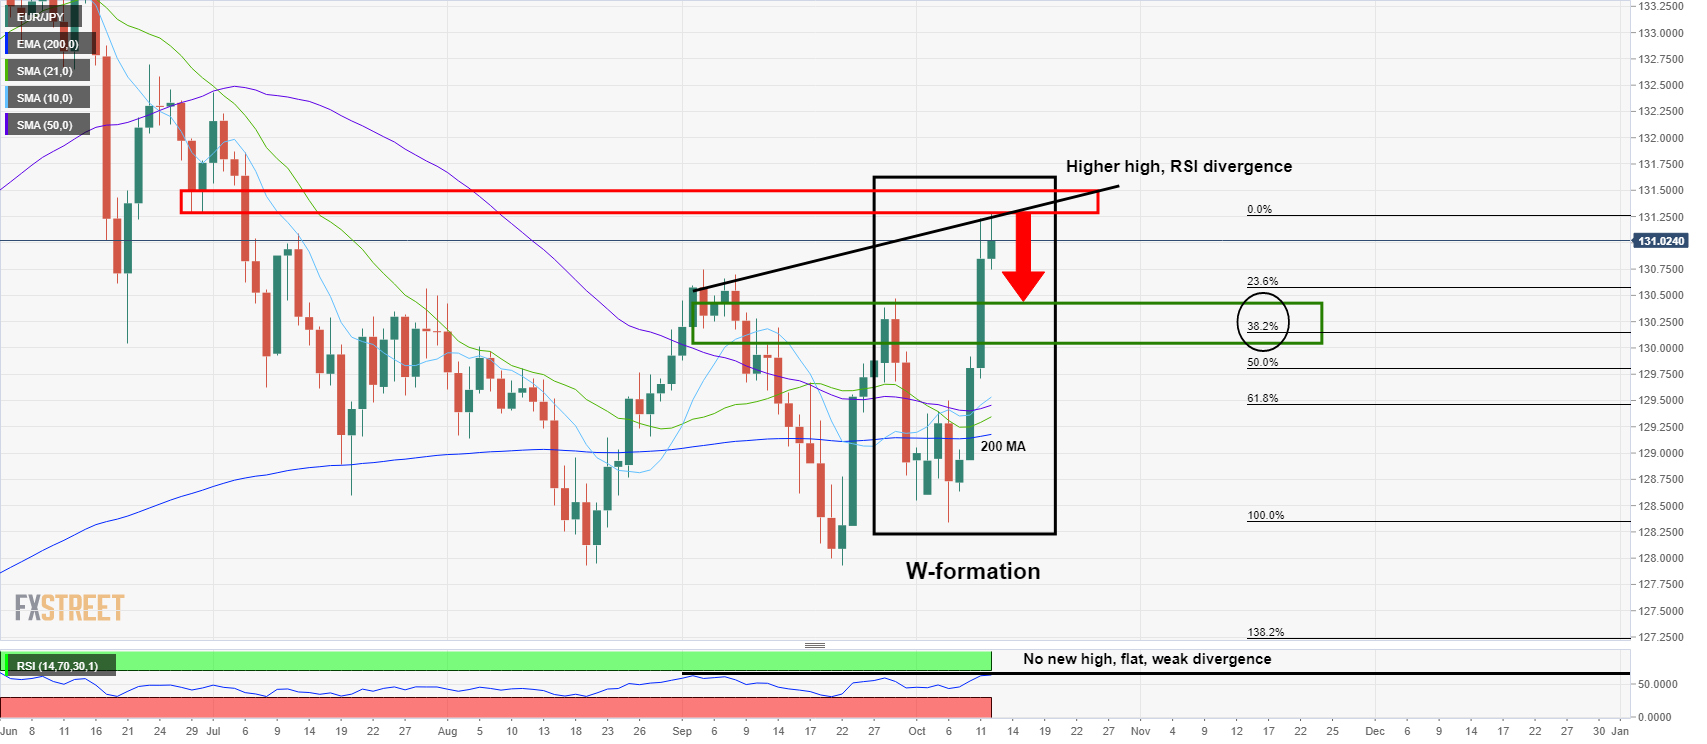
As illustrated, the daily chart is meeting resistance and the price is well above the 200-day moving average and a cluster of the 10, 21, and 50 MAs. Additionally, by measuring the peaks of Aug to current highs and comparing them to no fresh highs in RSI over the same time period, this is a bearish divergence.
However, it is a relatively weak divergence considering RSI is flat between the peaks. We would want to see a lower current high to that of Aug's peak for stronger divergence. Nonetheless, the confluence of factors points to a downside correction. A target to the prior daily highs near the 38.2% Fibonacci retracement level is a compelling zone between and near 130.50 and 130.20.
EUR/JPY, 1-hour chart
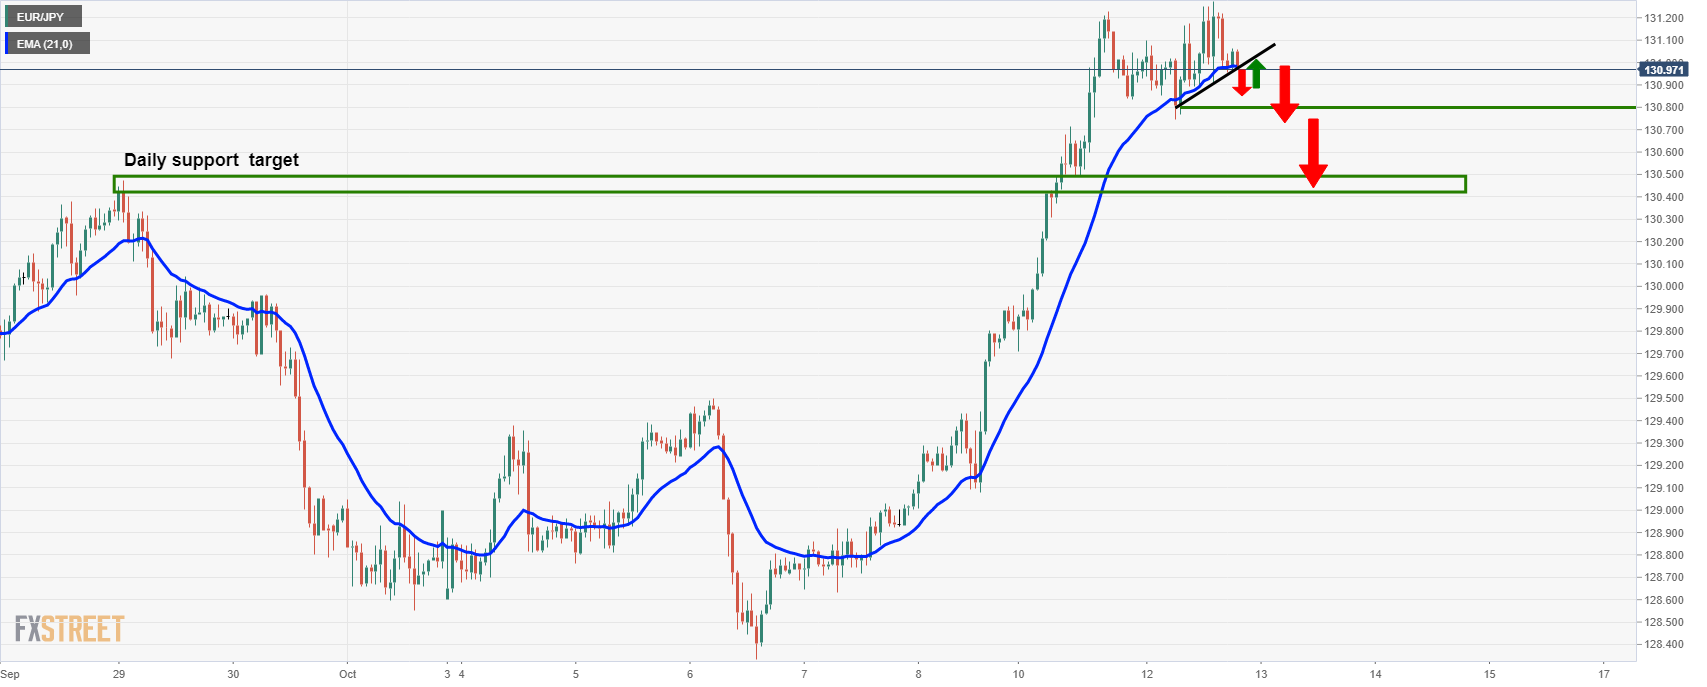
The 1-hour time frame is a suitable chart to monitor for an optimal entry point for a swing towards the daily target near the 130.20/50 zone. Bears would be prudent to wait for a break of dynamic trendline support and then to expect a restest of the structure as a counter-trendline. Then, the horizontal support near 130.80, if broken, would be expected to act as resistance on any restest. This would likely lead to a deterioration of bids equating to a significant downside correction as per the daily chart's forecast above.


© 2000-2026. All rights reserved.
This site is managed by Teletrade D.J. LLC 2351 LLC 2022 (Euro House, Richmond Hill Road, Kingstown, VC0100, St. Vincent and the Grenadines).
The information on this website is for informational purposes only and does not constitute any investment advice.
The company does not serve or provide services to customers who are residents of the US, Canada, Iran, The Democratic People's Republic of Korea, Yemen and FATF blacklisted countries.
Making transactions on financial markets with marginal financial instruments opens up wide possibilities and allows investors who are willing to take risks to earn high profits, carrying a potentially high risk of losses at the same time. Therefore you should responsibly approach the issue of choosing the appropriate investment strategy, taking the available resources into account, before starting trading.
Use of the information: full or partial use of materials from this website must always be referenced to TeleTrade as the source of information. Use of the materials on the Internet must be accompanied by a hyperlink to teletrade.org. Automatic import of materials and information from this website is prohibited.
Please contact our PR department if you have any questions or need assistance at pr@teletrade.global.
transfers